Races in Troy, New York (NY) Detailed Stats
Data:
Races - White alone (%)
Races - White alone (% change since 2000)
Races - Black alone (%)
Races - Black alone (% change since 2000)
Races - American Indian alone (%)
Races - American Indian alone (% change since 2000)
Races - Asian alone (%)
Races - Asian alone (% change since 2000)
Races - Hispanic (%)
Races - Hispanic (% change since 2000)
Races - Native Hawaiian and Other Pacific Islander alone (%)
Races - Native Hawaiian and Other Pacific Islander alone (% change since 2000)
Races - Two or more races(%)
Races - Two or more races(% change since 2000)
Races - Other race alone (%)
Races - Other race alone (% change since 2000)
Racial diversity
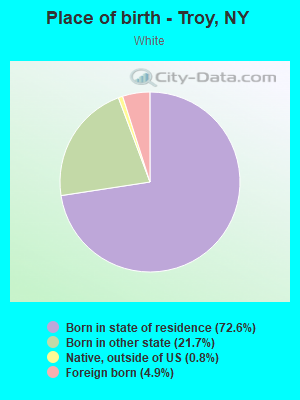
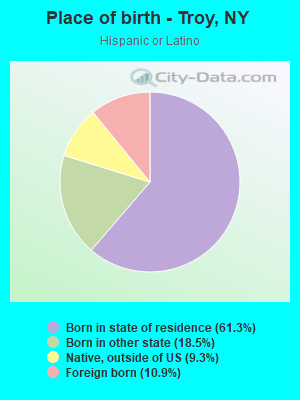
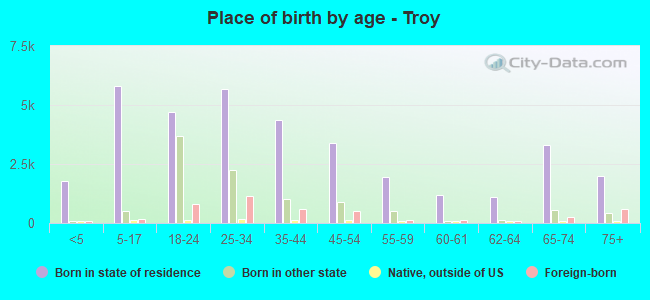
Place of birth - Born in state of residence (%)
Place of birth - Born in state of residence (%) - White
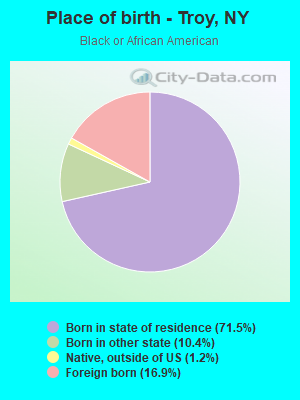
Place of birth - Born in state of residence (%) - Black or African American
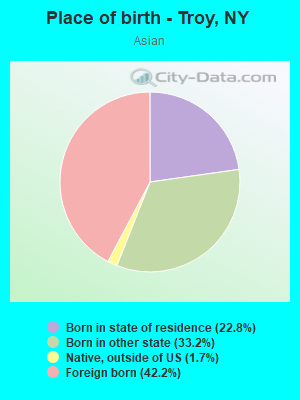
Place of birth - Born in state of residence (%) - Asian
Place of birth - Born in state of residence (%) - Hispanic or Latino
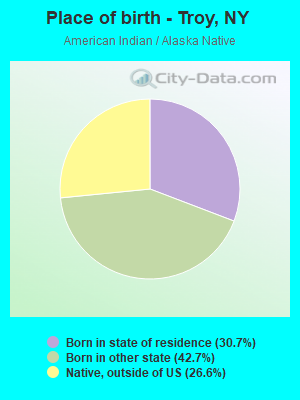
Place of birth - Born in state of residence (%) - American Indian and Alaska Native
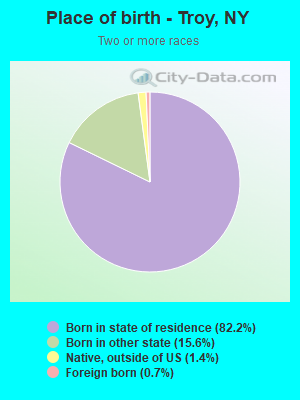
Place of birth - Born in state of residence (%) - Multirace
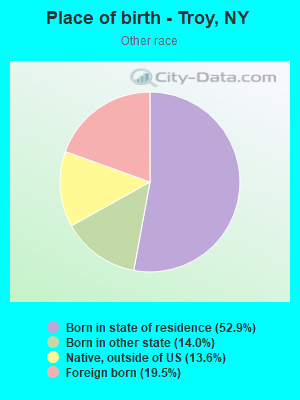
Place of birth - Born in state of residence (%) - Other Race
Place of birth - Born in other state (%)
Place of birth - Born in other state (%) - White
Place of birth - Born in other state (%) - Black or African American
Place of birth - Born in other state (%) - Asian
Place of birth - Born in other state (%) - Hispanic or Latino
Place of birth - Born in other state (%) - American Indian and Alaska Native
Place of birth - Born in other state (%) - Multirace
Place of birth - Born in other state (%) - Other Race
Place of birth - Native, outside of US (%)
Place of birth - Native, outside of US (%) - White
Place of birth - Native, outside of US (%) - Black or African American
Place of birth - Native, outside of US (%) - Asian
Place of birth - Native, outside of US (%) - Hispanic or Latino
Place of birth - Native, outside of US (%) - American Indian and Alaska Native
Place of birth - Native, outside of US (%) - Multirace
Place of birth - Native, outside of US (%) - Other Race
Place of birth - Foreign born (%)
Place of birth - Foreign born (%) - White
Place of birth - Foreign born (%) - Black or African American
Place of birth - Foreign born (%) - Asian
Place of birth - Foreign born (%) - Hispanic or Latino
Place of birth - Foreign born (%) - American Indian and Alaska Native
Place of birth - Foreign born (%) - Multirace
Place of birth - Foreign born (%) - Other Race
Residents speaking English at home (%)
Residents speaking English at home - Born in the United States (%)
Residents speaking English at home - Native, born elsewhere (%)
Residents speaking English at home - Foreign born (%)
Residents speaking Spanish at home (%)
Residents speaking Spanish at home - Born in the United States (%)
Residents speaking Spanish at home - Native, born elsewhere (%)
Residents speaking Spanish at home - Foreign born (%)
Residents speaking other language at home (%)
Residents speaking other language at home - Born in the United States (%)
Residents speaking other language at home - Native, born elsewhere (%)
Residents speaking other language at home - Foreign born (%)
Marital status - Never married (%)
Marital status - Now married (%)
Marital status - Separated (%)
Marital status - Widowed (%)
Marital status - Divorced (%)
Ancestries Reported - Arab (%)
Ancestries Reported - Czech (%)
Ancestries Reported - Danish (%)
Ancestries Reported - Dutch (%)
Ancestries Reported - English (%)
Ancestries Reported - French (%)
Ancestries Reported - French Canadian (%)
Ancestries Reported - German (%)
Ancestries Reported - Greek (%)
Ancestries Reported - Hungarian (%)
Ancestries Reported - Irish (%)
Ancestries Reported - Italian (%)
Ancestries Reported - Lithuanian (%)
Ancestries Reported - Norwegian (%)
Ancestries Reported - Polish (%)
Ancestries Reported - Portuguese (%)
Ancestries Reported - Russian (%)
Ancestries Reported - Scotch-Irish (%)
Ancestries Reported - Scottish (%)
Ancestries Reported - Slovak (%)
Ancestries Reported - Subsaharan African (%)
Ancestries Reported - Swedish (%)
Ancestries Reported - Swiss (%)
Ancestries Reported - Ukrainian (%)
Ancestries Reported - United States (%)
Ancestries Reported - Welsh (%)
Ancestries Reported - West Indian (%)
Ancestries Reported - Other (%)
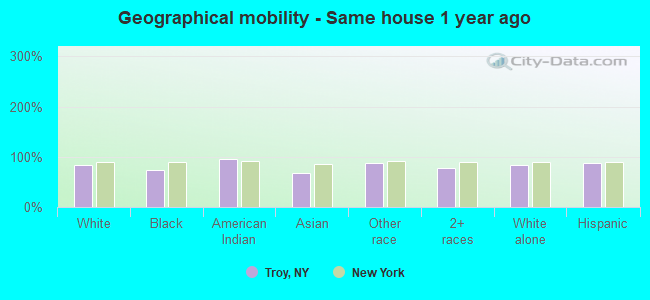
Geographical mobility - Same house 1 year ago (%)
Geographical mobility - Same house 1 year ago (%) - White
Geographical mobility - Same house 1 year ago (%) - Black or African American
Geographical mobility - Same house 1 year ago (%) - Asian
Geographical mobility - Same house 1 year ago (%) - Hispanic or Latino
Geographical mobility - Same house 1 year ago (%) - American Indian and Alaska Native
Geographical mobility - Same house 1 year ago (%) - Multirace
Geographical mobility - Same house 1 year ago (%) - Other Race
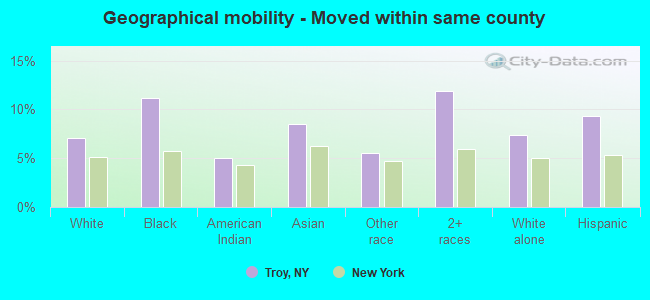
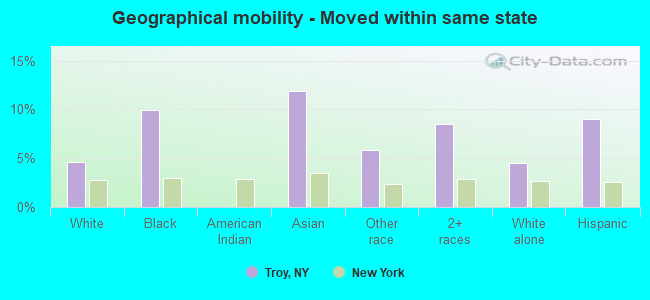
Geographical mobility - Moved within same county (%)
Geographical mobility - Moved within same county (%) - White
Geographical mobility - Moved within same county (%) - Black or African American
Geographical mobility - Moved within same county (%) - Asian
Geographical mobility - Moved within same county (%) - Hispanic or Latino
Geographical mobility - Moved within same county (%) - American Indian and Alaska Native
Geographical mobility - Moved within same county (%) - Multirace
Geographical mobility - Moved within same county (%) - Other Race
Geographical mobility - Moved from different county within same state (%)
Geographical mobility - Moved from different county within same state (%) - White
Geographical mobility - Moved from different county within same state (%) - Black or African American
Geographical mobility - Moved from different county within same state (%) - Asian
Geographical mobility - Moved from different county within same state (%) - Hispanic or Latino
Geographical mobility - Moved from different county within same state (%) - American Indian and Alaska Native
Geographical mobility - Moved from different county within same state (%) - Multirace
Geographical mobility - Moved from different county within same state (%) - Other Race
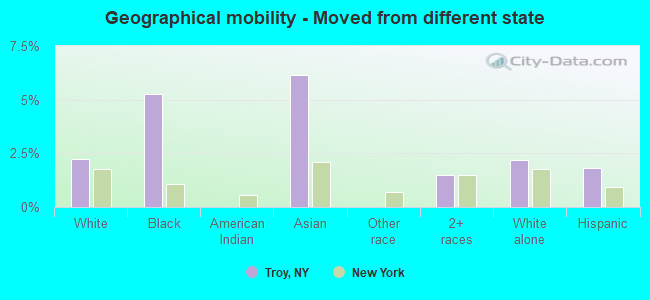
Geographical mobility - Moved from different state (%)
Geographical mobility - Moved from different state (%) - White
Geographical mobility - Moved from different state (%) - Black or African American
Geographical mobility - Moved from different state (%) - Asian
Geographical mobility - Moved from different state (%) - Hispanic or Latino
Geographical mobility - Moved from different state (%) - American Indian and Alaska Native
Geographical mobility - Moved from different state (%) - Multirace
Geographical mobility - Moved from different state (%) - Other Race
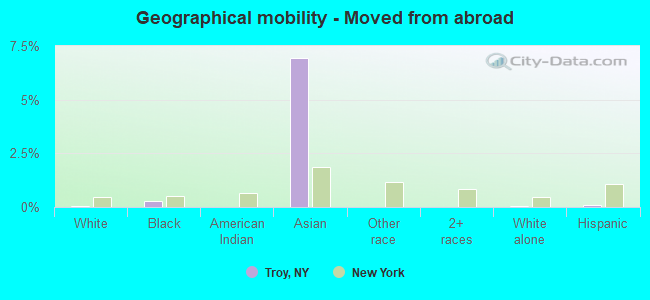
Geographical mobility - Moved from abroad (%)
Geographical mobility - Moved from abroad (%) - White
Geographical mobility - Moved from abroad (%) - Black or African American
Geographical mobility - Moved from abroad (%) - Asian
Geographical mobility - Moved from abroad (%) - Hispanic or Latino
Geographical mobility - Moved from abroad (%) - American Indian and Alaska Native
Geographical mobility - Moved from abroad (%) - Multirace
Geographical mobility - Moved from abroad (%) - Other Race
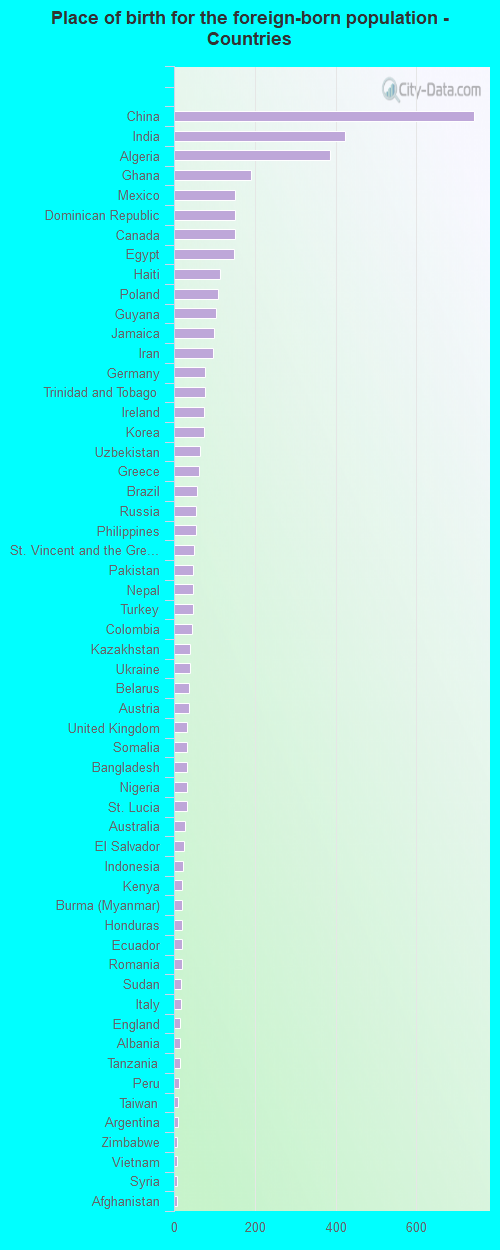
Place of birth for the foreign-born population - Ireland (%)
Place of birth for the foreign-born population - Denmark (%)
Place of birth for the foreign-born population - Norway (%)
Place of birth for the foreign-born population - Sweden (%)
Place of birth for the foreign-born population - United Kingdom (%)
Place of birth for the foreign-born population - England (%)
Place of birth for the foreign-born population - Scotland (%)
Place of birth for the foreign-born population - Other Northern Europe (%)
Place of birth for the foreign-born population - Austria (%)
Place of birth for the foreign-born population - Belgium (%)
Place of birth for the foreign-born population - France (%)
Place of birth for the foreign-born population - Germany (%)
Place of birth for the foreign-born population - Netherlands (%)
Place of birth for the foreign-born population - Switzerland (%)
Place of birth for the foreign-born population - Other Western Europe (%)
Place of birth for the foreign-born population - Greece (%)
Place of birth for the foreign-born population - Italy (%)
Place of birth for the foreign-born population - Portugal (%)
Place of birth for the foreign-born population - Spain (%)
Place of birth for the foreign-born population - Other Southern Europe (%)
Place of birth for the foreign-born population - Albania (%)
Place of birth for the foreign-born population - Belarus (%)
Place of birth for the foreign-born population - Bosnia and Herzegovina (%)
Place of birth for the foreign-born population - Bulgaria (%)
Place of birth for the foreign-born population - Croatia (%)
Place of birth for the foreign-born population - Czechoslovakia (%)
Place of birth for the foreign-born population - Hungary (%)
Place of birth for the foreign-born population - Latvia (%)
Place of birth for the foreign-born population - Lithuania (%)
Place of birth for the foreign-born population - North Macedonia (Macedonia) (%)
Place of birth for the foreign-born population - Moldova (%)
Place of birth for the foreign-born population - Poland (%)
Place of birth for the foreign-born population - Romania (%)
Place of birth for the foreign-born population - Russia (%)
Place of birth for the foreign-born population - Serbia (%)
Place of birth for the foreign-born population - Ukraine (%)
Place of birth for the foreign-born population - Other Eastern Europe (%)
Place of birth for the foreign-born population - China (%)
Place of birth for the foreign-born population - Hong Kong (%)
Place of birth for the foreign-born population - Taiwan (%)
Place of birth for the foreign-born population - Japan (%)
Place of birth for the foreign-born population - Korea (%)
Place of birth for the foreign-born population - Other Eastern Asia (%)
Place of birth for the foreign-born population - Afghanistan (%)
Place of birth for the foreign-born population - Bangladesh (%)
Place of birth for the foreign-born population - India (%)
Place of birth for the foreign-born population - Iran (%)
Place of birth for the foreign-born population - Kazakhstan (%)
Place of birth for the foreign-born population - Nepal (%)
Place of birth for the foreign-born population - Pakistan (%)
Place of birth for the foreign-born population - Sri Lanka (%)
Place of birth for the foreign-born population - Uzbekistan (%)
Place of birth for the foreign-born population - Other South Central Asia (%)
Place of birth for the foreign-born population - Burma (%)
Place of birth for the foreign-born population - Cambodia (%)
Place of birth for the foreign-born population - Indonesia (%)
Place of birth for the foreign-born population - Laos (%)
Place of birth for the foreign-born population - Malaysia (%)
Place of birth for the foreign-born population - Philippines (%)
Place of birth for the foreign-born population - Singapore (%)
Place of birth for the foreign-born population - Thailand (%)
Place of birth for the foreign-born population - Vietnam (%)
Place of birth for the foreign-born population - Other South Eastern Asia (%)
Place of birth for the foreign-born population - Armenia (%)
Place of birth for the foreign-born population - Iraq (%)
Place of birth for the foreign-born population - Israel (%)
Place of birth for the foreign-born population - Jordan (%)
Place of birth for the foreign-born population - Kuwait (%)
Place of birth for the foreign-born population - Lebanon (%)
Place of birth for the foreign-born population - Saudi Arabia (%)
Place of birth for the foreign-born population - Syria (%)
Place of birth for the foreign-born population - Turkey (%)
Place of birth for the foreign-born population - Yemen (%)
Place of birth for the foreign-born population - Other Western Asia (%)
Place of birth for the foreign-born population - Eritrea (%)
Place of birth for the foreign-born population - Ethiopia (%)
Place of birth for the foreign-born population - Kenya (%)
Place of birth for the foreign-born population - Somalia (%)
Place of birth for the foreign-born population - Uganda (%)
Place of birth for the foreign-born population - Zimbabwe (%)
Place of birth for the foreign-born population - Other Eastern Africa (%)
Place of birth for the foreign-born population - Cameroon (%)
Place of birth for the foreign-born population - Congo (%)
Place of birth for the foreign-born population - Democratic Republic of Congo (Zaire) (%)
Place of birth for the foreign-born population - Other Middle Africa (%)
Place of birth for the foreign-born population - Egypt (%)
Place of birth for the foreign-born population - Morocco (%)
Place of birth for the foreign-born population - Sudan (%)
Place of birth for the foreign-born population - Other Northern Africa (%)
Place of birth for the foreign-born population - South Africa (%)
Place of birth for the foreign-born population - Other Southern Africa (%)
Place of birth for the foreign-born population - Cabo Verde (%)
Place of birth for the foreign-born population - Ghana (%)
Place of birth for the foreign-born population - Liberia (%)
Place of birth for the foreign-born population - Nigeria (%)
Place of birth for the foreign-born population - Senegal (%)
Place of birth for the foreign-born population - Sierra Leone (%)
Place of birth for the foreign-born population - Other Western Africa (%)
Place of birth for the foreign-born population - Australia (%)
Place of birth for the foreign-born population - New Zealand (%)
Place of birth for the foreign-born population - Fiji (%)
Place of birth for the foreign-born population - Micronesia (%)
Place of birth for the foreign-born population - Bahamas (%)
Place of birth for the foreign-born population - Barbados (%)
Place of birth for the foreign-born population - Cuba (%)
Place of birth for the foreign-born population - Dominica (%)
Place of birth for the foreign-born population - Dominican Republic (%)
Place of birth for the foreign-born population - Grenada (%)
Place of birth for the foreign-born population - Haiti (%)
Place of birth for the foreign-born population - Jamaica (%)
Place of birth for the foreign-born population - St. Vincent and the Grenadines (%)
Place of birth for the foreign-born population - Trinidad and Tobago (%)
Place of birth for the foreign-born population - West Indies (%)
Place of birth for the foreign-born population - Other Caribbean (%)
Place of birth for the foreign-born population - Belize (%)
Place of birth for the foreign-born population - Costa Rica (%)
Place of birth for the foreign-born population - El Salvador (%)
Place of birth for the foreign-born population - Guatemala (%)
Place of birth for the foreign-born population - Honduras (%)
Place of birth for the foreign-born population - Mexico (%)
Place of birth for the foreign-born population - Nicaragua (%)
Place of birth for the foreign-born population - Panama (%)
Place of birth for the foreign-born population - Other Central America (%)
Place of birth for the foreign-born population - Argentina (%)
Place of birth for the foreign-born population - Bolivia (%)
Place of birth for the foreign-born population - Brazil (%)
Place of birth for the foreign-born population - Chile (%)
Place of birth for the foreign-born population - Colombia (%)
Place of birth for the foreign-born population - Ecuador (%)
Place of birth for the foreign-born population - Guyana (%)
Place of birth for the foreign-born population - Peru (%)
Place of birth for the foreign-born population - Uruguay (%)
Place of birth for the foreign-born population - Venezuela (%)
Place of birth for the foreign-born population - Other South America (%)
Place of birth for the foreign-born population - Canada (%)
Place of birth for the foreign-born population - Other Northern America (%)
Place of birth for the foreign-born population - Other (%)
Latest news about races in Troy, NY collected exclusively by city-data.com from local newspapers, TV, and radio stations
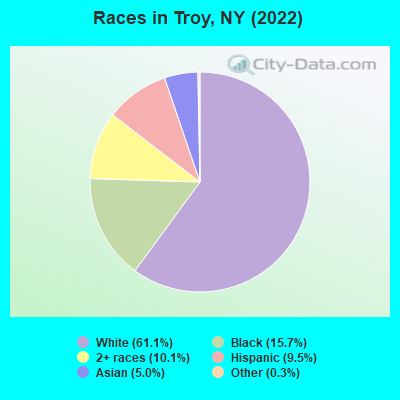
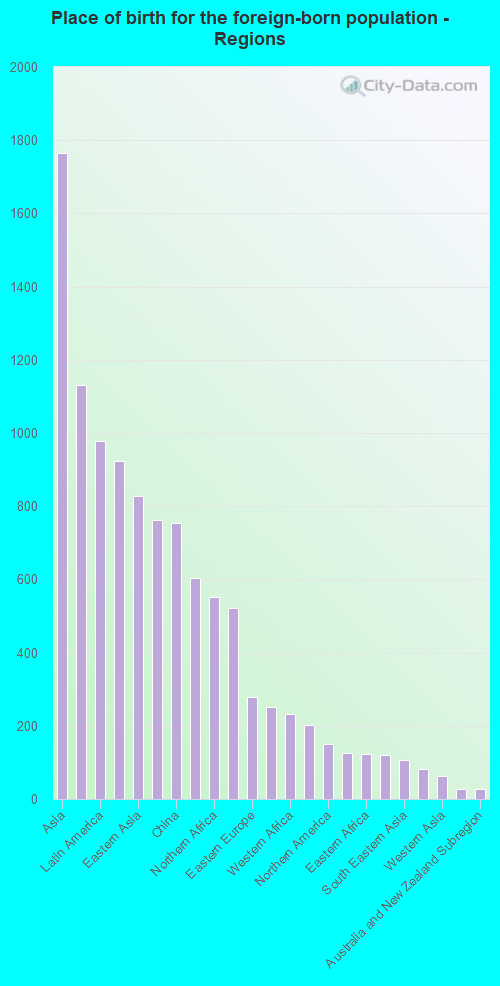
According to 2022 data, the most numerous races in Troy, NY are White alone (31,100 residents), Hispanic (4,824 residents), and Black alone (7,971 residents). 88.0% of Troy residents speak English at home. 8.7% of Troy, NY residents are foreign-born (3.5% born in Asia, 1.9% born in Latin America, 1.8% born in Africa, 1.2% born in Europe), which is 151.6% less than the foreign-born rate of 22.0% across the entire state of New York.
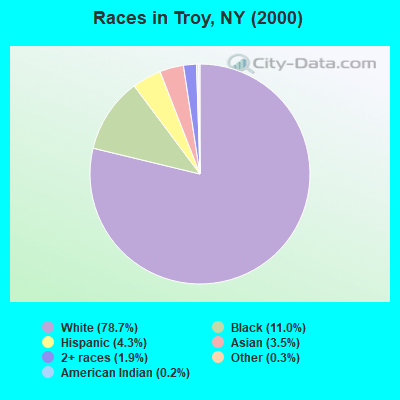
Race distribution in Troy
2000 2022
11,760,981 62.0% White alone 2,867,583 15.1% Hispanic 2,812,623 14.8% Black alone 1,035,926 5.5% Asian alone 366,116 1.9% Two or more races 75,499 0.4% Other race alone 52,499 0.3% American Indian alone 5,230 0.03% Native Hawaiian and Other
10,408,933 52.9% White alone 3,867,299 19.7% Hispanic 2,633,840 13.4% Black alone 1,776,286 9.0% Asian alone 732,670 3.7% Two or more races 216,110 1.1% Other race alone 35,082 0.2% American Indian alone 6,931 0.04% Native Hawaiian and Other
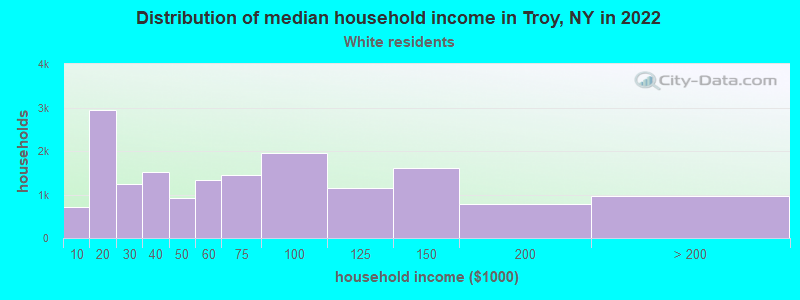
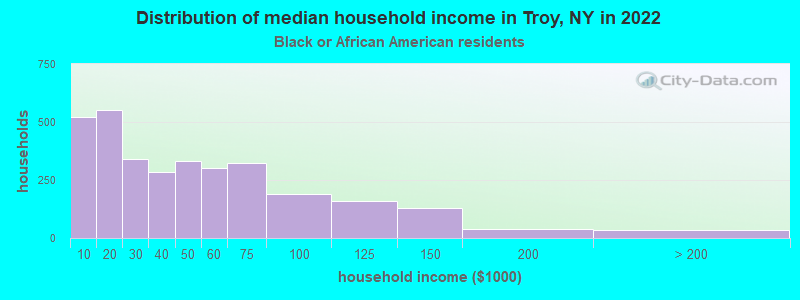
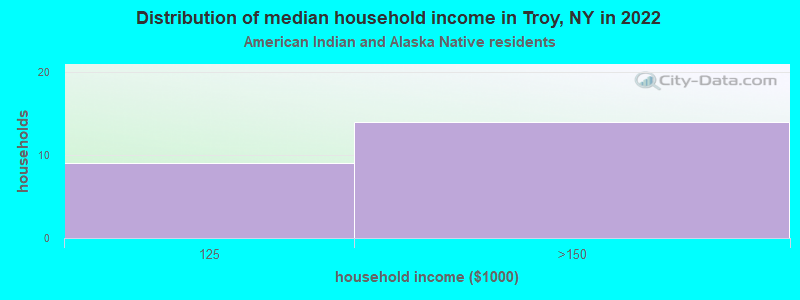
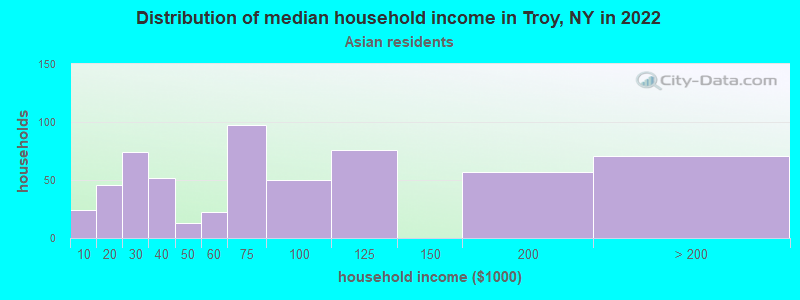
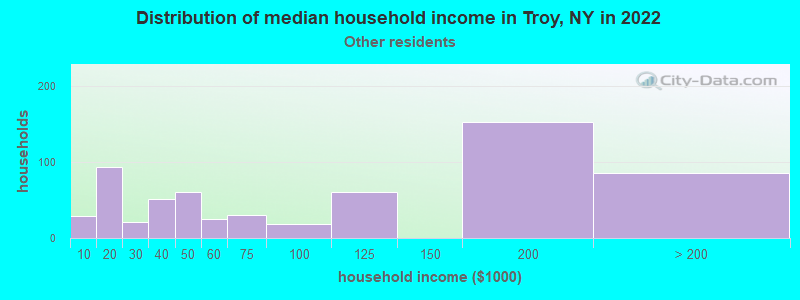
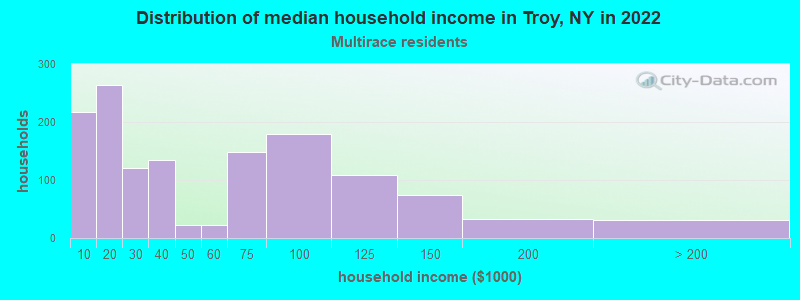
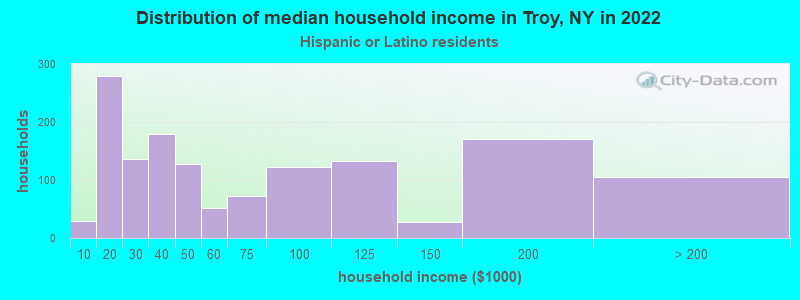
Income and house value in Troy Median household income in 2022 $61,643 White non-Hispanic householders$35,399 Black householders$50,969 Asian householders$32,639 Two or more races householders$41,855 Hispanic or Latino race householdersMedian 2022 house value $197,389 White Non-Hispanic householders$178,366 Black or African American householders$290,936 American Indian or Alaska Native householders $195,822 Asian householders$177,247 Two or more races householders$218,202 Hispanic or Latino householders
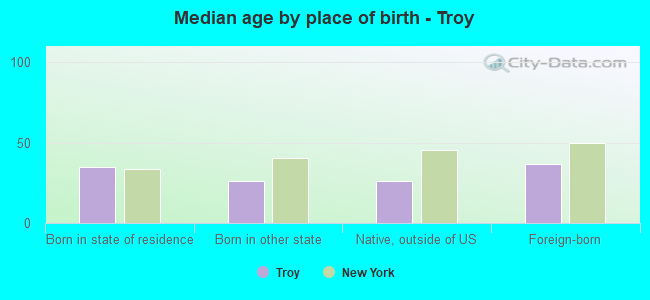
Median age by race in Troy
38.7 Median age for White residents37.7 39.5 28.9 Median age for Black or African American residents29.6 29.4 28.8 Median age for American Indian / Alaska Native residents24.2 -642,115,202.4 15.2 Median age for Asian residents18.6 22.8 -666,666,666.0 Median age for Native Hawaiian / Pacific Islander residents-666,666,666.0 -666,666,666.0 29.6 Median age for Other race residents29.8 29.7 21.7 Median age for Two or more races residents21.6 22.4 39.1 Median age for White alone residents38.3 40.0 25.4 Median age for Hispanic or Latino residents22.8 28.3
Owner/renter occupied households by race in Troy
House owners and renters - White residents 6,336 40.2% Owner occupied9,421 59.8% Renter occupiedHouse owners and renters - Black or African American residents 716 24.3% Owner occupied2,227 75.7% Renter occupiedHouse owners and renters - American Indian / Alaska Native residents 20 100.0% Renter occupiedHouse owners and renters - Asian residents 57 13.0% Owner occupied385 87.0% Renter occupiedHouse owners and renters - Other race residents 161 16.6% Owner occupied807 83.4% Renter occupiedHouse owners and renters - Two or more races residents 411 27.7% Owner occupied1,073 72.3% Renter occupiedHouse owners and renters - White alone residents 6,243 40.7% Owner occupied9,114 59.3% Renter occupiedHouse owners and renters - Hispanic or Latino residents 383 24.5% Owner occupied1,183 75.5% Renter occupied
Language usage in Troy
English speakers - Total 88.0% of residents of Troy speak English at home.
5.2% of residents speak Spanish at home 2,101 82.7% Speak English very well439 17.3% Speak English less than very well7.1% of residents speak other language at home 2,419 69.3% Speak English very well1,070 30.7% Speak English less than very well
English speakers - Born in the United States 93.9% of residents of Troy speak English at home.
0.9% of residents speak Spanish at home 94 97.9% Speak English very well2 2.1% Speak English less than very well5.6% of residents speak other language at home 568 100.0% Speak English very well
English speakers - Native, born elsewhere 24.7% of residents of Troy speak English at home.
53.0% of residents speak Spanish at home 262 59.3% Speak English very well180 40.7% Speak English less than very well12.2% of residents speak other language at home 66 64.7% Speak English very well36 35.3% Speak English less than very well
English speakers - Foreign-born 38.3% of residents of Troy speak English at home.
10.3% of residents speak Spanish at home 245 54.2% Speak English very well207 45.8% Speak English less than very well50.1% of residents speak other language at home 1,319 60.0% Speak English very well879 40.0% Speak English less than very well
White (Caucasian) - Speak only English Native:
96.6% (28,961)Foreign-born:
42.8% (664)
White (Caucasian) - Speak another language Native:
3.4% (1,016)Foreign-born:
54.4% (845)
Black or African American - Speak only English Native:
95.1% (6,242)Foreign-born:
55.6% (810)
Black or African American - Speak another language Native:
4.8% (316)Foreign-born:
46.8% (681)
Asian - Speak only English Native:
70.6% (963)Foreign-born:
22.6% (259)
Asian - Speak another language Native:
29.7% (405)Foreign-born:
76.4% (876)
Other race - Speak only English Native:
57.7% (777)Foreign-born:
17.8% (73)
Other race - Speak another language Native:
45.9% (618)Foreign-born:
82.3% (337)
Two or more races - Speak only English Native:
91.7% (4,986)Foreign-born:
53.8% (81)
Two or more races - Speak another language Native:
6.5% (355)Foreign-born:
43.7% (66)
White alone - Speak only English Native:
97.6% (28,404)Foreign-born:
42.4% (627)
White alone - Speak another language Native:
2.5% (714)Foreign-born:
55.3% (818)
Hispanic or Latino - Speak only English Native:
59.7% (2,440)Foreign-born:
12.4% (64)
Hispanic or Latino - Speak another language Native:
40.7% (1,664)Foreign-born:
86.5% (447)
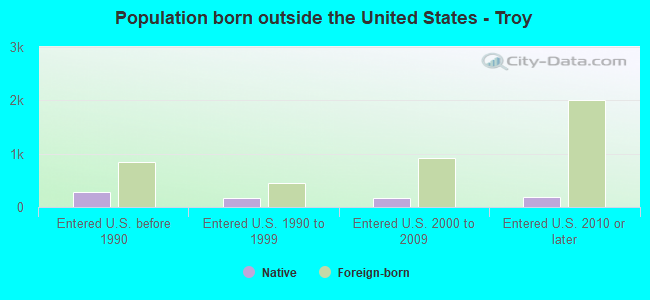
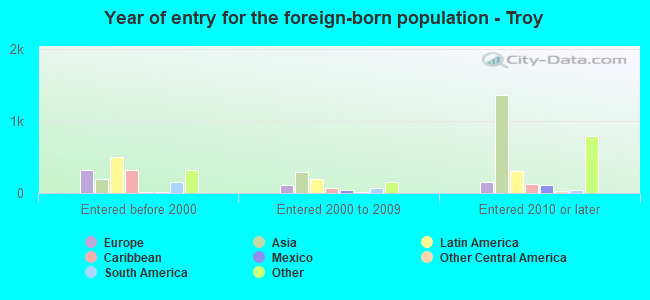
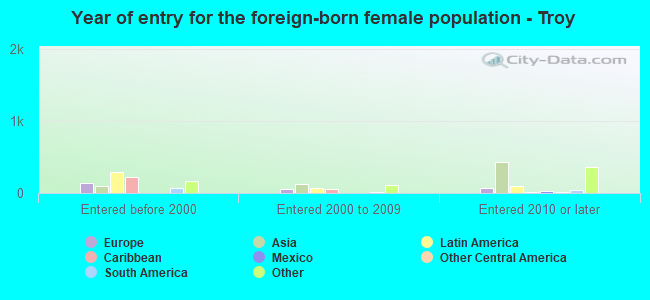
Foreign-born residents in Troy 4,452 residents are foreign born (3.5% Asia , 1.9% Latin America , 1.8% Africa , 1.2% Europe ).
This city:
8.7%New York:
22.6%
Marital status for residents in Troy Marital status - White (Caucasian) population 15 years and over
Males 56.8% Never married28.3% Now married1.7% Separated3.3% Widowed9.9% DivorcedFemales 50.6% Never married24.8% Now married3.1% Separated8.4% Widowed13.0% DivorcedWomen who gave birth in the past 12 months Now married:
41.2% (60)Unmarried:
58.8% (85)
Women who did not give birth in the past 12 months Now married:
19.1% (1,595)Unmarried:
80.9% (6,773)
Marital status - Black or African American population 15 years and over
Males 60.7% Never married25.2% Now married0.2% Separated1.9% Widowed11.9% DivorcedFemales 58.9% Never married20.2% Now married3.6% Separated5.2% Widowed12.0% DivorcedWomen who gave birth in the past 12 months Now married:
0.0% (0)Unmarried:
100.0% (99)
Women who did not give birth in the past 12 months Now married:
21.6% (503)Unmarried:
78.4% (1,825)
Marital status - American Indian / Alaska Native population 15 years and over
Males 42.1% Never married26.3% Now married31.6% Separated0.0% Widowed0.0% DivorcedFemales 42.9% Never married57.1% Now married0.0% Separated0.0% Widowed0.0% DivorcedWomen who did not give birth in the past 12 months Now married:
57.1% (17)Unmarried:
42.9% (13)
Marital status - Asian population 15 years and over
Males 81.6% Never married18.4% Now married0.0% Separated0.0% Widowed0.0% DivorcedFemales 63.8% Never married27.4% Now married0.0% Separated4.3% Widowed4.5% DivorcedWomen who gave birth in the past 12 months Now married:
100.0% (32)Unmarried:
0.0% (0)
Women who did not give birth in the past 12 months Now married:
26.1% (197)Unmarried:
73.9% (557)
Marital status - Other race population 15 years and over
Males 60.3% Never married29.8% Now married3.5% Separated3.4% Widowed3.0% DivorcedFemales 48.8% Never married36.4% Now married3.9% Separated0.0% Widowed11.0% DivorcedWomen who gave birth in the past 12 months Now married:
23.5% (4)Unmarried:
76.5% (14)
Women who did not give birth in the past 12 months Now married:
42.7% (215)Unmarried:
57.3% (289)
Marital status - Two or more races population 15 years and over
Males 67.2% Never married22.9% Now married0.0% Separated1.7% Widowed8.2% DivorcedFemales 74.6% Never married16.7% Now married3.7% Separated0.0% Widowed5.0% DivorcedWomen who gave birth in the past 12 months Now married:
0.0% (0)Unmarried:
100.0% (12)
Women who did not give birth in the past 12 months Now married:
16.9% (274)Unmarried:
83.1% (1,351)
Marital status - White alone, not Hispanic / Latino population 15 years and over
Males 56.6% Never married28.2% Now married1.7% Separated3.4% Widowed10.1% DivorcedFemales 50.3% Never married25.1% Now married3.1% Separated8.4% Widowed13.0% DivorcedWomen who gave birth in the past 12 months Now married:
43.4% (60)Unmarried:
56.6% (79)
Women who did not give birth in the past 12 months Now married:
19.4% (1,577)Unmarried:
80.6% (6,572)
Marital status - Hispanic or Latino population 15 years and over
Males 66.8% Never married25.5% Now married1.7% Separated1.9% Widowed4.1% DivorcedFemales 61.0% Never married20.4% Now married5.5% Separated2.2% Widowed11.0% DivorcedWomen who gave birth in the past 12 months Now married:
7.1% (4)Unmarried:
92.9% (51)
Women who did not give birth in the past 12 months Now married:
25.6% (358)Unmarried:
74.4% (1,040)
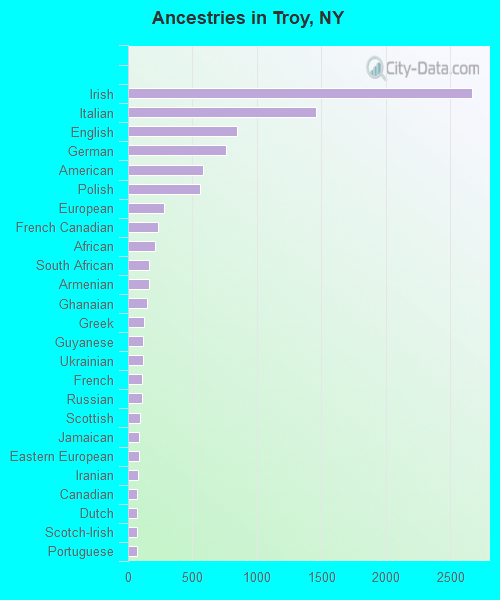
Ancestries in Troy
2,666 13.9% Irish1,460 7.6% Italian845 4.4% English761 4.0% German582 3.0% American556 2.9% Polish277 1.4% European236 1.2% French Canadian210 1.1% African162 0.8% South African160 0.8% Armenian149 0.8% Ghanaian125 0.6% Greek119 0.6% Guyanese118 0.6% Ukrainian111 0.6% French108 0.6% Russian91 0.5% Scottish88 0.5% Jamaican87 0.5% Eastern European80 0.4% Iranian73 0.4% Canadian71 0.4% Dutch67 0.3% Scotch-Irish66 0.3% Portuguese66 0.3% Northern European63 0.3% Haitian60 0.3% British51 0.3% British West Indian43 0.2% Nigerian42 0.2% Welsh42 0.2% Danish29 0.2% Trinidadian and Tobagonian28 0.1% Albanian28 0.1% German Russian24 0.1% Syrian22 0.1% Kenyan20 0.1% Egyptian18 0.09% Romanian17 0.09% Liberian16 0.08% Czech14 0.07% Barbadian13 0.07% Lebanese12 0.06% Swiss11 0.06% Austrian10 0.05% Somali9 0.05% Afghan9 0.05% Sudanese9 0.05% West Indian8 0.04% Latvian7 0.04% Australian6 0.03% Slovak5 0.03% Turkish5 0.03% Palestinian2 0.01% Scandinavian
Geographical mobility in Troy Same house 1 year ago 26,851 84.1% White (Caucasian)5,994 74.4% Black or African American51 95.7% American Indian / Alaska Native1,751 68.1% Asian1,625 88.1% Other race4,934 78.1% Two or more races26,043 84.2% White alone, not Hispanic / Latino4,270 87.9% Hispanic or LatinoMoved within same county 2,272 7.1% White / Caucasian896 11.1% Black or African American3 5.0% American Indian / Alaska Native219 8.5% Asian102 5.5% Other race752 11.9% Two or more races2,286 7.4% White alone, not Hispanic / Latino452 9.3% Hispanic or LatinoMoved within same state 1,480 4.6% White / Caucasian801 9.9% Black or African American306 11.9% Asian108 5.9% Other race540 8.5% Two or more races1,381 4.5% White alone, not Hispanic / Latino437 9.0% Hispanic or LatinoMoved from different state 711 2.2% White / Caucasian424 5.3% Black or African American158 6.1% Asian94 1.5% Two or more races674 2.2% White alone, not Hispanic / Latino89 1.8% Hispanic or LatinoMoved from abroad 20 0.1% White22 0.3% Black or African American179 7.0% Asian17 0.1% White alone, not Hispanic / Latino6 0.1% Hispanic or Latino
Children Nativity (place of birth) in Troy
Children under 6 years - Living with two parents Both parents native 317 100.0% NativeBoth parents foreign-born 282 78.1% Native79 21.9% Foreign-bornOne native, one foreign-born parent 185 100.0% NativeChildren under 6 years - Living with one parent Native parent 868 100.0% NativeForeign-born parent 53 100.0% NativeChildren 6 to 17 years - Living with two parents Both parents native 1,387 99.6% Native5 0.4% Foreign-bornBoth parents foreign-born 472 90.8% Native48 9.2% Foreign-bornOne native, one foreign-born parent 248 100.0% NativeChildren 6 to 17 years - Living with one parent Native parent 3,224 100.0% NativeForeign-born parent 160 61.3% Native101 38.7% Foreign-born
Grandparents responsible for own grandchildren in Troy
Grandparents (30 to 59 years) White / Caucasian 94 86.3% Responsible for grandchildren15 13.7% Not responsible for grandchildrenBlack or African American 68 100.0% Not responsible for grandchildrenAsian 8 100.0% Not responsible for grandchildrenOther race 17 67.1% Responsible for grandchildren8 32.9% Not responsible for grandchildrenTwo or more races 10 58.9% Responsible for grandchildren7 41.1% Not responsible for grandchildrenWhite alone, not Hispanic / Latino 95 84.4% Responsible for grandchildren18 15.6% Not responsible for grandchildrenHispanic or Latino 20 73.4% Responsible for grandchildren7 26.6% Not responsible for grandchildrenGrandparents (60 years and over) White / Caucasian 9 6.2% Responsible for grandchildren137 93.8% Not responsible for grandchildrenBlack or African American 6 28.5% Responsible for grandchildren15 71.5% Not responsible for grandchildrenAsian 22 100.0% Not responsible for grandchildrenOther race 37 88.3% Responsible for grandchildren5 11.7% Not responsible for grandchildrenTwo or more races 11 54.8% Responsible for grandchildren9 45.2% Not responsible for grandchildrenWhite alone, not Hispanic / Latino 10 6.2% Responsible for grandchildren147 93.8% Not responsible for grandchildrenHispanic or Latino 45 78.8% Responsible for grandchildren12 21.2% Not responsible for grandchildren