Races in Turley, Oklahoma (OK) Detailed Stats
Ancestries, Foreign-born residents, place of birth
Settings
X


Recent posts about races in Turley, Oklahoma on our local forum with over 2,400,000 registered users:
 | Can anyone help me find a house or apartment in this area? (1 reply) |
| What is TPS doing with empty elementary buildings? (4 replies) |
| Looking for Advice On a Place (2 replies) |
| Young family hoping to move to Tulsa soon (9 replies) |
| Looking for a new home....can you help? (20 replies) |
| Northside (27 replies) |
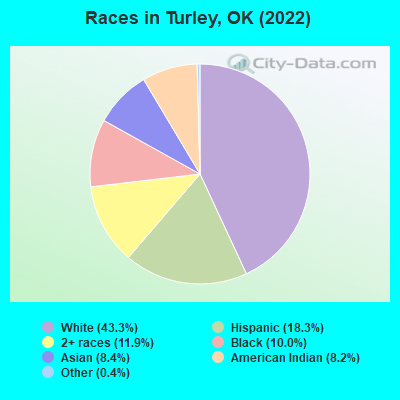
According to 2022 data, the most numerous races in Turley, OK are White alone (1,279 residents), Hispanic (539 residents), and Two or more races (351 residents). 77.9% of Turley residents speak English at home. 8.1% of Turley, OK residents are foreign-born (5.1% born in Latin America, 3.0% born in Asia), which is 25.5% greater than the foreign-born rate of 6.0% across the entire state of Oklahoma.
Race distribution in Turley
2000
2022

- 2,09664.9%White alone
- 46414.4%Black alone
- 35611.0%American Indian alone
- 1795.5%Two or more races
- 1233.8%Hispanic
- 100.3%Asian alone
- 20.06%Other race alone
- 10.03%Native Hawaiian and Other
Pacific Islander alone

-
- 1,27943.3%White alone
- 53918.3%Hispanic
- 35111.9%Two or more races
- 29610.0%Black alone
- 2488.4%Asian alone
- 2428.2%American Indian alone
- 110.4%Other race alone
2000
2022
-
- 2,556,36874.1%White alone
- 266,1587.7%American Indian alone
- 257,9817.5%Black alone
- 179,3045.2%Hispanic
- 140,2494.1%Two or more races
- 46,1721.3%Asian alone
- 2,3220.07%Other race alone
- 2,1000.06%Native Hawaiian and Other
Pacific Islander alone

-
- 2,517,40362.6%White alone
- 486,69212.1%Hispanic
- 364,4539.1%Two or more races
- 273,6506.8%American Indian alone
- 268,5436.7%Black alone
- 92,6722.3%Asian alone
- 10,7860.3%Other race alone
- 5,6010.1%Native Hawaiian and Other
Pacific Islander alone

Income and house value in Turley
- Median household income in 2022
- $38,400White non-Hispanic householders
- $55,886Black householders
- $49,398Some other race householders
- $51,105Two or more races householders
- $50,675Hispanic or Latino race householders
- Median 2022 house value
- $64,060White Non-Hispanic householders
- $89,454Black or African American householders
- $55,403American Indian or Alaska Native householders
- $37,320Two or more races householders
Household income for White non-Hispanic householders

Household income for Black householders

Household income for American Indian and Alaska Native householders

Household income for Asian householders

Household income for Some other race householders

Household income for Two or more races householders

Household income for Hispanic or Latino race householders

Median age by race in Turley
- 55.0Median age for White residents
- 53.2Males
- 55.3Females
- 40.0Median age for Black or African American residents
- 38.9Males
- 40.4Females
- 40.9Median age for American Indian / Alaska Native residents
- 33.5Males
- 41.5Females
- 26.6Median age for Asian residents
- 28.1Males
- 23.8Females
- -633,554,083.3Median age for Native Hawaiian / Pacific Islander residents
- -662,177,328.2Males
- -442,328,041.9Females
- 23.3Median age for Other race residents
- 23.9Males
- 22.1Females
- 27.4Median age for Two or more races residents
- 32.7Males
- 22.3Females
- 53.7Median age for White alone residents
- 52.2Males
- 54.2Females
- 23.3Median age for Hispanic or Latino residents
- 24.7Males
- 21.9Females
Owner/renter occupied households by race in Turley
- House owners and renters - White residents
- 46475.8%Owner occupied
- 14824.2%Renter occupied
- House owners and renters - Black or African American residents
- 5961.7%Owner occupied
- 3738.3%Renter occupied
- House owners and renters - American Indian / Alaska Native residents
- 6567.3%Owner occupied
- 3132.7%Renter occupied
- House owners and renters - Asian residents
- 2470.3%Owner occupied
- 1029.7%Renter occupied
- House owners and renters - Other race residents
- 11777.9%Owner occupied
- 3322.1%Renter occupied
- House owners and renters - Two or more races residents
- 8867.0%Owner occupied
- 4433.0%Renter occupied
- House owners and renters - White alone residents
- 47375.3%Owner occupied
- 15524.7%Renter occupied
- House owners and renters - Hispanic or Latino residents
- 10475.8%Owner occupied
- 3324.2%Renter occupied
Language usage in Turley
- English speakers - Total
- 77.9% of residents of Turley speak English at home.
- 16.0% of residents speak Spanish at home
- 26459.9%Speak English very well
- 17740.1%Speak English less than very well
- 5.9% of residents speak other language at home
- 10564.8%Speak English very well
- 5735.2%Speak English less than very well
- English speakers - Born in the United States
- 87.0% of residents of Turley speak English at home.
- 6.2% of residents speak Spanish at home
- 4989.1%Speak English very well
- 610.9%Speak English less than very well
- 6.3% of residents speak other language at home
- 4987.5%Speak English very well
- 712.5%Speak English less than very well
- English speakers - Native, born elsewhere
- 26.7% of residents of Turley speak English at home.
- 60.0% of residents speak Spanish at home
- 1055.6%Speak English very well
- 844.4%Speak English less than very well
- English speakers - Foreign-born
- 1.6% of residents of Turley speak English at home.
- 63.2% of residents speak Spanish at home
- 3723.4%Speak English very well
- 12176.6%Speak English less than very well
- 35.6% of residents speak other language at home
- 4348.3%Speak English very well
- 4651.7%Speak English less than very well
White (Caucasian) - Speak only English
| Native: | 100.0% (1,220) |
| Foreign-born: | 59.6% (4) |
White (Caucasian) - Speak another language
| Native: | 0.8% (10) |
| Foreign-born: | 53.3% (4) |
Asian - Speak another language
| Native: | 48.9% (63) |
| Foreign-born: | 98.5% (76) |
Other race - Speak another language
| Native: | 90.6% (276) |
| Foreign-born: | 100.0% (182) |
Two or more races - Speak another language
| Native: | 26.8% (115) |
| Foreign-born: | 100.0% (15) |
White alone - Speak only English
| Native: | 99.0% (1,236) |
| Foreign-born: | 42.9% (5) |
White alone - Speak another language
| Native: | 1.1% (14) |
| Foreign-born: | 55.6% (6) |
Hispanic or Latino - Speak another language
| Native: | 86.4% (273) |
| Foreign-born: | 100.0% (159) |
Foreign-born residents in Turley
238 residents are foreign born (5.1% Latin America, 3.0% Asia).
| This city: | 8.1% |
| Oklahoma: | 6.1% |


Marital status for residents in Turley
Marital status - White (Caucasian) population 15 years and over
- Males
- 35.1%Never married
- 35.3%Now married
- 4.5%Separated
- 6.6%Widowed
- 18.4%Divorced
- Females
- 21.6%Never married
- 31.6%Now married
- 21.6%Separated
- 11.7%Widowed
- 13.6%Divorced
Women who gave birth in the past 12 months
| Now married: | 100.0% (7) |
| Unmarried: | 0.0% (0) |
Women who did not give birth in the past 12 months
| Now married: | 41.5% (108) |
| Unmarried: | 58.5% (151) |
Marital status - Black or African American population 15 years and over
- Males
- 45.8%Never married
- 25.8%Now married
- 9.2%Separated
- 3.3%Widowed
- 15.8%Divorced
- Females
- 44.1%Never married
- 38.2%Now married
- 0.0%Separated
- 0.0%Widowed
- 17.6%Divorced
Women who gave birth in the past 12 months
| Now married: | 0.0% (0) |
| Unmarried: | 100.0% (5) |
Women who did not give birth in the past 12 months
| Now married: | 40.0% (25) |
| Unmarried: | 60.0% (38) |
Marital status - American Indian / Alaska Native population 15 years and over
- Males
- 63.6%Never married
- 27.3%Now married
- 0.0%Separated
- 3.4%Widowed
- 5.7%Divorced
- Females
- 39.3%Never married
- 44.1%Now married
- 10.3%Separated
- 0.0%Widowed
- 6.2%Divorced
Women who gave birth in the past 12 months
| Now married: | 64.3% (9) |
| Unmarried: | 35.7% (5) |
Women who did not give birth in the past 12 months
| Now married: | 40.2% (33) |
| Unmarried: | 59.8% (50) |
Marital status - Asian population 15 years and over
- Males
- 41.6%Never married
- 58.4%Now married
- 0.0%Separated
- 0.0%Widowed
- 0.0%Divorced
- Females
- 33.3%Never married
- 66.7%Now married
- 0.0%Separated
- 0.0%Widowed
- 0.0%Divorced
Women who gave birth in the past 12 months
| Now married: | 0.0% (0) |
| Unmarried: | 100.0% (14) |
Women who did not give birth in the past 12 months
| Now married: | 75.9% (44) |
| Unmarried: | 24.1% (14) |
Marital status - Other race population 15 years and over
- Males
- 41.7%Never married
- 44.8%Now married
- 0.0%Separated
- 5.5%Widowed
- 8.0%Divorced
- Females
- 27.2%Never married
- 57.9%Now married
- 10.5%Separated
- 0.0%Widowed
- 4.4%Divorced
Women who did not give birth in the past 12 months
| Now married: | 63.6% (82) |
| Unmarried: | 36.4% (47) |
Marital status - Two or more races population 15 years and over
- Males
- 43.4%Never married
- 35.3%Now married
- 2.9%Separated
- 0.0%Widowed
- 18.5%Divorced
- Females
- 19.3%Never married
- 27.3%Now married
- 13.6%Separated
- 10.2%Widowed
- 29.5%Divorced
Women who did not give birth in the past 12 months
| Now married: | 48.1% (32) |
| Unmarried: | 51.9% (35) |
Marital status - White alone, not Hispanic / Latino population 15 years and over
- Males
- 35.1%Never married
- 35.3%Now married
- 4.5%Separated
- 6.6%Widowed
- 18.4%Divorced
- Females
- 21.6%Never married
- 31.6%Now married
- 21.6%Separated
- 11.7%Widowed
- 13.6%Divorced
Women who gave birth in the past 12 months
| Now married: | 100.0% (7) |
| Unmarried: | 0.0% (0) |
Women who did not give birth in the past 12 months
| Now married: | 41.5% (113) |
| Unmarried: | 58.5% (159) |
Marital status - Hispanic or Latino population 15 years and over
- Males
- 43.1%Never married
- 41.5%Now married
- 0.0%Separated
- 4.6%Widowed
- 10.8%Divorced
- Females
- 27.6%Never married
- 50.7%Now married
- 13.4%Separated
- 0.0%Widowed
- 8.2%Divorced
Women who did not give birth in the past 12 months
| Now married: | 59.0% (74) |
| Unmarried: | 41.0% (51) |
Ancestries in Turley

- 17211.8%American
- 805.5%Irish
- 473.2%German
- 372.5%English
- 261.8%Dutch West Indian
- 201.4%French Canadian
- 70.5%African
- 70.5%Turkish
- 60.4%Scottish
- 40.3%Hungarian
- 30.2%Canadian

Geographical mobility in Turley

- Same house 1 year ago
- 1,07087.3%White (Caucasian)
- 25686.2%Black or African American
- 16764.8%American Indian / Alaska Native
- 23397.7%Asian
- 48189.5%Other race
- 45188.6%Two or more races
- 1,11386.9%White alone, not Hispanic / Latino
- 49492.6%Hispanic or Latino

-
- Moved within same county
- 695.6%White / Caucasian
- 299.9%Black or African American
- 197.5%American Indian / Alaska Native
- 366.8%Other race
- 326.2%Two or more races
- 735.7%White alone, not Hispanic / Latino
- 356.6%Hispanic or Latino

-
- Moved within same state
- 776.3%White / Caucasian
- 103.4%Black or African American
- 5621.7%American Indian / Alaska Native
- 72.9%Asian
- 224.3%Two or more races
- 816.4%White alone, not Hispanic / Latino
- 30.7%Hispanic or Latino

-
- Moved from different state
- 191.5%White / Caucasian
- 41.2%Black or African American
- 2710.3%American Indian / Alaska Native
- 201.6%White alone, not Hispanic / Latino

-
- Moved from abroad
- 101.8%Other race
- 51.0%Hispanic or Latino

Children Nativity (place of birth) in Turley
Place of birth for residents in Turley
![Place of birth for the foreign-born population - Regions]()
- 152Americas
- 148Latin America
- 148Central America
- 86Asia
- 79South Eastern Asia
- 6Western Asia
- 3Northern America

![Place of birth for the foreign-born population - Countries]()
- 148Mexico
- 46Thailand
- 24Laos
- 7Philippines
- 6Turkey
- 3Canada

Grandparents responsible for own grandchildren in Turley
Zip codes: 74126.