Races in Twin Cities, Oklahoma (OK) Detailed Stats
Ancestries, Foreign-born residents, place of birth
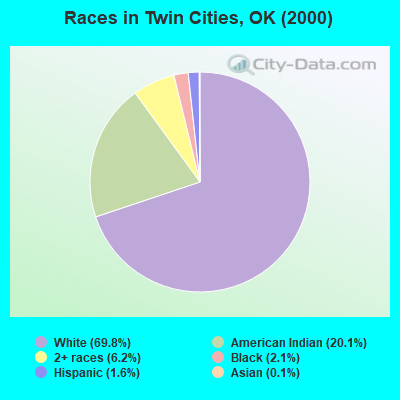
Race distribution in Twin Cities

- 3,53369.8%White alone
- 1,01520.1%American Indian alone
- 3136.2%Two or more races
- 1062.1%Black alone
- 831.6%Hispanic
- 60.1%Asian alone
- 30.06%Native Hawaiian and Other
Pacific Islander alone - 20.04%Other race alone
2000
2022
-
- 2,556,36874.1%White alone
- 266,1587.7%American Indian alone
- 257,9817.5%Black alone
- 179,3045.2%Hispanic
- 140,2494.1%Two or more races
- 46,1721.3%Asian alone
- 2,3220.07%Other race alone
- 2,1000.06%Native Hawaiian and Other
Pacific Islander alone

-
- 2,517,40362.6%White alone
- 486,69212.1%Hispanic
- 364,4539.1%Two or more races
- 273,6506.8%American Indian alone
- 268,5436.7%Black alone
- 92,6722.3%Asian alone
- 10,7860.3%Other race alone
- 5,6010.1%Native Hawaiian and Other
Pacific Islander alone

Income and house value in Twin Cities
- Median household income in 2022
- $50,018White non-Hispanic householders
- $18,174Black householders
- $49,369American Indian and Alaska Native householders
- $28,149Asian householders
- $38,559Two or more races householders
- $15,680Hispanic or Latino race householders
- Median 2022 house value
- $132,485White Non-Hispanic householders
- $117,336Black or African American householders
- $133,673American Indian or Alaska Native householders
- $66,836Asian householders
- $193,084Two or more races householders
Household income for White non-Hispanic householders

Household income for Black householders

Household income for American Indian and Alaska Native householders

Household income for Asian householders

Household income for Two or more races householders

Household income for Hispanic or Latino race householders

Zip code: 74546