Races in Union Gap, Washington (WA) Detailed Stats
Data:
Races - White alone (%)
Races - White alone (% change since 2000)
Races - Black alone (%)
Races - Black alone (% change since 2000)
Races - American Indian alone (%)
Races - American Indian alone (% change since 2000)
Races - Asian alone (%)
Races - Asian alone (% change since 2000)
Races - Hispanic (%)
Races - Hispanic (% change since 2000)
Races - Native Hawaiian and Other Pacific Islander alone (%)
Races - Native Hawaiian and Other Pacific Islander alone (% change since 2000)
Races - Two or more races(%)
Races - Two or more races(% change since 2000)
Races - Other race alone (%)
Races - Other race alone (% change since 2000)
Racial diversity
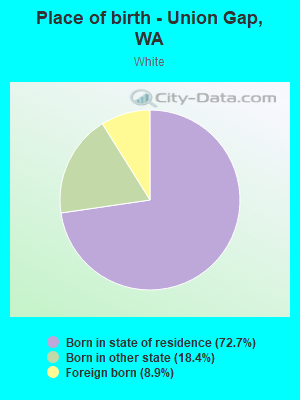
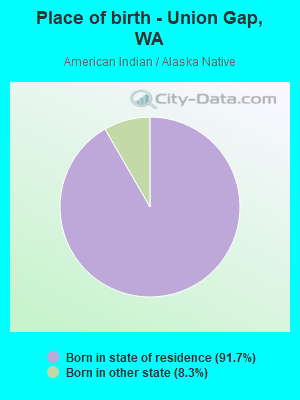
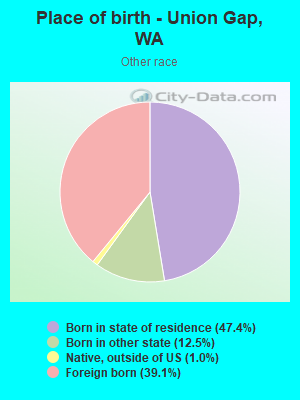
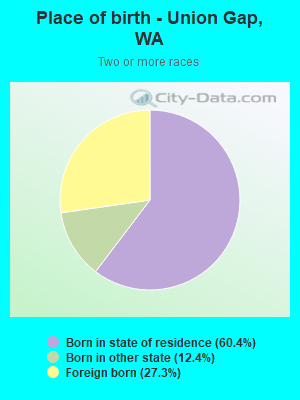
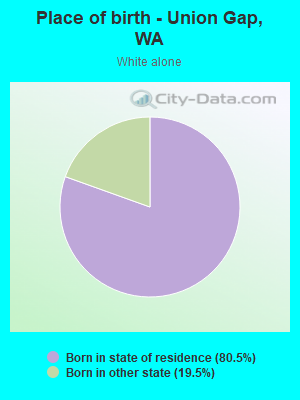
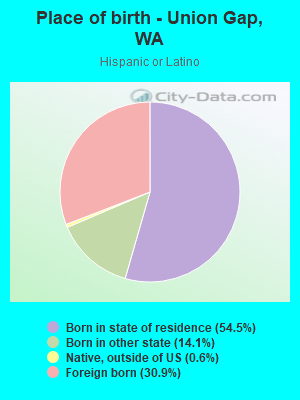
Place of birth - Born in state of residence (%)
Place of birth - Born in state of residence (%) - White
Place of birth - Born in state of residence (%) - Black or African American
Place of birth - Born in state of residence (%) - Asian
Place of birth - Born in state of residence (%) - Hispanic or Latino
Place of birth - Born in state of residence (%) - American Indian and Alaska Native
Place of birth - Born in state of residence (%) - Multirace
Place of birth - Born in state of residence (%) - Other Race
Place of birth - Born in other state (%)
Place of birth - Born in other state (%) - White
Place of birth - Born in other state (%) - Black or African American
Place of birth - Born in other state (%) - Asian
Place of birth - Born in other state (%) - Hispanic or Latino
Place of birth - Born in other state (%) - American Indian and Alaska Native
Place of birth - Born in other state (%) - Multirace
Place of birth - Born in other state (%) - Other Race
Place of birth - Native, outside of US (%)
Place of birth - Native, outside of US (%) - White
Place of birth - Native, outside of US (%) - Black or African American
Place of birth - Native, outside of US (%) - Asian
Place of birth - Native, outside of US (%) - Hispanic or Latino
Place of birth - Native, outside of US (%) - American Indian and Alaska Native
Place of birth - Native, outside of US (%) - Multirace
Place of birth - Native, outside of US (%) - Other Race
Place of birth - Foreign born (%)
Place of birth - Foreign born (%) - White
Place of birth - Foreign born (%) - Black or African American
Place of birth - Foreign born (%) - Asian
Place of birth - Foreign born (%) - Hispanic or Latino
Place of birth - Foreign born (%) - American Indian and Alaska Native
Place of birth - Foreign born (%) - Multirace
Place of birth - Foreign born (%) - Other Race
Residents speaking English at home (%)
Residents speaking English at home - Born in the United States (%)
Residents speaking English at home - Native, born elsewhere (%)
Residents speaking English at home - Foreign born (%)
Residents speaking Spanish at home (%)
Residents speaking Spanish at home - Born in the United States (%)
Residents speaking Spanish at home - Native, born elsewhere (%)
Residents speaking Spanish at home - Foreign born (%)
Residents speaking other language at home (%)
Residents speaking other language at home - Born in the United States (%)
Residents speaking other language at home - Native, born elsewhere (%)
Residents speaking other language at home - Foreign born (%)
Marital status - Never married (%)
Marital status - Now married (%)
Marital status - Separated (%)
Marital status - Widowed (%)
Marital status - Divorced (%)
Ancestries Reported - Arab (%)
Ancestries Reported - Czech (%)
Ancestries Reported - Danish (%)
Ancestries Reported - Dutch (%)
Ancestries Reported - English (%)
Ancestries Reported - French (%)
Ancestries Reported - French Canadian (%)
Ancestries Reported - German (%)
Ancestries Reported - Greek (%)
Ancestries Reported - Hungarian (%)
Ancestries Reported - Irish (%)
Ancestries Reported - Italian (%)
Ancestries Reported - Lithuanian (%)
Ancestries Reported - Norwegian (%)
Ancestries Reported - Polish (%)
Ancestries Reported - Portuguese (%)
Ancestries Reported - Russian (%)
Ancestries Reported - Scotch-Irish (%)
Ancestries Reported - Scottish (%)
Ancestries Reported - Slovak (%)
Ancestries Reported - Subsaharan African (%)
Ancestries Reported - Swedish (%)
Ancestries Reported - Swiss (%)
Ancestries Reported - Ukrainian (%)
Ancestries Reported - United States (%)
Ancestries Reported - Welsh (%)
Ancestries Reported - West Indian (%)
Ancestries Reported - Other (%)
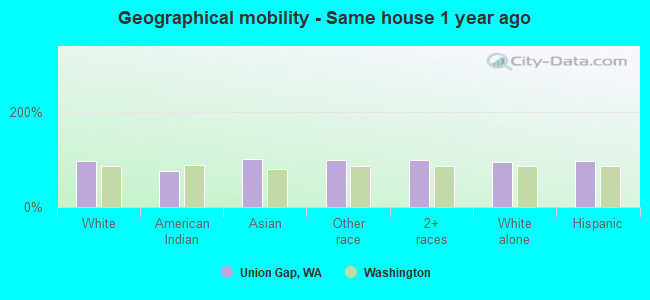
Geographical mobility - Same house 1 year ago (%)
Geographical mobility - Same house 1 year ago (%) - White
Geographical mobility - Same house 1 year ago (%) - Black or African American
Geographical mobility - Same house 1 year ago (%) - Asian
Geographical mobility - Same house 1 year ago (%) - Hispanic or Latino
Geographical mobility - Same house 1 year ago (%) - American Indian and Alaska Native
Geographical mobility - Same house 1 year ago (%) - Multirace
Geographical mobility - Same house 1 year ago (%) - Other Race
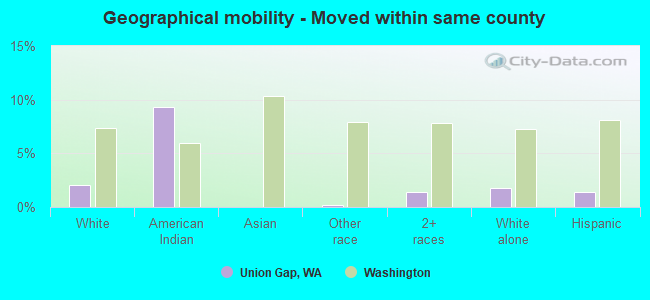
Geographical mobility - Moved within same county (%)
Geographical mobility - Moved within same county (%) - White
Geographical mobility - Moved within same county (%) - Black or African American
Geographical mobility - Moved within same county (%) - Asian
Geographical mobility - Moved within same county (%) - Hispanic or Latino
Geographical mobility - Moved within same county (%) - American Indian and Alaska Native
Geographical mobility - Moved within same county (%) - Multirace
Geographical mobility - Moved within same county (%) - Other Race
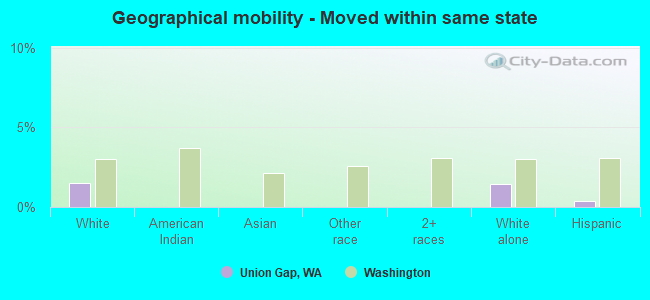
Geographical mobility - Moved from different county within same state (%)
Geographical mobility - Moved from different county within same state (%) - White
Geographical mobility - Moved from different county within same state (%) - Black or African American
Geographical mobility - Moved from different county within same state (%) - Asian
Geographical mobility - Moved from different county within same state (%) - Hispanic or Latino
Geographical mobility - Moved from different county within same state (%) - American Indian and Alaska Native
Geographical mobility - Moved from different county within same state (%) - Multirace
Geographical mobility - Moved from different county within same state (%) - Other Race
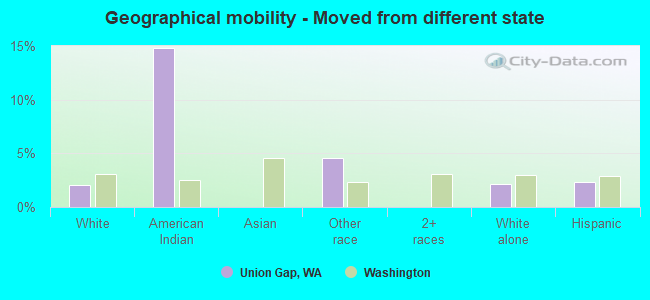
Geographical mobility - Moved from different state (%)
Geographical mobility - Moved from different state (%) - White
Geographical mobility - Moved from different state (%) - Black or African American
Geographical mobility - Moved from different state (%) - Asian
Geographical mobility - Moved from different state (%) - Hispanic or Latino
Geographical mobility - Moved from different state (%) - American Indian and Alaska Native
Geographical mobility - Moved from different state (%) - Multirace
Geographical mobility - Moved from different state (%) - Other Race
Geographical mobility - Moved from abroad (%)
Geographical mobility - Moved from abroad (%) - White
Geographical mobility - Moved from abroad (%) - Black or African American
Geographical mobility - Moved from abroad (%) - Asian
Geographical mobility - Moved from abroad (%) - Hispanic or Latino
Geographical mobility - Moved from abroad (%) - American Indian and Alaska Native
Geographical mobility - Moved from abroad (%) - Multirace
Geographical mobility - Moved from abroad (%) - Other Race
Place of birth for the foreign-born population - Ireland (%)
Place of birth for the foreign-born population - Denmark (%)
Place of birth for the foreign-born population - Norway (%)
Place of birth for the foreign-born population - Sweden (%)
Place of birth for the foreign-born population - United Kingdom (%)
Place of birth for the foreign-born population - England (%)
Place of birth for the foreign-born population - Scotland (%)
Place of birth for the foreign-born population - Other Northern Europe (%)
Place of birth for the foreign-born population - Austria (%)
Place of birth for the foreign-born population - Belgium (%)
Place of birth for the foreign-born population - France (%)
Place of birth for the foreign-born population - Germany (%)
Place of birth for the foreign-born population - Netherlands (%)
Place of birth for the foreign-born population - Switzerland (%)
Place of birth for the foreign-born population - Other Western Europe (%)
Place of birth for the foreign-born population - Greece (%)
Place of birth for the foreign-born population - Italy (%)
Place of birth for the foreign-born population - Portugal (%)
Place of birth for the foreign-born population - Spain (%)
Place of birth for the foreign-born population - Other Southern Europe (%)
Place of birth for the foreign-born population - Albania (%)
Place of birth for the foreign-born population - Belarus (%)
Place of birth for the foreign-born population - Bosnia and Herzegovina (%)
Place of birth for the foreign-born population - Bulgaria (%)
Place of birth for the foreign-born population - Croatia (%)
Place of birth for the foreign-born population - Czechoslovakia (%)
Place of birth for the foreign-born population - Hungary (%)
Place of birth for the foreign-born population - Latvia (%)
Place of birth for the foreign-born population - Lithuania (%)
Place of birth for the foreign-born population - North Macedonia (Macedonia) (%)
Place of birth for the foreign-born population - Moldova (%)
Place of birth for the foreign-born population - Poland (%)
Place of birth for the foreign-born population - Romania (%)
Place of birth for the foreign-born population - Russia (%)
Place of birth for the foreign-born population - Serbia (%)
Place of birth for the foreign-born population - Ukraine (%)
Place of birth for the foreign-born population - Other Eastern Europe (%)
Place of birth for the foreign-born population - China (%)
Place of birth for the foreign-born population - Hong Kong (%)
Place of birth for the foreign-born population - Taiwan (%)
Place of birth for the foreign-born population - Japan (%)
Place of birth for the foreign-born population - Korea (%)
Place of birth for the foreign-born population - Other Eastern Asia (%)
Place of birth for the foreign-born population - Afghanistan (%)
Place of birth for the foreign-born population - Bangladesh (%)
Place of birth for the foreign-born population - India (%)
Place of birth for the foreign-born population - Iran (%)
Place of birth for the foreign-born population - Kazakhstan (%)
Place of birth for the foreign-born population - Nepal (%)
Place of birth for the foreign-born population - Pakistan (%)
Place of birth for the foreign-born population - Sri Lanka (%)
Place of birth for the foreign-born population - Uzbekistan (%)
Place of birth for the foreign-born population - Other South Central Asia (%)
Place of birth for the foreign-born population - Burma (%)
Place of birth for the foreign-born population - Cambodia (%)
Place of birth for the foreign-born population - Indonesia (%)
Place of birth for the foreign-born population - Laos (%)
Place of birth for the foreign-born population - Malaysia (%)
Place of birth for the foreign-born population - Philippines (%)
Place of birth for the foreign-born population - Singapore (%)
Place of birth for the foreign-born population - Thailand (%)
Place of birth for the foreign-born population - Vietnam (%)
Place of birth for the foreign-born population - Other South Eastern Asia (%)
Place of birth for the foreign-born population - Armenia (%)
Place of birth for the foreign-born population - Iraq (%)
Place of birth for the foreign-born population - Israel (%)
Place of birth for the foreign-born population - Jordan (%)
Place of birth for the foreign-born population - Kuwait (%)
Place of birth for the foreign-born population - Lebanon (%)
Place of birth for the foreign-born population - Saudi Arabia (%)
Place of birth for the foreign-born population - Syria (%)
Place of birth for the foreign-born population - Turkey (%)
Place of birth for the foreign-born population - Yemen (%)
Place of birth for the foreign-born population - Other Western Asia (%)
Place of birth for the foreign-born population - Eritrea (%)
Place of birth for the foreign-born population - Ethiopia (%)
Place of birth for the foreign-born population - Kenya (%)
Place of birth for the foreign-born population - Somalia (%)
Place of birth for the foreign-born population - Uganda (%)
Place of birth for the foreign-born population - Zimbabwe (%)
Place of birth for the foreign-born population - Other Eastern Africa (%)
Place of birth for the foreign-born population - Cameroon (%)
Place of birth for the foreign-born population - Congo (%)
Place of birth for the foreign-born population - Democratic Republic of Congo (Zaire) (%)
Place of birth for the foreign-born population - Other Middle Africa (%)
Place of birth for the foreign-born population - Egypt (%)
Place of birth for the foreign-born population - Morocco (%)
Place of birth for the foreign-born population - Sudan (%)
Place of birth for the foreign-born population - Other Northern Africa (%)
Place of birth for the foreign-born population - South Africa (%)
Place of birth for the foreign-born population - Other Southern Africa (%)
Place of birth for the foreign-born population - Cabo Verde (%)
Place of birth for the foreign-born population - Ghana (%)
Place of birth for the foreign-born population - Liberia (%)
Place of birth for the foreign-born population - Nigeria (%)
Place of birth for the foreign-born population - Senegal (%)
Place of birth for the foreign-born population - Sierra Leone (%)
Place of birth for the foreign-born population - Other Western Africa (%)
Place of birth for the foreign-born population - Australia (%)
Place of birth for the foreign-born population - New Zealand (%)
Place of birth for the foreign-born population - Fiji (%)
Place of birth for the foreign-born population - Micronesia (%)
Place of birth for the foreign-born population - Bahamas (%)
Place of birth for the foreign-born population - Barbados (%)
Place of birth for the foreign-born population - Cuba (%)
Place of birth for the foreign-born population - Dominica (%)
Place of birth for the foreign-born population - Dominican Republic (%)
Place of birth for the foreign-born population - Grenada (%)
Place of birth for the foreign-born population - Haiti (%)
Place of birth for the foreign-born population - Jamaica (%)
Place of birth for the foreign-born population - St. Vincent and the Grenadines (%)
Place of birth for the foreign-born population - Trinidad and Tobago (%)
Place of birth for the foreign-born population - West Indies (%)
Place of birth for the foreign-born population - Other Caribbean (%)
Place of birth for the foreign-born population - Belize (%)
Place of birth for the foreign-born population - Costa Rica (%)
Place of birth for the foreign-born population - El Salvador (%)
Place of birth for the foreign-born population - Guatemala (%)
Place of birth for the foreign-born population - Honduras (%)
Place of birth for the foreign-born population - Mexico (%)
Place of birth for the foreign-born population - Nicaragua (%)
Place of birth for the foreign-born population - Panama (%)
Place of birth for the foreign-born population - Other Central America (%)
Place of birth for the foreign-born population - Argentina (%)
Place of birth for the foreign-born population - Bolivia (%)
Place of birth for the foreign-born population - Brazil (%)
Place of birth for the foreign-born population - Chile (%)
Place of birth for the foreign-born population - Colombia (%)
Place of birth for the foreign-born population - Ecuador (%)
Place of birth for the foreign-born population - Guyana (%)
Place of birth for the foreign-born population - Peru (%)
Place of birth for the foreign-born population - Uruguay (%)
Place of birth for the foreign-born population - Venezuela (%)
Place of birth for the foreign-born population - Other South America (%)
Place of birth for the foreign-born population - Canada (%)
Place of birth for the foreign-born population - Other Northern America (%)
Place of birth for the foreign-born population - Other (%)
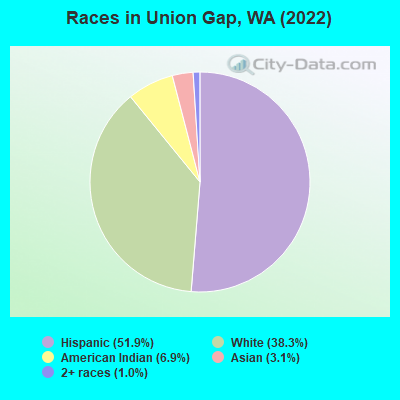
According to 2022 data, the most numerous races in Union Gap, WA are White alone (2,499 residents), Hispanic (3,393 residents), and Asian alone (203 residents). 54.9% of Union Gap residents speak English at home. 19.6% of Union Gap, WA residents are foreign-born (15.8% born in Latin America, 3.0% born in Asia), which is 23.4% greater than the foreign-born rate of 15.0% across the entire state of Washington.
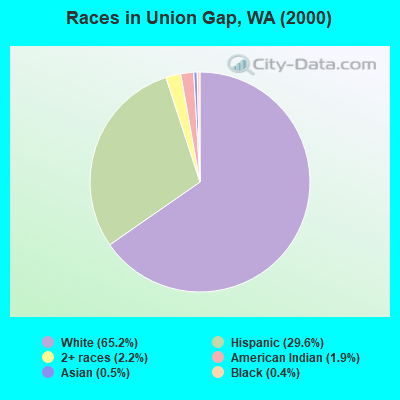
Race distribution in Union Gap
2000 2022
4,652,490 78.9% White alone 441,509 7.5% Hispanic 319,401 5.4% Asian alone 184,631 3.1% Black alone 175,926 3.0% Two or more races 85,396 1.4% American Indian alone 22,779 0.4% Native Hawaiian and Other 11,989 0.2% Other race alone
4,941,456 63.5% White alone 1,093,313 14.0% Hispanic 755,832 9.7% Asian alone 523,448 6.7% Two or more races 299,537 3.8% Black alone 69,024 0.9% American Indian alone 52,231 0.7% Native Hawaiian and Other 50,945 0.7% Other race alone
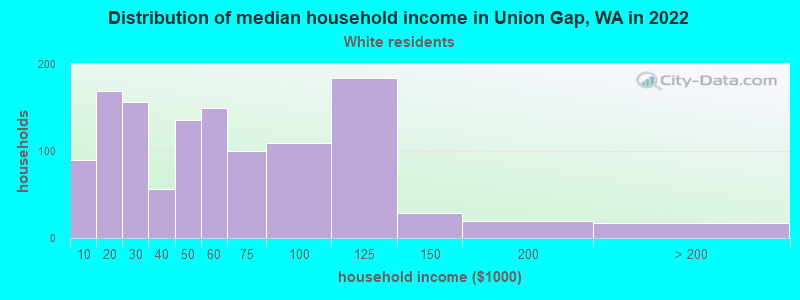
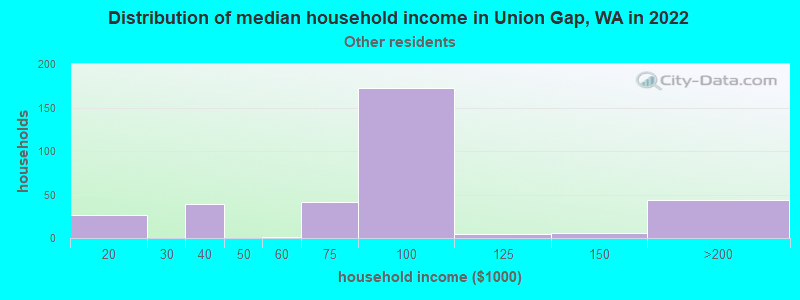
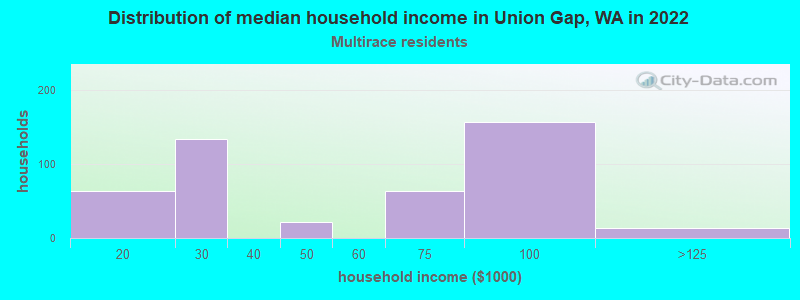
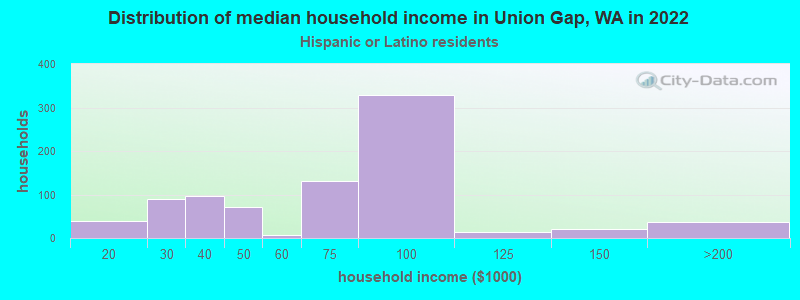
Income and house value in Union Gap Median household income in 2022 $49,501 White non-Hispanic householders$67,725 Some other race householders$71,537 Hispanic or Latino race householdersMedian 2022 house value $217,929 White Non-Hispanic householders$187,581 American Indian or Alaska Native householders $222,377 Asian householders$210,080 Some other race householders$174,500 Two or more races householders$217,667 Hispanic or Latino householders
Median age by race in Union Gap
46.6 Median age for White residents49.5 44.7 -694,779,115.8 Median age for Black or African American residents-684,418,145.3 -711,934,155.7 16.6 Median age for American Indian / Alaska Native residents27.9 16.5 28.6 Median age for Asian residents23.9 48.4 -681,388,011.9 Median age for Native Hawaiian / Pacific Islander residents-696,774,192.9 -666,666,666.0 25.5 Median age for Other race residents36.8 19.2 24.1 Median age for Two or more races residents24.3 20.7 49.9 Median age for White alone residents55.5 46.1 20.9 Median age for Hispanic or Latino residents25.1 18.8
Owner/renter occupied households by race in Union Gap
House owners and renters - White residents 976 79.4% Owner occupied253 20.6% Renter occupiedHouse owners and renters - American Indian / Alaska Native residents 43 100.0% Renter occupiedHouse owners and renters - Asian residents 13 35.7% Owner occupied22 64.3% Renter occupiedHouse owners and renters - Other race residents 260 75.9% Owner occupied82 24.1% Renter occupiedHouse owners and renters - Two or more races residents 196 40.1% Owner occupied292 59.9% Renter occupiedHouse owners and renters - White alone residents 860 76.3% Owner occupied267 23.7% Renter occupiedHouse owners and renters - Hispanic or Latino residents 565 67.3% Owner occupied274 32.7% Renter occupied
Language usage in Union Gap
English speakers - Total 54.9% of residents of Union Gap speak English at home.
40.2% of residents speak Spanish at home 1,639 68.0% Speak English very well771 32.0% Speak English less than very well3.9% of residents speak other language at home 143 61.1% Speak English very well91 38.9% Speak English less than very well
English speakers - Born in the United States 48.9% of residents of Union Gap speak English at home.
58.0% of residents speak Spanish at home 529 94.0% Speak English very well34 6.0% Speak English less than very well0.1% of residents speak other language at home 1 100.0% Speak English very well
English speakers - Native, born elsewhere 0.0% of residents of Union Gap speak English at home.
92.9% of residents speak Spanish at home 13 100.0% Speak English very well
English speakers - Foreign-born 11.9% of residents of Union Gap speak English at home.
71.4% of residents speak Spanish at home 276 31.2% Speak English very well609 68.8% Speak English less than very well14.7% of residents speak other language at home 114 62.6% Speak English very well68 37.4% Speak English less than very well
White (Caucasian) - Speak another language Native:
8.8% (232)Foreign-born:
95.9% (262)
Other race - Speak only English Native:
20.3% (158)Foreign-born:
17.7% (98)
Other race - Speak another language Native:
80.4% (625)Foreign-born:
83.8% (463)
Two or more races - Speak only English Native:
21.4% (190)Foreign-born:
24.6% (105)
Two or more races - Speak another language Native:
85.8% (761)Foreign-born:
78.8% (335)
Hispanic or Latino - Speak only English Native:
25.2% (495)Foreign-born:
17.3% (180)
Hispanic or Latino - Speak another language Native:
75.0% (1,472)Foreign-born:
86.7% (906)
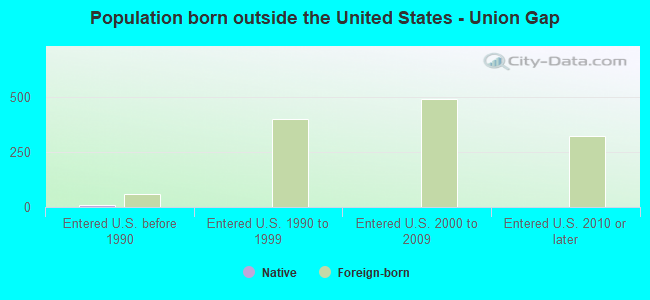
Foreign-born residents in Union Gap 1,280 residents are foreign born (15.8% Latin America , 3.0% Asia ).
This city:
19.6%Washington:
14.9%
Marital status for residents in Union Gap Marital status - White (Caucasian) population 15 years and over
Males 36.5% Never married46.1% Now married1.6% Separated5.3% Widowed10.5% DivorcedFemales 37.0% Never married43.1% Now married4.2% Separated8.1% Widowed7.7% DivorcedWomen who gave birth in the past 12 months Now married:
7.4% (3)Unmarried:
92.6% (38)
Women who did not give birth in the past 12 months Now married:
45.0% (312)Unmarried:
55.0% (382)
Marital status - American Indian / Alaska Native population 15 years and over
Males 93.9% Never married6.1% Now married0.0% Separated0.0% Widowed0.0% DivorcedFemales 80.2% Never married0.0% Now married0.0% Separated4.2% Widowed15.6% DivorcedWomen who gave birth in the past 12 months Now married:
0.0% (0)Unmarried:
100.0% (32)
Women who did not give birth in the past 12 months Now married:
0.0% (0)Unmarried:
100.0% (115)
Marital status - Asian population 15 years and over
Males 56.3% Never married43.7% Now married0.0% Separated0.0% Widowed0.0% DivorcedFemales 37.4% Never married52.7% Now married0.0% Separated0.0% Widowed9.9% DivorcedWomen who did not give birth in the past 12 months Now married:
52.7% (52)Unmarried:
47.3% (47)
Marital status - Other race population 15 years and over
Males 49.1% Never married40.5% Now married7.6% Separated0.9% Widowed1.9% DivorcedFemales 41.4% Never married43.0% Now married5.5% Separated0.0% Widowed10.2% DivorcedWomen who gave birth in the past 12 months Now married:
95.2% (22)Unmarried:
4.8% (1)
Women who did not give birth in the past 12 months Now married:
47.4% (169)Unmarried:
52.6% (187)
Marital status - Two or more races population 15 years and over
Males 63.7% Never married30.5% Now married0.0% Separated0.0% Widowed5.7% DivorcedFemales 64.5% Never married31.8% Now married0.0% Separated3.7% Widowed0.0% DivorcedWomen who gave birth in the past 12 months Now married:
2.2% (3)Unmarried:
97.8% (142)
Women who did not give birth in the past 12 months Now married:
14.0% (35)Unmarried:
86.0% (213)
Marital status - White alone, not Hispanic / Latino population 15 years and over
Males 34.8% Never married44.0% Now married1.8% Separated7.0% Widowed12.4% DivorcedFemales 33.8% Never married42.6% Now married5.2% Separated10.2% Widowed8.2% DivorcedWomen who gave birth in the past 12 months Now married:
7.4% (4)Unmarried:
92.6% (49)
Women who did not give birth in the past 12 months Now married:
47.0% (285)Unmarried:
53.0% (322)
Marital status - Hispanic or Latino population 15 years and over
Males 50.3% Never married41.5% Now married4.1% Separated0.5% Widowed3.6% DivorcedFemales 52.9% Never married39.2% Now married2.0% Separated0.2% Widowed5.6% DivorcedWomen who gave birth in the past 12 months Now married:
18.0% (21)Unmarried:
82.0% (94)
Women who did not give birth in the past 12 months Now married:
38.1% (302)Unmarried:
61.9% (491)
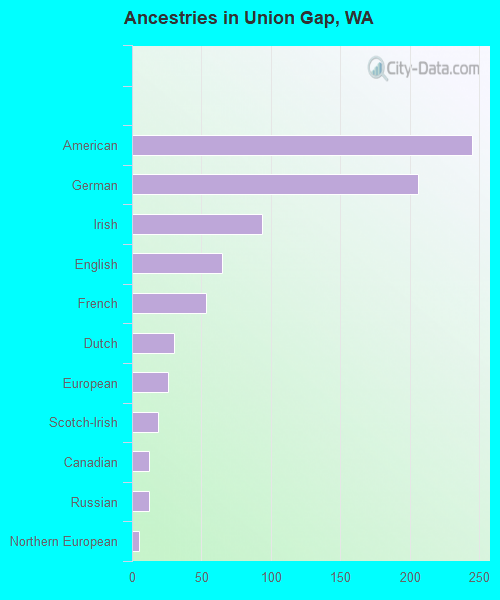
Ancestries in Union Gap
245 5.6% American206 4.7% German94 2.1% Irish65 1.5% English53 1.2% French30 0.7% Dutch26 0.6% European19 0.4% Scotch-Irish12 0.3% Canadian12 0.3% Russian5 0.1% Northern European1 0.02% Scandinavian1 0.02% Scottish
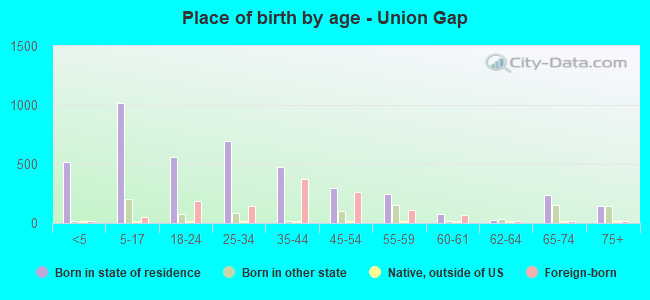
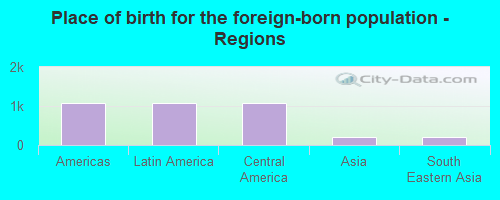
Children Nativity (place of birth) in Union Gap
Children under 6 years - Living with two parents Both parents foreign-born 71 100.0% NativeOne native, one foreign-born parent 111 100.0% NativeChildren under 6 years - Living with one parent Native parent 367 100.0% NativeForeign-born parent 118 100.0% NativeChildren 6 to 17 years - Living with two parents Both parents native 143 100.0% NativeBoth parents foreign-born 326 100.0% NativeOne native, one foreign-born parent 249 83.0% Native51 17.0% Foreign-bornChildren 6 to 17 years - Living with one parent Native parent 289 100.0% NativeForeign-born parent 47 68.9% Native21 31.1% Foreign-born
Place of birth for residents in Union Gap 1,067 Americas1,067 Latin America1,067 Central America203 Asia203 South Eastern Asia9 Oceania
Grandparents responsible for own grandchildren in Union Gap
Grandparents (30 to 59 years) White / Caucasian 27 100.0% Not responsible for grandchildrenOther race 40 100.0% Not responsible for grandchildrenWhite alone, not Hispanic / Latino 60 100.0% Not responsible for grandchildrenHispanic or Latino 21 100.0% Not responsible for grandchildren
Grandparents (60 years and over) White / Caucasian 23 100.0% Not responsible for grandchildrenHispanic or Latino 15 100.0% Not responsible for grandchildren