Races in Union, South Carolina (SC) Detailed Stats
Data:
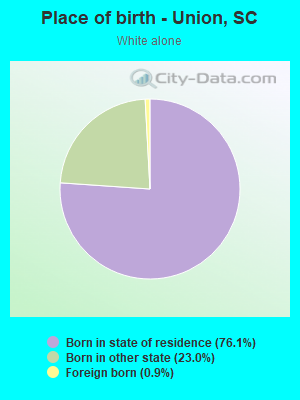
Races - White alone (%)
Races - White alone (% change since 2000)
Races - Black alone (%)
Races - Black alone (% change since 2000)
Races - American Indian alone (%)
Races - American Indian alone (% change since 2000)
Races - Asian alone (%)
Races - Asian alone (% change since 2000)
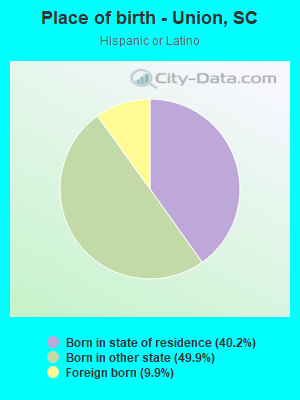
Races - Hispanic (%)
Races - Hispanic (% change since 2000)
Races - Native Hawaiian and Other Pacific Islander alone (%)
Races - Native Hawaiian and Other Pacific Islander alone (% change since 2000)
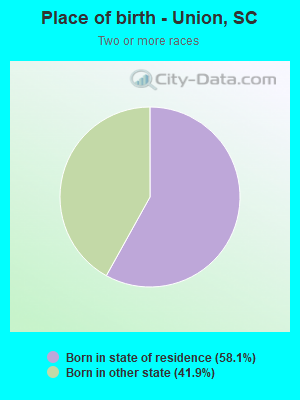
Races - Two or more races(%)
Races - Two or more races(% change since 2000)
Races - Other race alone (%)
Races - Other race alone (% change since 2000)
Racial diversity
Place of birth - Born in state of residence (%)
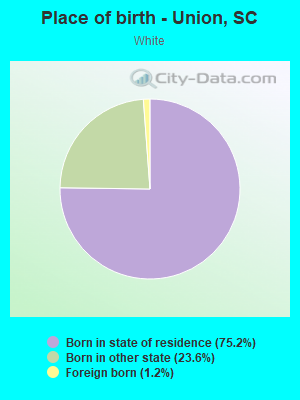
Place of birth - Born in state of residence (%) - White
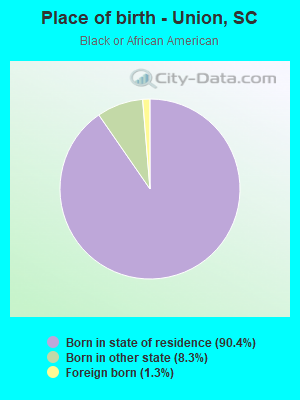
Place of birth - Born in state of residence (%) - Black or African American
Place of birth - Born in state of residence (%) - Asian
Place of birth - Born in state of residence (%) - Hispanic or Latino
Place of birth - Born in state of residence (%) - American Indian and Alaska Native
Place of birth - Born in state of residence (%) - Multirace
Place of birth - Born in state of residence (%) - Other Race
Place of birth - Born in other state (%)
Place of birth - Born in other state (%) - White
Place of birth - Born in other state (%) - Black or African American
Place of birth - Born in other state (%) - Asian
Place of birth - Born in other state (%) - Hispanic or Latino
Place of birth - Born in other state (%) - American Indian and Alaska Native
Place of birth - Born in other state (%) - Multirace
Place of birth - Born in other state (%) - Other Race
Place of birth - Native, outside of US (%)
Place of birth - Native, outside of US (%) - White
Place of birth - Native, outside of US (%) - Black or African American
Place of birth - Native, outside of US (%) - Asian
Place of birth - Native, outside of US (%) - Hispanic or Latino
Place of birth - Native, outside of US (%) - American Indian and Alaska Native
Place of birth - Native, outside of US (%) - Multirace
Place of birth - Native, outside of US (%) - Other Race
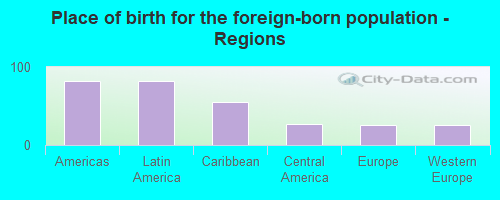
Place of birth - Foreign born (%)
Place of birth - Foreign born (%) - White
Place of birth - Foreign born (%) - Black or African American
Place of birth - Foreign born (%) - Asian
Place of birth - Foreign born (%) - Hispanic or Latino
Place of birth - Foreign born (%) - American Indian and Alaska Native
Place of birth - Foreign born (%) - Multirace
Place of birth - Foreign born (%) - Other Race
Residents speaking English at home (%)
Residents speaking English at home - Born in the United States (%)
Residents speaking English at home - Native, born elsewhere (%)
Residents speaking English at home - Foreign born (%)
Residents speaking Spanish at home (%)
Residents speaking Spanish at home - Born in the United States (%)
Residents speaking Spanish at home - Native, born elsewhere (%)
Residents speaking Spanish at home - Foreign born (%)
Residents speaking other language at home (%)
Residents speaking other language at home - Born in the United States (%)
Residents speaking other language at home - Native, born elsewhere (%)
Residents speaking other language at home - Foreign born (%)
Marital status - Never married (%)
Marital status - Now married (%)
Marital status - Separated (%)
Marital status - Widowed (%)
Marital status - Divorced (%)
Ancestries Reported - Arab (%)
Ancestries Reported - Czech (%)
Ancestries Reported - Danish (%)
Ancestries Reported - Dutch (%)
Ancestries Reported - English (%)
Ancestries Reported - French (%)
Ancestries Reported - French Canadian (%)
Ancestries Reported - German (%)
Ancestries Reported - Greek (%)
Ancestries Reported - Hungarian (%)
Ancestries Reported - Irish (%)
Ancestries Reported - Italian (%)
Ancestries Reported - Lithuanian (%)
Ancestries Reported - Norwegian (%)
Ancestries Reported - Polish (%)
Ancestries Reported - Portuguese (%)
Ancestries Reported - Russian (%)
Ancestries Reported - Scotch-Irish (%)
Ancestries Reported - Scottish (%)
Ancestries Reported - Slovak (%)
Ancestries Reported - Subsaharan African (%)
Ancestries Reported - Swedish (%)
Ancestries Reported - Swiss (%)
Ancestries Reported - Ukrainian (%)
Ancestries Reported - United States (%)
Ancestries Reported - Welsh (%)
Ancestries Reported - West Indian (%)
Ancestries Reported - Other (%)
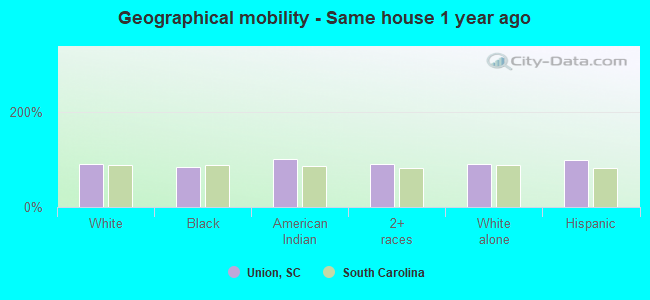
Geographical mobility - Same house 1 year ago (%)
Geographical mobility - Same house 1 year ago (%) - White
Geographical mobility - Same house 1 year ago (%) - Black or African American
Geographical mobility - Same house 1 year ago (%) - Asian
Geographical mobility - Same house 1 year ago (%) - Hispanic or Latino
Geographical mobility - Same house 1 year ago (%) - American Indian and Alaska Native
Geographical mobility - Same house 1 year ago (%) - Multirace
Geographical mobility - Same house 1 year ago (%) - Other Race
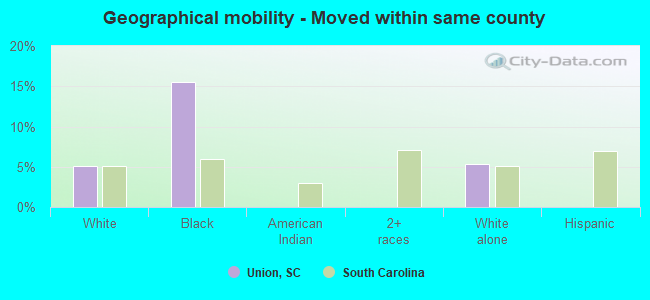
Geographical mobility - Moved within same county (%)
Geographical mobility - Moved within same county (%) - White
Geographical mobility - Moved within same county (%) - Black or African American
Geographical mobility - Moved within same county (%) - Asian
Geographical mobility - Moved within same county (%) - Hispanic or Latino
Geographical mobility - Moved within same county (%) - American Indian and Alaska Native
Geographical mobility - Moved within same county (%) - Multirace
Geographical mobility - Moved within same county (%) - Other Race
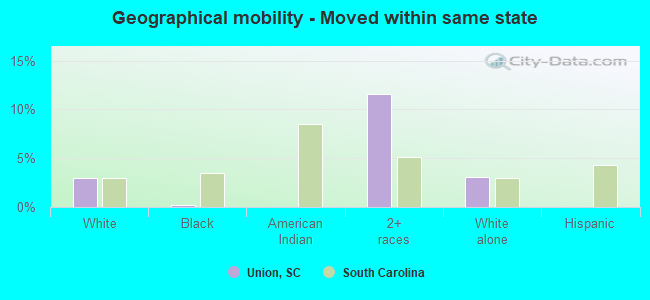
Geographical mobility - Moved from different county within same state (%)
Geographical mobility - Moved from different county within same state (%) - White
Geographical mobility - Moved from different county within same state (%) - Black or African American
Geographical mobility - Moved from different county within same state (%) - Asian
Geographical mobility - Moved from different county within same state (%) - Hispanic or Latino
Geographical mobility - Moved from different county within same state (%) - American Indian and Alaska Native
Geographical mobility - Moved from different county within same state (%) - Multirace
Geographical mobility - Moved from different county within same state (%) - Other Race
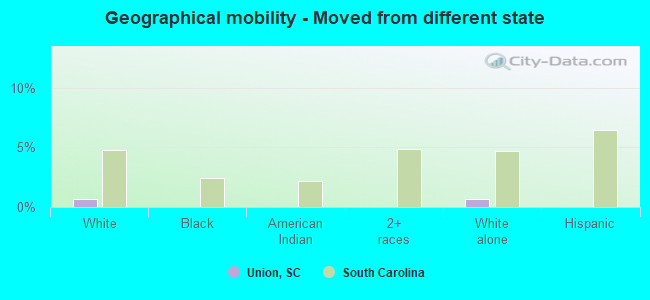
Geographical mobility - Moved from different state (%)
Geographical mobility - Moved from different state (%) - White
Geographical mobility - Moved from different state (%) - Black or African American
Geographical mobility - Moved from different state (%) - Asian
Geographical mobility - Moved from different state (%) - Hispanic or Latino
Geographical mobility - Moved from different state (%) - American Indian and Alaska Native
Geographical mobility - Moved from different state (%) - Multirace
Geographical mobility - Moved from different state (%) - Other Race
Geographical mobility - Moved from abroad (%)
Geographical mobility - Moved from abroad (%) - White
Geographical mobility - Moved from abroad (%) - Black or African American
Geographical mobility - Moved from abroad (%) - Asian
Geographical mobility - Moved from abroad (%) - Hispanic or Latino
Geographical mobility - Moved from abroad (%) - American Indian and Alaska Native
Geographical mobility - Moved from abroad (%) - Multirace
Geographical mobility - Moved from abroad (%) - Other Race
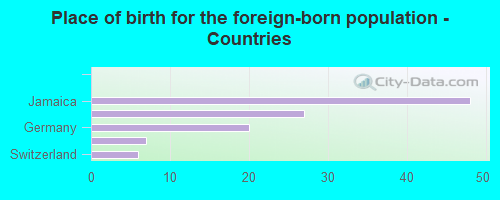
Place of birth for the foreign-born population - Ireland (%)
Place of birth for the foreign-born population - Denmark (%)
Place of birth for the foreign-born population - Norway (%)
Place of birth for the foreign-born population - Sweden (%)
Place of birth for the foreign-born population - United Kingdom (%)
Place of birth for the foreign-born population - England (%)
Place of birth for the foreign-born population - Scotland (%)
Place of birth for the foreign-born population - Other Northern Europe (%)
Place of birth for the foreign-born population - Austria (%)
Place of birth for the foreign-born population - Belgium (%)
Place of birth for the foreign-born population - France (%)
Place of birth for the foreign-born population - Germany (%)
Place of birth for the foreign-born population - Netherlands (%)
Place of birth for the foreign-born population - Switzerland (%)
Place of birth for the foreign-born population - Other Western Europe (%)
Place of birth for the foreign-born population - Greece (%)
Place of birth for the foreign-born population - Italy (%)
Place of birth for the foreign-born population - Portugal (%)
Place of birth for the foreign-born population - Spain (%)
Place of birth for the foreign-born population - Other Southern Europe (%)
Place of birth for the foreign-born population - Albania (%)
Place of birth for the foreign-born population - Belarus (%)
Place of birth for the foreign-born population - Bosnia and Herzegovina (%)
Place of birth for the foreign-born population - Bulgaria (%)
Place of birth for the foreign-born population - Croatia (%)
Place of birth for the foreign-born population - Czechoslovakia (%)
Place of birth for the foreign-born population - Hungary (%)
Place of birth for the foreign-born population - Latvia (%)
Place of birth for the foreign-born population - Lithuania (%)
Place of birth for the foreign-born population - North Macedonia (Macedonia) (%)
Place of birth for the foreign-born population - Moldova (%)
Place of birth for the foreign-born population - Poland (%)
Place of birth for the foreign-born population - Romania (%)
Place of birth for the foreign-born population - Russia (%)
Place of birth for the foreign-born population - Serbia (%)
Place of birth for the foreign-born population - Ukraine (%)
Place of birth for the foreign-born population - Other Eastern Europe (%)
Place of birth for the foreign-born population - China (%)
Place of birth for the foreign-born population - Hong Kong (%)
Place of birth for the foreign-born population - Taiwan (%)
Place of birth for the foreign-born population - Japan (%)
Place of birth for the foreign-born population - Korea (%)
Place of birth for the foreign-born population - Other Eastern Asia (%)
Place of birth for the foreign-born population - Afghanistan (%)
Place of birth for the foreign-born population - Bangladesh (%)
Place of birth for the foreign-born population - India (%)
Place of birth for the foreign-born population - Iran (%)
Place of birth for the foreign-born population - Kazakhstan (%)
Place of birth for the foreign-born population - Nepal (%)
Place of birth for the foreign-born population - Pakistan (%)
Place of birth for the foreign-born population - Sri Lanka (%)
Place of birth for the foreign-born population - Uzbekistan (%)
Place of birth for the foreign-born population - Other South Central Asia (%)
Place of birth for the foreign-born population - Burma (%)
Place of birth for the foreign-born population - Cambodia (%)
Place of birth for the foreign-born population - Indonesia (%)
Place of birth for the foreign-born population - Laos (%)
Place of birth for the foreign-born population - Malaysia (%)
Place of birth for the foreign-born population - Philippines (%)
Place of birth for the foreign-born population - Singapore (%)
Place of birth for the foreign-born population - Thailand (%)
Place of birth for the foreign-born population - Vietnam (%)
Place of birth for the foreign-born population - Other South Eastern Asia (%)
Place of birth for the foreign-born population - Armenia (%)
Place of birth for the foreign-born population - Iraq (%)
Place of birth for the foreign-born population - Israel (%)
Place of birth for the foreign-born population - Jordan (%)
Place of birth for the foreign-born population - Kuwait (%)
Place of birth for the foreign-born population - Lebanon (%)
Place of birth for the foreign-born population - Saudi Arabia (%)
Place of birth for the foreign-born population - Syria (%)
Place of birth for the foreign-born population - Turkey (%)
Place of birth for the foreign-born population - Yemen (%)
Place of birth for the foreign-born population - Other Western Asia (%)
Place of birth for the foreign-born population - Eritrea (%)
Place of birth for the foreign-born population - Ethiopia (%)
Place of birth for the foreign-born population - Kenya (%)
Place of birth for the foreign-born population - Somalia (%)
Place of birth for the foreign-born population - Uganda (%)
Place of birth for the foreign-born population - Zimbabwe (%)
Place of birth for the foreign-born population - Other Eastern Africa (%)
Place of birth for the foreign-born population - Cameroon (%)
Place of birth for the foreign-born population - Congo (%)
Place of birth for the foreign-born population - Democratic Republic of Congo (Zaire) (%)
Place of birth for the foreign-born population - Other Middle Africa (%)
Place of birth for the foreign-born population - Egypt (%)
Place of birth for the foreign-born population - Morocco (%)
Place of birth for the foreign-born population - Sudan (%)
Place of birth for the foreign-born population - Other Northern Africa (%)
Place of birth for the foreign-born population - South Africa (%)
Place of birth for the foreign-born population - Other Southern Africa (%)
Place of birth for the foreign-born population - Cabo Verde (%)
Place of birth for the foreign-born population - Ghana (%)
Place of birth for the foreign-born population - Liberia (%)
Place of birth for the foreign-born population - Nigeria (%)
Place of birth for the foreign-born population - Senegal (%)
Place of birth for the foreign-born population - Sierra Leone (%)
Place of birth for the foreign-born population - Other Western Africa (%)
Place of birth for the foreign-born population - Australia (%)
Place of birth for the foreign-born population - New Zealand (%)
Place of birth for the foreign-born population - Fiji (%)
Place of birth for the foreign-born population - Micronesia (%)
Place of birth for the foreign-born population - Bahamas (%)
Place of birth for the foreign-born population - Barbados (%)
Place of birth for the foreign-born population - Cuba (%)
Place of birth for the foreign-born population - Dominica (%)
Place of birth for the foreign-born population - Dominican Republic (%)
Place of birth for the foreign-born population - Grenada (%)
Place of birth for the foreign-born population - Haiti (%)
Place of birth for the foreign-born population - Jamaica (%)
Place of birth for the foreign-born population - St. Vincent and the Grenadines (%)
Place of birth for the foreign-born population - Trinidad and Tobago (%)
Place of birth for the foreign-born population - West Indies (%)
Place of birth for the foreign-born population - Other Caribbean (%)
Place of birth for the foreign-born population - Belize (%)
Place of birth for the foreign-born population - Costa Rica (%)
Place of birth for the foreign-born population - El Salvador (%)
Place of birth for the foreign-born population - Guatemala (%)
Place of birth for the foreign-born population - Honduras (%)
Place of birth for the foreign-born population - Mexico (%)
Place of birth for the foreign-born population - Nicaragua (%)
Place of birth for the foreign-born population - Panama (%)
Place of birth for the foreign-born population - Other Central America (%)
Place of birth for the foreign-born population - Argentina (%)
Place of birth for the foreign-born population - Bolivia (%)
Place of birth for the foreign-born population - Brazil (%)
Place of birth for the foreign-born population - Chile (%)
Place of birth for the foreign-born population - Colombia (%)
Place of birth for the foreign-born population - Ecuador (%)
Place of birth for the foreign-born population - Guyana (%)
Place of birth for the foreign-born population - Peru (%)
Place of birth for the foreign-born population - Uruguay (%)
Place of birth for the foreign-born population - Venezuela (%)
Place of birth for the foreign-born population - Other South America (%)
Place of birth for the foreign-born population - Canada (%)
Place of birth for the foreign-born population - Other Northern America (%)
Place of birth for the foreign-born population - Other (%)
Latest news about races in Union, SC collected exclusively by city-data.com from local newspapers, TV, and radio stations
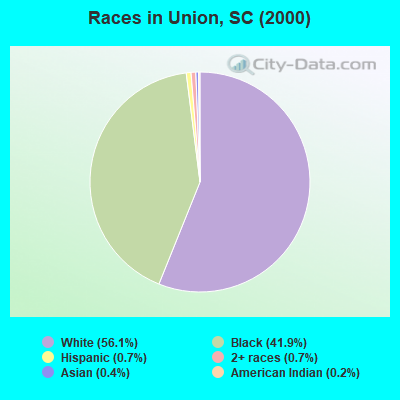
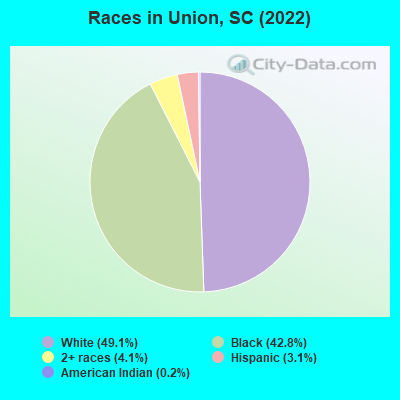
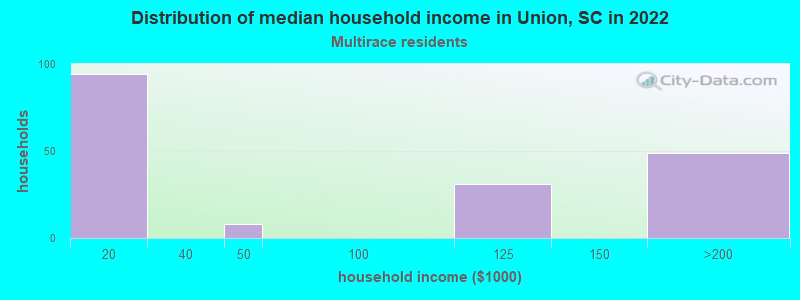
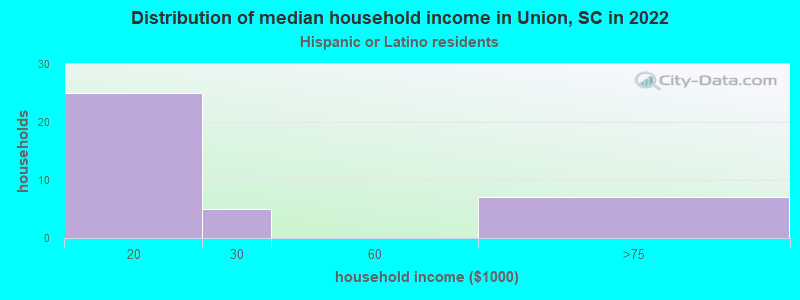
According to 2022 data, the most numerous races in Union, SC are White alone (4,086 residents), Black alone (3,560 residents), and Hispanic (257 residents). 98.5% of Union residents speak English at home. 1.3% of Union, SC residents are foreign-born , which is 281.6% less than the foreign-born rate of 5.0% across the entire state of South Carolina.
Race distribution in Union
2000 2022
2,652,291 66.1% White alone 1,178,486 29.4% Black alone 95,076 2.4% Hispanic 35,568 0.9% Asian alone 33,290 0.8% Two or more races 12,765 0.3% American Indian alone 3,266 0.08% Other race alone 1,270 0.03% Native Hawaiian and Other
3,301,739 62.5% White alone 1,313,290 24.9% Black alone 343,783 6.5% Hispanic 190,508 3.6% Two or more races 89,888 1.7% Asian alone 29,390 0.6% Other race alone 12,112 0.2% American Indian alone 1,924 0.04% Native Hawaiian and Other
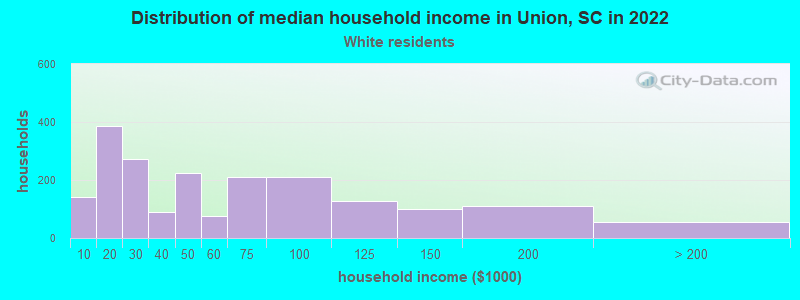
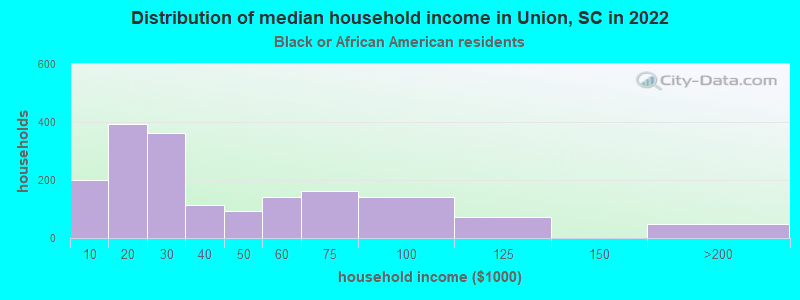
Income and house value in Union Median household income in 2022 $44,581 White non-Hispanic householders$27,707 Black householdersMedian 2022 house value $134,617 White Non-Hispanic householders$87,558 Black or African American householders $144,645 Asian householders$86,787 Hispanic or Latino householders
Median age by race in Union
49.5 Median age for White residents46.4 52.6 39.2 Median age for Black or African American residents32.5 44.3 -626,702,996.6 Median age for American Indian / Alaska Native residents-583,333,332.8 -659,400,544.3 -704,301,074.6 Median age for Asian residents-720,616,569.6 -688,832,053.9 -698,412,697.7 Median age for Native Hawaiian / Pacific Islander residents-551,574,375.1 -1,016,109,044.8 -666,666,666.0 Median age for Other race residents-664,451,826.6 -659,549,228.3 36.6 Median age for Two or more races residents35.2 37.9 50.9 Median age for White alone residents46.5 53.2 24.6 Median age for Hispanic or Latino residents15.4 35.0
Owner/renter occupied households by race in Union
House owners and renters - White residents 1,281 64.1% Owner occupied719 35.9% Renter occupiedHouse owners and renters - Black or African American residents 599 34.8% Owner occupied1,124 65.2% Renter occupiedHouse owners and renters - American Indian / Alaska Native residents 18 100.0% Owner occupiedHouse owners and renters - Two or more races residents 30 15.5% Owner occupied161 84.5% Renter occupiedHouse owners and renters - White alone residents 1,289 64.7% Owner occupied704 35.3% Renter occupiedHouse owners and renters - Hispanic or Latino residents 7 16.0% Owner occupied36 84.0% Renter occupied
Language usage in Union
English speakers - Total 98.5% of residents of Union speak English at home.
0.9% of residents speak Spanish at home 72 100.0% Speak English less than very well0.3% of residents speak other language at home 6 24.0% Speak English very well19 76.0% Speak English less than very well
English speakers - Born in the United States 96.5% of residents of Union speak English at home.
3.8% of residents speak Spanish at home 53 100.0% Speak English less than very well
English speakers - Foreign-born 47.7% of residents of Union speak English at home.
22.9% of residents speak Spanish at home 25 100.0% Speak English less than very well22.9% of residents speak other language at home 6 24.0% Speak English very well19 76.0% Speak English less than very well
White (Caucasian) - Speak only English Native:
99.2% (3,879)Foreign-born:
14.5% (7)
White (Caucasian) - Speak another language Native:
1.0% (38)Foreign-born:
77.2% (37)
Black or African American - Speak only English Native:
99.8% (3,376)Foreign-born:
68.5% (32)
White alone - Speak only English Native:
100.0% (3,879)Foreign-born:
21.8% (7)
Hispanic or Latino - Speak another language Native:
28.6% (50)Foreign-born:
100.0% (26)
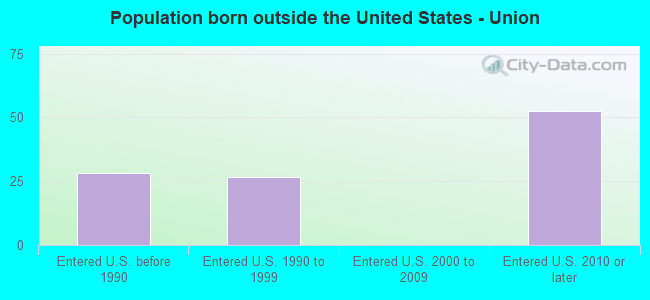
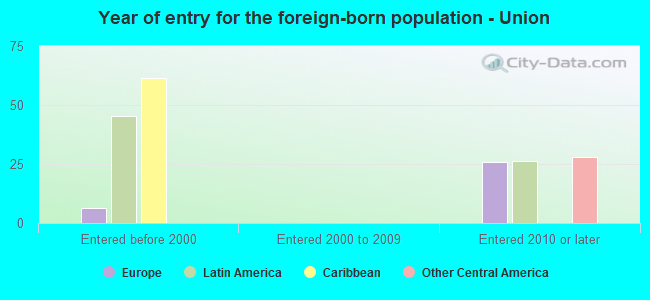
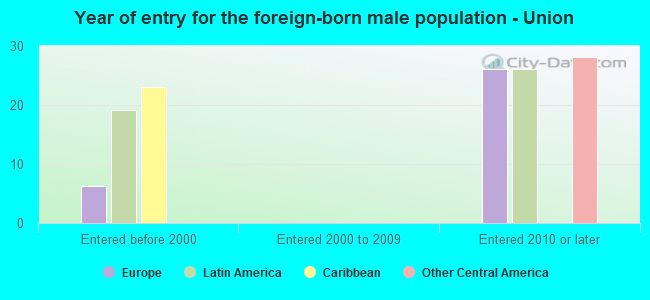
Foreign-born residents in Union 109 residents are foreign born
This city:
1.3%South Carolina:
5.3%
Marital status for residents in Union Marital status - White (Caucasian) population 15 years and over
Males 26.6% Never married51.2% Now married2.5% Separated4.6% Widowed15.1% DivorcedFemales 29.4% Never married39.7% Now married2.0% Separated16.4% Widowed12.6% DivorcedWomen who gave birth in the past 12 months Now married:
34.8% (31)Unmarried:
65.2% (58)
Women who did not give birth in the past 12 months Now married:
28.6% (213)Unmarried:
71.4% (534)
Marital status - Black or African American population 15 years and over
Males 43.2% Never married30.0% Now married10.4% Separated7.6% Widowed8.9% DivorcedFemales 51.0% Never married22.6% Now married7.5% Separated8.9% Widowed10.0% DivorcedWomen who gave birth in the past 12 months Now married:
57.1% (12)Unmarried:
42.9% (9)
Women who did not give birth in the past 12 months Now married:
31.4% (313)Unmarried:
68.6% (683)
Marital status - Two or more races population 15 years and over
Males 32.6% Never married41.3% Now married26.1% Separated0.0% Widowed0.0% DivorcedFemales 35.6% Never married45.6% Now married0.0% Separated18.8% Widowed0.0% DivorcedWomen who did not give birth in the past 12 months Now married:
27.8% (30)Unmarried:
72.2% (77)
Marital status - White alone, not Hispanic / Latino population 15 years and over
Males 25.9% Never married51.1% Now married2.6% Separated4.8% Widowed15.6% DivorcedFemales 29.5% Never married39.1% Now married2.0% Separated16.6% Widowed12.8% DivorcedWomen who gave birth in the past 12 months Now married:
34.8% (31)Unmarried:
65.2% (58)
Women who did not give birth in the past 12 months Now married:
26.6% (194)Unmarried:
73.4% (536)
Marital status - Hispanic or Latino population 15 years and over
Males 48.4% Never married51.6% Now married0.0% Separated0.0% Widowed0.0% DivorcedFemales 18.9% Never married81.1% Now married0.0% Separated0.0% Widowed0.0% DivorcedWomen who did not give birth in the past 12 months Now married:
60.9% (31)Unmarried:
39.1% (20)
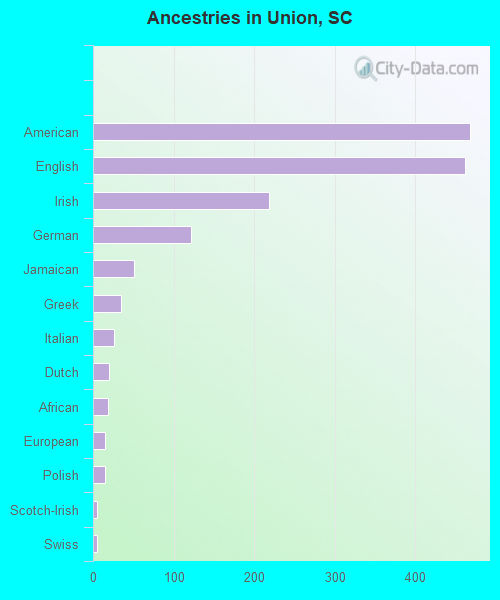
Ancestries in Union
468 12.3% American461 12.1% English218 5.7% Irish122 3.2% German51 1.3% Jamaican35 0.9% Greek26 0.7% Italian20 0.5% Dutch18 0.5% African15 0.4% European15 0.4% Polish5 0.1% Scotch-Irish5 0.1% Swiss4 0.1% Northern European
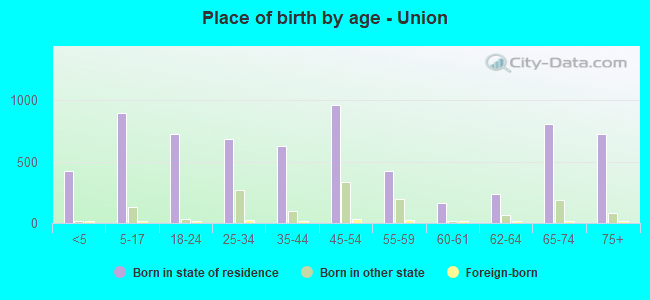
Children Nativity (place of birth) in Union
Children under 6 years - Living with two parents Both parents native 144 100.0% NativeOne native, one foreign-born parent 61 100.0% NativeChildren under 6 years - Living with one parent Native parent 274 100.0% NativeChildren 6 to 17 years - Living with two parents Both parents native 468 100.0% NativeOne native, one foreign-born parent 27 100.0% NativeChildren 6 to 17 years - Living with one parent Native parent 410 100.0% NativeForeign-born parent 20 49.6% Native20 50.4% Foreign-born
Grandparents responsible for own grandchildren in Union
Grandparents (30 to 59 years) White / Caucasian 21 35.3% Responsible for grandchildren38 64.7% Not responsible for grandchildrenBlack or African American 10 25.6% Responsible for grandchildren30 74.4% Not responsible for grandchildrenWhite alone, not Hispanic / Latino 21 35.8% Responsible for grandchildren38 64.2% Not responsible for grandchildrenGrandparents (60 years and over) White / Caucasian 6 22.8% Responsible for grandchildren19 77.2% Not responsible for grandchildrenBlack or African American 24 35.8% Responsible for grandchildren43 64.2% Not responsible for grandchildrenWhite alone, not Hispanic / Latino 6 22.6% Responsible for grandchildren19 77.4% Not responsible for grandchildren