Races in Uniondale, New York (NY) Detailed Stats
Data:
Races - White alone (%)
Races - White alone (% change since 2000)
Races - Black alone (%)
Races - Black alone (% change since 2000)
Races - American Indian alone (%)
Races - American Indian alone (% change since 2000)
Races - Asian alone (%)
Races - Asian alone (% change since 2000)
Races - Hispanic (%)
Races - Hispanic (% change since 2000)
Races - Native Hawaiian and Other Pacific Islander alone (%)
Races - Native Hawaiian and Other Pacific Islander alone (% change since 2000)
Races - Two or more races(%)
Races - Two or more races(% change since 2000)
Races - Other race alone (%)
Races - Other race alone (% change since 2000)
Racial diversity
Place of birth - Born in state of residence (%)
Place of birth - Born in state of residence (%) - White
Place of birth - Born in state of residence (%) - Black or African American
Place of birth - Born in state of residence (%) - Asian
Place of birth - Born in state of residence (%) - Hispanic or Latino
Place of birth - Born in state of residence (%) - American Indian and Alaska Native
Place of birth - Born in state of residence (%) - Multirace
Place of birth - Born in state of residence (%) - Other Race
Place of birth - Born in other state (%)
Place of birth - Born in other state (%) - White
Place of birth - Born in other state (%) - Black or African American
Place of birth - Born in other state (%) - Asian
Place of birth - Born in other state (%) - Hispanic or Latino
Place of birth - Born in other state (%) - American Indian and Alaska Native
Place of birth - Born in other state (%) - Multirace
Place of birth - Born in other state (%) - Other Race
Place of birth - Native, outside of US (%)
Place of birth - Native, outside of US (%) - White
Place of birth - Native, outside of US (%) - Black or African American
Place of birth - Native, outside of US (%) - Asian
Place of birth - Native, outside of US (%) - Hispanic or Latino
Place of birth - Native, outside of US (%) - American Indian and Alaska Native
Place of birth - Native, outside of US (%) - Multirace
Place of birth - Native, outside of US (%) - Other Race
Place of birth - Foreign born (%)
Place of birth - Foreign born (%) - White
Place of birth - Foreign born (%) - Black or African American
Place of birth - Foreign born (%) - Asian
Place of birth - Foreign born (%) - Hispanic or Latino
Place of birth - Foreign born (%) - American Indian and Alaska Native
Place of birth - Foreign born (%) - Multirace
Place of birth - Foreign born (%) - Other Race
Residents speaking English at home (%)
Residents speaking English at home - Born in the United States (%)
Residents speaking English at home - Native, born elsewhere (%)
Residents speaking English at home - Foreign born (%)
Residents speaking Spanish at home (%)
Residents speaking Spanish at home - Born in the United States (%)
Residents speaking Spanish at home - Native, born elsewhere (%)
Residents speaking Spanish at home - Foreign born (%)
Residents speaking other language at home (%)
Residents speaking other language at home - Born in the United States (%)
Residents speaking other language at home - Native, born elsewhere (%)
Residents speaking other language at home - Foreign born (%)
Marital status - Never married (%)
Marital status - Now married (%)
Marital status - Separated (%)
Marital status - Widowed (%)
Marital status - Divorced (%)
Ancestries Reported - Arab (%)
Ancestries Reported - Czech (%)
Ancestries Reported - Danish (%)
Ancestries Reported - Dutch (%)
Ancestries Reported - English (%)
Ancestries Reported - French (%)
Ancestries Reported - French Canadian (%)
Ancestries Reported - German (%)
Ancestries Reported - Greek (%)
Ancestries Reported - Hungarian (%)
Ancestries Reported - Irish (%)
Ancestries Reported - Italian (%)
Ancestries Reported - Lithuanian (%)
Ancestries Reported - Norwegian (%)
Ancestries Reported - Polish (%)
Ancestries Reported - Portuguese (%)
Ancestries Reported - Russian (%)
Ancestries Reported - Scotch-Irish (%)
Ancestries Reported - Scottish (%)
Ancestries Reported - Slovak (%)
Ancestries Reported - Subsaharan African (%)
Ancestries Reported - Swedish (%)
Ancestries Reported - Swiss (%)
Ancestries Reported - Ukrainian (%)
Ancestries Reported - United States (%)
Ancestries Reported - Welsh (%)
Ancestries Reported - West Indian (%)
Ancestries Reported - Other (%)
Geographical mobility - Same house 1 year ago (%)
Geographical mobility - Same house 1 year ago (%) - White
Geographical mobility - Same house 1 year ago (%) - Black or African American
Geographical mobility - Same house 1 year ago (%) - Asian
Geographical mobility - Same house 1 year ago (%) - Hispanic or Latino
Geographical mobility - Same house 1 year ago (%) - American Indian and Alaska Native
Geographical mobility - Same house 1 year ago (%) - Multirace
Geographical mobility - Same house 1 year ago (%) - Other Race
Geographical mobility - Moved within same county (%)
Geographical mobility - Moved within same county (%) - White
Geographical mobility - Moved within same county (%) - Black or African American
Geographical mobility - Moved within same county (%) - Asian
Geographical mobility - Moved within same county (%) - Hispanic or Latino
Geographical mobility - Moved within same county (%) - American Indian and Alaska Native
Geographical mobility - Moved within same county (%) - Multirace
Geographical mobility - Moved within same county (%) - Other Race
Geographical mobility - Moved from different county within same state (%)
Geographical mobility - Moved from different county within same state (%) - White
Geographical mobility - Moved from different county within same state (%) - Black or African American
Geographical mobility - Moved from different county within same state (%) - Asian
Geographical mobility - Moved from different county within same state (%) - Hispanic or Latino
Geographical mobility - Moved from different county within same state (%) - American Indian and Alaska Native
Geographical mobility - Moved from different county within same state (%) - Multirace
Geographical mobility - Moved from different county within same state (%) - Other Race
Geographical mobility - Moved from different state (%)
Geographical mobility - Moved from different state (%) - White
Geographical mobility - Moved from different state (%) - Black or African American
Geographical mobility - Moved from different state (%) - Asian
Geographical mobility - Moved from different state (%) - Hispanic or Latino
Geographical mobility - Moved from different state (%) - American Indian and Alaska Native
Geographical mobility - Moved from different state (%) - Multirace
Geographical mobility - Moved from different state (%) - Other Race
Geographical mobility - Moved from abroad (%)
Geographical mobility - Moved from abroad (%) - White
Geographical mobility - Moved from abroad (%) - Black or African American
Geographical mobility - Moved from abroad (%) - Asian
Geographical mobility - Moved from abroad (%) - Hispanic or Latino
Geographical mobility - Moved from abroad (%) - American Indian and Alaska Native
Geographical mobility - Moved from abroad (%) - Multirace
Geographical mobility - Moved from abroad (%) - Other Race
Place of birth for the foreign-born population - Ireland (%)
Place of birth for the foreign-born population - Denmark (%)
Place of birth for the foreign-born population - Norway (%)
Place of birth for the foreign-born population - Sweden (%)
Place of birth for the foreign-born population - United Kingdom (%)
Place of birth for the foreign-born population - England (%)
Place of birth for the foreign-born population - Scotland (%)
Place of birth for the foreign-born population - Other Northern Europe (%)
Place of birth for the foreign-born population - Austria (%)
Place of birth for the foreign-born population - Belgium (%)
Place of birth for the foreign-born population - France (%)
Place of birth for the foreign-born population - Germany (%)
Place of birth for the foreign-born population - Netherlands (%)
Place of birth for the foreign-born population - Switzerland (%)
Place of birth for the foreign-born population - Other Western Europe (%)
Place of birth for the foreign-born population - Greece (%)
Place of birth for the foreign-born population - Italy (%)
Place of birth for the foreign-born population - Portugal (%)
Place of birth for the foreign-born population - Spain (%)
Place of birth for the foreign-born population - Other Southern Europe (%)
Place of birth for the foreign-born population - Albania (%)
Place of birth for the foreign-born population - Belarus (%)
Place of birth for the foreign-born population - Bosnia and Herzegovina (%)
Place of birth for the foreign-born population - Bulgaria (%)
Place of birth for the foreign-born population - Croatia (%)
Place of birth for the foreign-born population - Czechoslovakia (%)
Place of birth for the foreign-born population - Hungary (%)
Place of birth for the foreign-born population - Latvia (%)
Place of birth for the foreign-born population - Lithuania (%)
Place of birth for the foreign-born population - North Macedonia (Macedonia) (%)
Place of birth for the foreign-born population - Moldova (%)
Place of birth for the foreign-born population - Poland (%)
Place of birth for the foreign-born population - Romania (%)
Place of birth for the foreign-born population - Russia (%)
Place of birth for the foreign-born population - Serbia (%)
Place of birth for the foreign-born population - Ukraine (%)
Place of birth for the foreign-born population - Other Eastern Europe (%)
Place of birth for the foreign-born population - China (%)
Place of birth for the foreign-born population - Hong Kong (%)
Place of birth for the foreign-born population - Taiwan (%)
Place of birth for the foreign-born population - Japan (%)
Place of birth for the foreign-born population - Korea (%)
Place of birth for the foreign-born population - Other Eastern Asia (%)
Place of birth for the foreign-born population - Afghanistan (%)
Place of birth for the foreign-born population - Bangladesh (%)
Place of birth for the foreign-born population - India (%)
Place of birth for the foreign-born population - Iran (%)
Place of birth for the foreign-born population - Kazakhstan (%)
Place of birth for the foreign-born population - Nepal (%)
Place of birth for the foreign-born population - Pakistan (%)
Place of birth for the foreign-born population - Sri Lanka (%)
Place of birth for the foreign-born population - Uzbekistan (%)
Place of birth for the foreign-born population - Other South Central Asia (%)
Place of birth for the foreign-born population - Burma (%)
Place of birth for the foreign-born population - Cambodia (%)
Place of birth for the foreign-born population - Indonesia (%)
Place of birth for the foreign-born population - Laos (%)
Place of birth for the foreign-born population - Malaysia (%)
Place of birth for the foreign-born population - Philippines (%)
Place of birth for the foreign-born population - Singapore (%)
Place of birth for the foreign-born population - Thailand (%)
Place of birth for the foreign-born population - Vietnam (%)
Place of birth for the foreign-born population - Other South Eastern Asia (%)
Place of birth for the foreign-born population - Armenia (%)
Place of birth for the foreign-born population - Iraq (%)
Place of birth for the foreign-born population - Israel (%)
Place of birth for the foreign-born population - Jordan (%)
Place of birth for the foreign-born population - Kuwait (%)
Place of birth for the foreign-born population - Lebanon (%)
Place of birth for the foreign-born population - Saudi Arabia (%)
Place of birth for the foreign-born population - Syria (%)
Place of birth for the foreign-born population - Turkey (%)
Place of birth for the foreign-born population - Yemen (%)
Place of birth for the foreign-born population - Other Western Asia (%)
Place of birth for the foreign-born population - Eritrea (%)
Place of birth for the foreign-born population - Ethiopia (%)
Place of birth for the foreign-born population - Kenya (%)
Place of birth for the foreign-born population - Somalia (%)
Place of birth for the foreign-born population - Uganda (%)
Place of birth for the foreign-born population - Zimbabwe (%)
Place of birth for the foreign-born population - Other Eastern Africa (%)
Place of birth for the foreign-born population - Cameroon (%)
Place of birth for the foreign-born population - Congo (%)
Place of birth for the foreign-born population - Democratic Republic of Congo (Zaire) (%)
Place of birth for the foreign-born population - Other Middle Africa (%)
Place of birth for the foreign-born population - Egypt (%)
Place of birth for the foreign-born population - Morocco (%)
Place of birth for the foreign-born population - Sudan (%)
Place of birth for the foreign-born population - Other Northern Africa (%)
Place of birth for the foreign-born population - South Africa (%)
Place of birth for the foreign-born population - Other Southern Africa (%)
Place of birth for the foreign-born population - Cabo Verde (%)
Place of birth for the foreign-born population - Ghana (%)
Place of birth for the foreign-born population - Liberia (%)
Place of birth for the foreign-born population - Nigeria (%)
Place of birth for the foreign-born population - Senegal (%)
Place of birth for the foreign-born population - Sierra Leone (%)
Place of birth for the foreign-born population - Other Western Africa (%)
Place of birth for the foreign-born population - Australia (%)
Place of birth for the foreign-born population - New Zealand (%)
Place of birth for the foreign-born population - Fiji (%)
Place of birth for the foreign-born population - Micronesia (%)
Place of birth for the foreign-born population - Bahamas (%)
Place of birth for the foreign-born population - Barbados (%)
Place of birth for the foreign-born population - Cuba (%)
Place of birth for the foreign-born population - Dominica (%)
Place of birth for the foreign-born population - Dominican Republic (%)
Place of birth for the foreign-born population - Grenada (%)
Place of birth for the foreign-born population - Haiti (%)
Place of birth for the foreign-born population - Jamaica (%)
Place of birth for the foreign-born population - St. Vincent and the Grenadines (%)
Place of birth for the foreign-born population - Trinidad and Tobago (%)
Place of birth for the foreign-born population - West Indies (%)
Place of birth for the foreign-born population - Other Caribbean (%)
Place of birth for the foreign-born population - Belize (%)
Place of birth for the foreign-born population - Costa Rica (%)
Place of birth for the foreign-born population - El Salvador (%)
Place of birth for the foreign-born population - Guatemala (%)
Place of birth for the foreign-born population - Honduras (%)
Place of birth for the foreign-born population - Mexico (%)
Place of birth for the foreign-born population - Nicaragua (%)
Place of birth for the foreign-born population - Panama (%)
Place of birth for the foreign-born population - Other Central America (%)
Place of birth for the foreign-born population - Argentina (%)
Place of birth for the foreign-born population - Bolivia (%)
Place of birth for the foreign-born population - Brazil (%)
Place of birth for the foreign-born population - Chile (%)
Place of birth for the foreign-born population - Colombia (%)
Place of birth for the foreign-born population - Ecuador (%)
Place of birth for the foreign-born population - Guyana (%)
Place of birth for the foreign-born population - Peru (%)
Place of birth for the foreign-born population - Uruguay (%)
Place of birth for the foreign-born population - Venezuela (%)
Place of birth for the foreign-born population - Other South America (%)
Place of birth for the foreign-born population - Canada (%)
Place of birth for the foreign-born population - Other Northern America (%)
Place of birth for the foreign-born population - Other (%)
Latest news about races in Uniondale, NY collected exclusively by city-data.com from local newspapers, TV, and radio stations
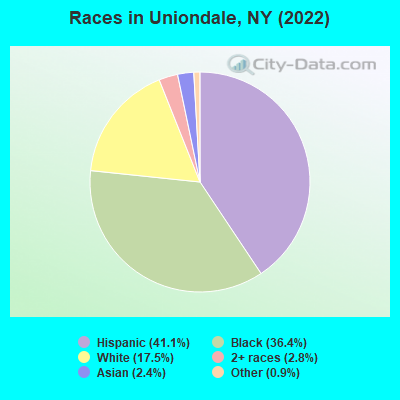
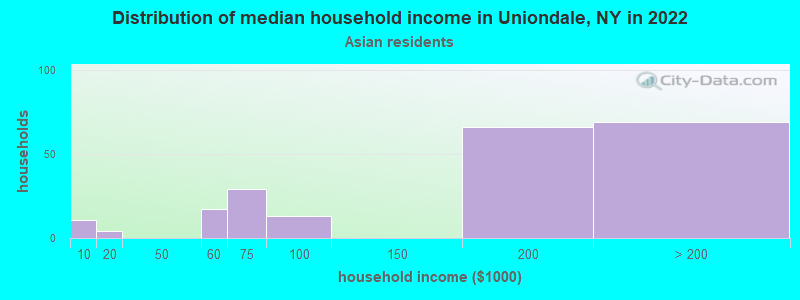
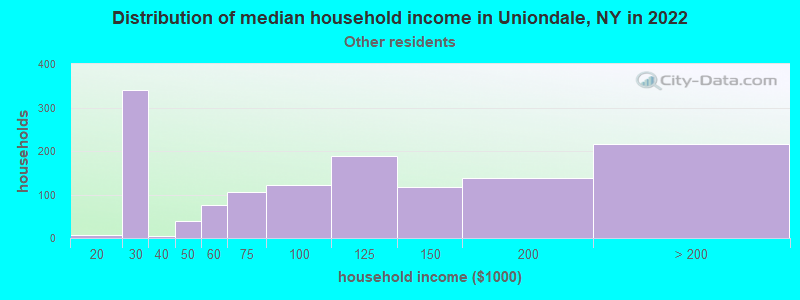
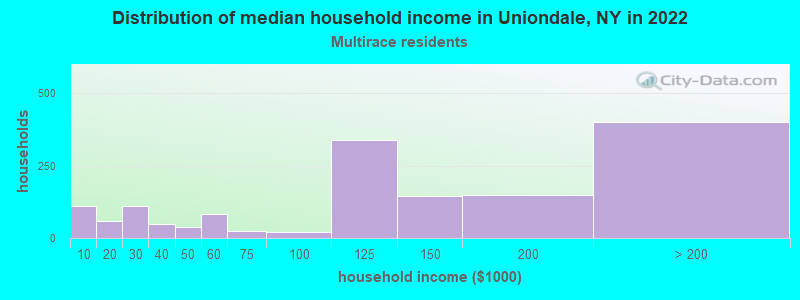
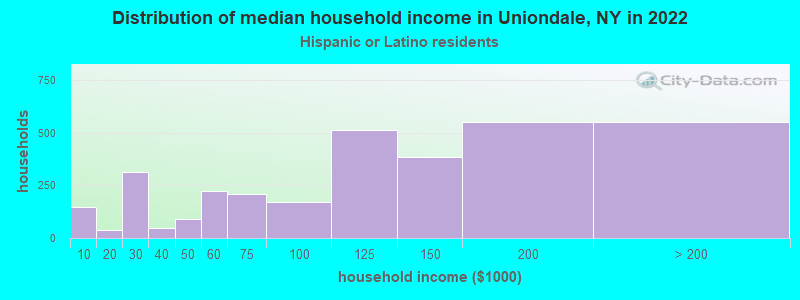
According to 2022 data, the most numerous races in Uniondale, NY are White alone (5,784 residents), Hispanic (13,601 residents), and Black alone (12,022 residents). 52.2% of Uniondale residents speak English at home. 35.5% of Uniondale, NY residents are foreign-born (32.4% born in Latin America), which is 38.0% greater than the foreign-born rate of 22.0% across the entire state of New York.
Race distribution in Uniondale
2000 2022
11,760,981 62.0% White alone 2,867,583 15.1% Hispanic 2,812,623 14.8% Black alone 1,035,926 5.5% Asian alone 366,116 1.9% Two or more races 75,499 0.4% Other race alone 52,499 0.3% American Indian alone 5,230 0.03% Native Hawaiian and Other
10,408,933 52.9% White alone 3,867,299 19.7% Hispanic 2,633,840 13.4% Black alone 1,776,286 9.0% Asian alone 732,670 3.7% Two or more races 216,110 1.1% Other race alone 35,082 0.2% American Indian alone 6,931 0.04% Native Hawaiian and Other
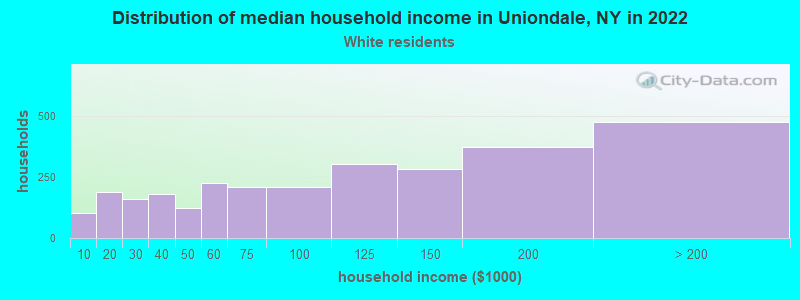
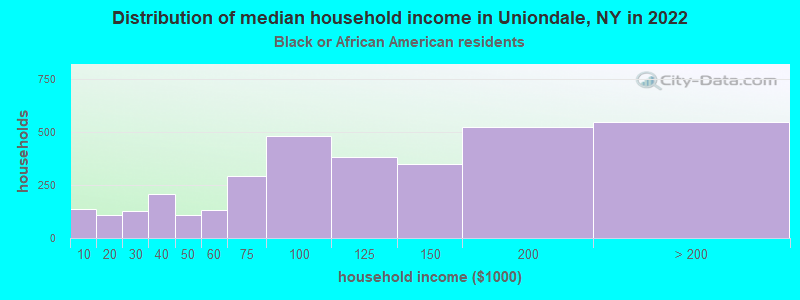
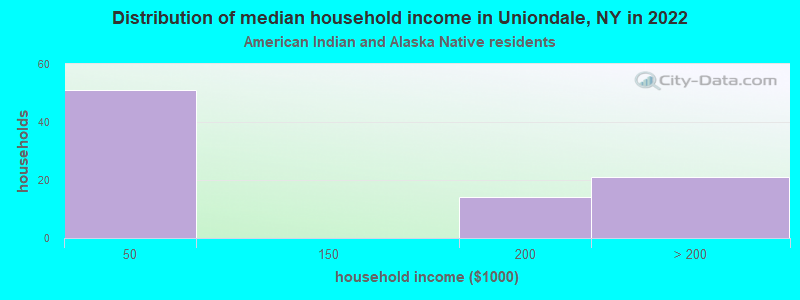
Income and house value in Uniondale Median household income in 2022 $90,525 White non-Hispanic householders$107,921 Black householders$183,027 Asian householders$106,423 Some other race householders$116,206 Two or more races householders$115,694 Hispanic or Latino race householdersMedian 2022 house value $458,325 White Non-Hispanic householders$487,457 Black or African American householders$462,651 American Indian or Alaska Native householders $666,287 Asian householders$479,669 Some other race householders$522,069 Two or more races householders$480,823 Hispanic or Latino householders
Median age by race in Uniondale
33.3 Median age for White residents33.5 33.5 35.0 Median age for Black or African American residents34.9 35.5 36.3 Median age for American Indian / Alaska Native residents39.3 23.5 32.2 Median age for Asian residents32.7 33.5 -487,992,314.6 Median age for Native Hawaiian / Pacific Islander residents-477,502,295.2 -497,387,669.3 38.6 Median age for Other race residents38.6 38.1 37.7 Median age for Two or more races residents38.2 33.1 36.7 Median age for White alone residents29.3 50.4 36.0 Median age for Hispanic or Latino residents37.7 33.2
Owner/renter occupied households by race in Uniondale
House owners and renters - White residents 1,766 61.3% Owner occupied1,117 38.7% Renter occupiedHouse owners and renters - Black or African American residents 2,868 86.2% Owner occupied459 13.8% Renter occupiedHouse owners and renters - American Indian / Alaska Native residents 90 100.0% Owner occupiedHouse owners and renters - Asian residents 100 49.2% Owner occupied103 50.8% Renter occupiedHouse owners and renters - Other race residents 840 68.4% Owner occupied387 31.6% Renter occupiedHouse owners and renters - Two or more races residents 1,074 71.5% Owner occupied429 28.5% Renter occupiedHouse owners and renters - White alone residents 1,040 55.0% Owner occupied851 45.0% Renter occupiedHouse owners and renters - Hispanic or Latino residents 2,200 70.5% Owner occupied919 29.5% Renter occupied
Language usage in Uniondale
English speakers - Total 52.2% of residents of Uniondale speak English at home.
38.1% of residents speak Spanish at home 5,004 42.5% Speak English very well6,770 57.5% Speak English less than very well9.5% of residents speak other language at home 1,940 66.1% Speak English very well993 33.9% Speak English less than very well
English speakers - Born in the United States 81.0% of residents of Uniondale speak English at home.
22.4% of residents speak Spanish at home 613 93.4% Speak English very well43 6.6% Speak English less than very well2.2% of residents speak other language at home 64 100.0% Speak English very well
English speakers - Native, born elsewhere 32.2% of residents of Uniondale speak English at home.
49.7% of residents speak Spanish at home 482 55.5% Speak English very well386 44.5% Speak English less than very well20.4% of residents speak other language at home 102 28.7% Speak English very well254 71.3% Speak English less than very well
English speakers - Foreign-born 20.9% of residents of Uniondale speak English at home.
60.3% of residents speak Spanish at home 1,623 22.3% Speak English very well5,642 77.7% Speak English less than very well15.6% of residents speak other language at home 1,168 62.0% Speak English very well716 38.0% Speak English less than very well
White (Caucasian) - Speak only English Native:
74.8% (5,373)Foreign-born:
7.5% (175)
White (Caucasian) - Speak another language Native:
20.9% (1,502)Foreign-born:
87.7% (2,063)
Black or African American - Speak only English Native:
89.6% (7,053)Foreign-born:
64.9% (1,955)
Black or African American - Speak another language Native:
10.4% (815)Foreign-born:
35.0% (1,055)
American Indian / Alaska Native - Speak another language Native:
97.8% (152)Foreign-born:
100.0% (219)
Asian - Speak only English Native:
57.5% (122)Foreign-born:
11.5% (71)
Asian - Speak another language Native:
43.0% (91)Foreign-born:
88.6% (548)
Other race - Speak only English Native:
13.7% (251)Foreign-born:
6.2% (166)
Other race - Speak another language Native:
82.3% (1,510)Foreign-born:
94.1% (2,516)
Two or more races - Speak only English Native:
37.5% (985)Foreign-born:
5.0% (159)
Two or more races - Speak another language Native:
69.4% (1,822)Foreign-born:
97.1% (3,108)
White alone - Speak only English Native:
92.8% (5,000)Foreign-born:
48.1% (166)
White alone - Speak another language Native:
7.0% (376)Foreign-born:
51.4% (177)
Hispanic or Latino - Speak only English Native:
16.1% (836)Foreign-born:
1.8% (129)
Hispanic or Latino - Speak another language Native:
84.6% (4,381)Foreign-born:
98.2% (7,134)
Foreign-born residents in Uniondale 11,728 residents are foreign born (32.4% Latin America ).
This city:
35.5%New York:
22.6%
Marital status for residents in Uniondale Marital status - White (Caucasian) population 15 years and over
Males 54.5% Never married36.9% Now married1.2% Separated2.8% Widowed4.6% DivorcedFemales 54.1% Never married28.8% Now married1.3% Separated8.1% Widowed7.8% DivorcedWomen who gave birth in the past 12 months Now married:
100.0% (99)Unmarried:
0.0% (0)
Women who did not give birth in the past 12 months Now married:
10.2% (249)Unmarried:
89.8% (2,190)
Marital status - Black or African American population 15 years and over
Males 46.9% Never married40.4% Now married0.5% Separated3.0% Widowed9.1% DivorcedFemales 46.8% Never married33.8% Now married1.3% Separated4.8% Widowed13.3% DivorcedWomen who gave birth in the past 12 months Now married:
68.0% (230)Unmarried:
32.0% (108)
Women who did not give birth in the past 12 months Now married:
28.1% (775)Unmarried:
71.9% (1,985)
Marital status - American Indian / Alaska Native population 15 years and over
Males 21.1% Never married69.1% Now married0.0% Separated0.0% Widowed9.8% DivorcedFemales 60.5% Never married39.5% Now married0.0% Separated0.0% Widowed0.0% DivorcedWomen who gave birth in the past 12 months Now married:
100.0% (13)Unmarried:
0.0% (0)
Women who did not give birth in the past 12 months Now married:
36.5% (54)Unmarried:
63.5% (94)
Marital status - Asian population 15 years and over
Males 52.9% Never married33.7% Now married0.0% Separated2.6% Widowed10.8% DivorcedFemales 47.4% Never married20.7% Now married0.0% Separated23.3% Widowed8.6% DivorcedWomen who did not give birth in the past 12 months Now married:
19.3% (51)Unmarried:
80.7% (211)
Marital status - Other race population 15 years and over
Males 39.3% Never married45.7% Now married3.9% Separated3.5% Widowed7.6% DivorcedFemales 41.1% Never married40.1% Now married2.8% Separated11.3% Widowed4.7% DivorcedWomen who gave birth in the past 12 months Now married:
56.5% (44)Unmarried:
43.5% (34)
Women who did not give birth in the past 12 months Now married:
38.0% (405)Unmarried:
62.0% (659)
Marital status - Two or more races population 15 years and over
Males 48.7% Never married44.3% Now married0.0% Separated2.3% Widowed4.6% DivorcedFemales 57.5% Never married31.7% Now married0.0% Separated3.0% Widowed7.7% DivorcedWomen who gave birth in the past 12 months Now married:
29.7% (83)Unmarried:
70.3% (197)
Women who did not give birth in the past 12 months Now married:
17.8% (230)Unmarried:
82.2% (1,063)
Marital status - White alone, not Hispanic / Latino population 15 years and over
Males 59.2% Never married32.0% Now married0.4% Separated2.8% Widowed5.5% DivorcedFemales 52.5% Never married26.7% Now married1.4% Separated11.4% Widowed8.0% DivorcedWomen who gave birth in the past 12 months Now married:
100.0% (40)Unmarried:
0.0% (0)
Women who did not give birth in the past 12 months Now married:
7.1% (105)Unmarried:
92.9% (1,371)
Marital status - Hispanic or Latino population 15 years and over
Males 44.1% Never married45.5% Now married2.0% Separated3.0% Widowed5.4% DivorcedFemales 51.5% Never married36.5% Now married1.4% Separated4.7% Widowed5.9% DivorcedWomen who gave birth in the past 12 months Now married:
59.9% (171)Unmarried:
40.1% (114)
Women who did not give birth in the past 12 months Now married:
25.1% (715)Unmarried:
74.9% (2,133)
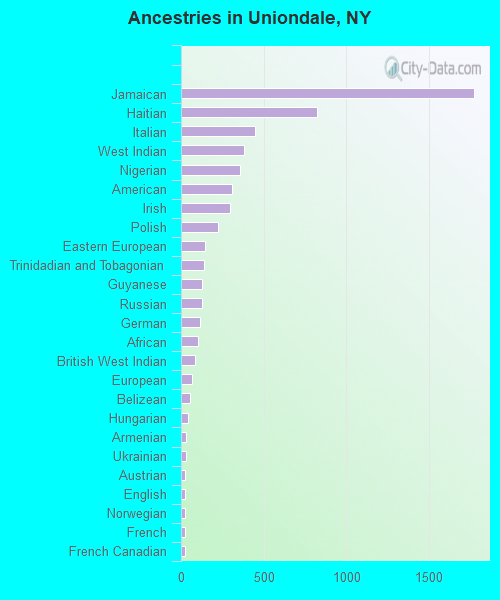
Ancestries in Uniondale
1,777 9.0% Jamaican824 4.2% Haitian451 2.3% Italian384 1.9% West Indian357 1.8% Nigerian308 1.6% American297 1.5% Irish227 1.1% Polish148 0.7% Eastern European141 0.7% Trinidadian and Tobagonian125 0.6% Guyanese125 0.6% Russian115 0.6% German103 0.5% African86 0.4% British West Indian66 0.3% European56 0.3% Belizean40 0.2% Hungarian33 0.2% Armenian29 0.1% Ukrainian24 0.1% Austrian24 0.1% English23 0.1% Norwegian22 0.1% French22 0.1% French Canadian22 0.1% Scotch-Irish21 0.1% Lithuanian20 0.1% Romanian18 0.09% Greek16 0.08% Barbadian13 0.07% U.S. Virgin Islander12 0.06% Dutch West Indian8 0.04% Moroccan7 0.04% Syrian6 0.03% Dutch6 0.03% Latvian3 0.02% Maltese
Geographical mobility in Uniondale Same house 1 year ago 8,328 81.2% White (Caucasian)10,361 91.3% Black or African American475 100.0% American Indian / Alaska Native683 80.5% Asian4,584 93.5% Other race5,417 88.7% Two or more races3,945 68.2% White alone, not Hispanic / Latino12,748 94.4% Hispanic or LatinoMoved within same county 632 6.2% White / Caucasian448 3.9% Black or African American67 7.9% Asian262 5.3% Other race253 4.1% Two or more races606 10.5% White alone, not Hispanic / Latino453 3.4% Hispanic or LatinoMoved within same state 809 7.9% White / Caucasian399 3.5% Black or African American60 7.0% Asian43 0.9% Other race140 2.3% Two or more races775 13.4% White alone, not Hispanic / Latino88 0.7% Hispanic or LatinoMoved from different state 730 7.1% White / Caucasian50 0.4% Black or African American12 1.5% Asian5 0.1% Other race103 1.7% Two or more races711 12.3% White alone, not Hispanic / Latino42 0.3% Hispanic or LatinoMoved from abroad 40 0.4% White53 0.5% Black or African American36 4.3% Asian29 0.6% Other race201 3.3% Two or more races28 0.5% White alone, not Hispanic / Latino209 1.6% Hispanic or Latino
Children Nativity (place of birth) in Uniondale
Children under 6 years - Living with two parents Both parents native 152 100.0% NativeBoth parents foreign-born 782 96.2% Native31 3.8% Foreign-bornOne native, one foreign-born parent 160 86.0% Native26 14.0% Foreign-bornChildren under 6 years - Living with one parent Native parent 347 100.0% NativeForeign-born parent 251 100.0% NativeChildren 6 to 17 years - Living with two parents Both parents native 446 100.0% NativeBoth parents foreign-born 838 83.4% Native167 16.6% Foreign-bornOne native, one foreign-born parent 221 98.2% Native4 1.8% Foreign-bornChildren 6 to 17 years - Living with one parent Native parent 358 100.0% NativeForeign-born parent 1,311 53.2% Native1,152 46.8% Foreign-born
Grandparents responsible for own grandchildren in Uniondale
Grandparents (30 to 59 years) White / Caucasian 66 100.0% Not responsible for grandchildrenBlack or African American 34 7.9% Responsible for grandchildren404 92.1% Not responsible for grandchildrenAmerican Indian / Alaska Native 8 100.0% Not responsible for grandchildrenOther race 68 100.0% Not responsible for grandchildrenHispanic or Latino 131 100.0% Not responsible for grandchildrenGrandparents (60 years and over) White / Caucasian 12 5.1% Responsible for grandchildren226 94.9% Not responsible for grandchildrenBlack or African American 28 5.0% Responsible for grandchildren524 95.0% Not responsible for grandchildrenOther race 7 8.9% Responsible for grandchildren69 91.1% Not responsible for grandchildrenHispanic or Latino 32 6.7% Responsible for grandchildren438 93.3% Not responsible for grandchildren