Races in Universal City, Texas (TX) Detailed Stats
Data:
Races - White alone (%)
Races - White alone (% change since 2000)
Races - Black alone (%)
Races - Black alone (% change since 2000)
Races - American Indian alone (%)
Races - American Indian alone (% change since 2000)
Races - Asian alone (%)
Races - Asian alone (% change since 2000)
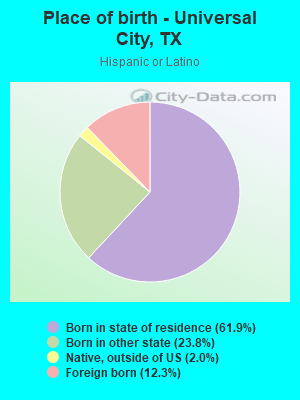
Races - Hispanic (%)
Races - Hispanic (% change since 2000)
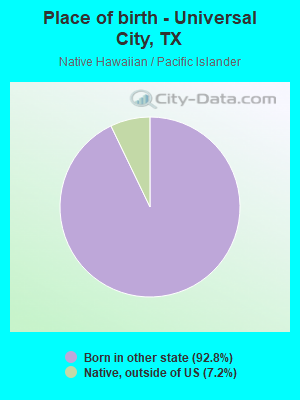
Races - Native Hawaiian and Other Pacific Islander alone (%)
Races - Native Hawaiian and Other Pacific Islander alone (% change since 2000)
Races - Two or more races(%)
Races - Two or more races(% change since 2000)
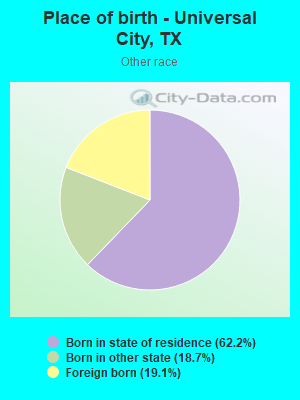
Races - Other race alone (%)
Races - Other race alone (% change since 2000)
Racial diversity
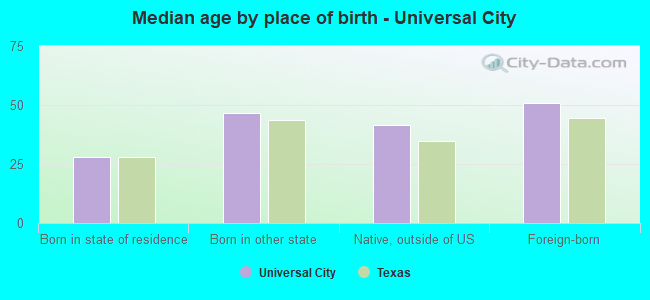
Place of birth - Born in state of residence (%)
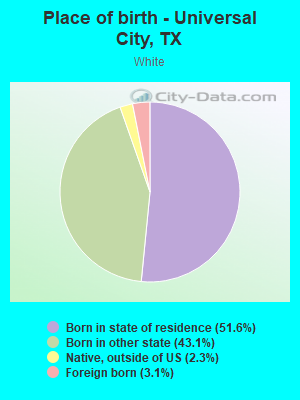
Place of birth - Born in state of residence (%) - White
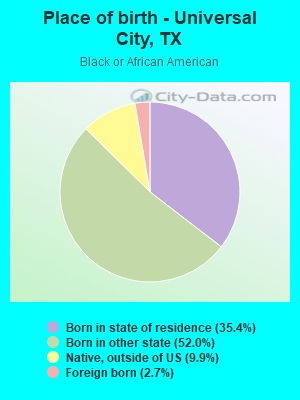
Place of birth - Born in state of residence (%) - Black or African American
Place of birth - Born in state of residence (%) - Asian
Place of birth - Born in state of residence (%) - Hispanic or Latino
Place of birth - Born in state of residence (%) - American Indian and Alaska Native
Place of birth - Born in state of residence (%) - Multirace
Place of birth - Born in state of residence (%) - Other Race
Place of birth - Born in other state (%)
Place of birth - Born in other state (%) - White
Place of birth - Born in other state (%) - Black or African American
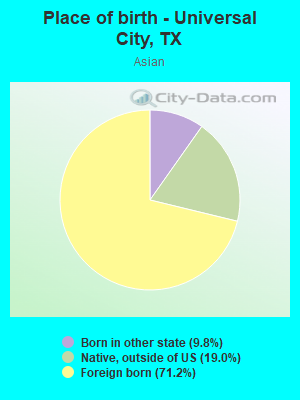
Place of birth - Born in other state (%) - Asian
Place of birth - Born in other state (%) - Hispanic or Latino
Place of birth - Born in other state (%) - American Indian and Alaska Native
Place of birth - Born in other state (%) - Multirace
Place of birth - Born in other state (%) - Other Race
Place of birth - Native, outside of US (%)
Place of birth - Native, outside of US (%) - White
Place of birth - Native, outside of US (%) - Black or African American
Place of birth - Native, outside of US (%) - Asian
Place of birth - Native, outside of US (%) - Hispanic or Latino
Place of birth - Native, outside of US (%) - American Indian and Alaska Native
Place of birth - Native, outside of US (%) - Multirace
Place of birth - Native, outside of US (%) - Other Race
Place of birth - Foreign born (%)
Place of birth - Foreign born (%) - White
Place of birth - Foreign born (%) - Black or African American
Place of birth - Foreign born (%) - Asian
Place of birth - Foreign born (%) - Hispanic or Latino
Place of birth - Foreign born (%) - American Indian and Alaska Native
Place of birth - Foreign born (%) - Multirace
Place of birth - Foreign born (%) - Other Race
Residents speaking English at home (%)
Residents speaking English at home - Born in the United States (%)
Residents speaking English at home - Native, born elsewhere (%)
Residents speaking English at home - Foreign born (%)
Residents speaking Spanish at home (%)
Residents speaking Spanish at home - Born in the United States (%)
Residents speaking Spanish at home - Native, born elsewhere (%)
Residents speaking Spanish at home - Foreign born (%)
Residents speaking other language at home (%)
Residents speaking other language at home - Born in the United States (%)
Residents speaking other language at home - Native, born elsewhere (%)
Residents speaking other language at home - Foreign born (%)
Marital status - Never married (%)
Marital status - Now married (%)
Marital status - Separated (%)
Marital status - Widowed (%)
Marital status - Divorced (%)
Ancestries Reported - Arab (%)
Ancestries Reported - Czech (%)
Ancestries Reported - Danish (%)
Ancestries Reported - Dutch (%)
Ancestries Reported - English (%)
Ancestries Reported - French (%)
Ancestries Reported - French Canadian (%)
Ancestries Reported - German (%)
Ancestries Reported - Greek (%)
Ancestries Reported - Hungarian (%)
Ancestries Reported - Irish (%)
Ancestries Reported - Italian (%)
Ancestries Reported - Lithuanian (%)
Ancestries Reported - Norwegian (%)
Ancestries Reported - Polish (%)
Ancestries Reported - Portuguese (%)
Ancestries Reported - Russian (%)
Ancestries Reported - Scotch-Irish (%)
Ancestries Reported - Scottish (%)
Ancestries Reported - Slovak (%)
Ancestries Reported - Subsaharan African (%)
Ancestries Reported - Swedish (%)
Ancestries Reported - Swiss (%)
Ancestries Reported - Ukrainian (%)
Ancestries Reported - United States (%)
Ancestries Reported - Welsh (%)
Ancestries Reported - West Indian (%)
Ancestries Reported - Other (%)
Geographical mobility - Same house 1 year ago (%)
Geographical mobility - Same house 1 year ago (%) - White
Geographical mobility - Same house 1 year ago (%) - Black or African American
Geographical mobility - Same house 1 year ago (%) - Asian
Geographical mobility - Same house 1 year ago (%) - Hispanic or Latino
Geographical mobility - Same house 1 year ago (%) - American Indian and Alaska Native
Geographical mobility - Same house 1 year ago (%) - Multirace
Geographical mobility - Same house 1 year ago (%) - Other Race
Geographical mobility - Moved within same county (%)
Geographical mobility - Moved within same county (%) - White
Geographical mobility - Moved within same county (%) - Black or African American
Geographical mobility - Moved within same county (%) - Asian
Geographical mobility - Moved within same county (%) - Hispanic or Latino
Geographical mobility - Moved within same county (%) - American Indian and Alaska Native
Geographical mobility - Moved within same county (%) - Multirace
Geographical mobility - Moved within same county (%) - Other Race
Geographical mobility - Moved from different county within same state (%)
Geographical mobility - Moved from different county within same state (%) - White
Geographical mobility - Moved from different county within same state (%) - Black or African American
Geographical mobility - Moved from different county within same state (%) - Asian
Geographical mobility - Moved from different county within same state (%) - Hispanic or Latino
Geographical mobility - Moved from different county within same state (%) - American Indian and Alaska Native
Geographical mobility - Moved from different county within same state (%) - Multirace
Geographical mobility - Moved from different county within same state (%) - Other Race
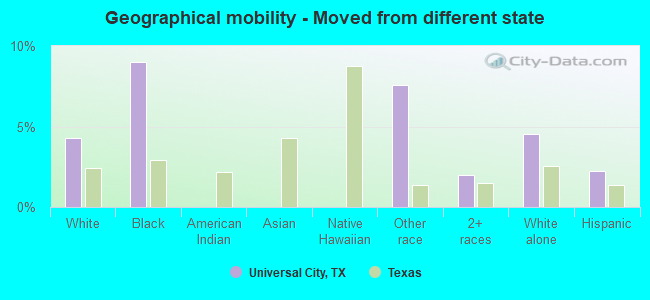
Geographical mobility - Moved from different state (%)
Geographical mobility - Moved from different state (%) - White
Geographical mobility - Moved from different state (%) - Black or African American
Geographical mobility - Moved from different state (%) - Asian
Geographical mobility - Moved from different state (%) - Hispanic or Latino
Geographical mobility - Moved from different state (%) - American Indian and Alaska Native
Geographical mobility - Moved from different state (%) - Multirace
Geographical mobility - Moved from different state (%) - Other Race
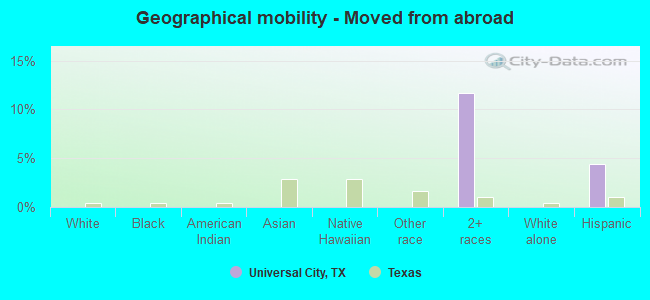
Geographical mobility - Moved from abroad (%)
Geographical mobility - Moved from abroad (%) - White
Geographical mobility - Moved from abroad (%) - Black or African American
Geographical mobility - Moved from abroad (%) - Asian
Geographical mobility - Moved from abroad (%) - Hispanic or Latino
Geographical mobility - Moved from abroad (%) - American Indian and Alaska Native
Geographical mobility - Moved from abroad (%) - Multirace
Geographical mobility - Moved from abroad (%) - Other Race
Place of birth for the foreign-born population - Ireland (%)
Place of birth for the foreign-born population - Denmark (%)
Place of birth for the foreign-born population - Norway (%)
Place of birth for the foreign-born population - Sweden (%)
Place of birth for the foreign-born population - United Kingdom (%)
Place of birth for the foreign-born population - England (%)
Place of birth for the foreign-born population - Scotland (%)
Place of birth for the foreign-born population - Other Northern Europe (%)
Place of birth for the foreign-born population - Austria (%)
Place of birth for the foreign-born population - Belgium (%)
Place of birth for the foreign-born population - France (%)
Place of birth for the foreign-born population - Germany (%)
Place of birth for the foreign-born population - Netherlands (%)
Place of birth for the foreign-born population - Switzerland (%)
Place of birth for the foreign-born population - Other Western Europe (%)
Place of birth for the foreign-born population - Greece (%)
Place of birth for the foreign-born population - Italy (%)
Place of birth for the foreign-born population - Portugal (%)
Place of birth for the foreign-born population - Spain (%)
Place of birth for the foreign-born population - Other Southern Europe (%)
Place of birth for the foreign-born population - Albania (%)
Place of birth for the foreign-born population - Belarus (%)
Place of birth for the foreign-born population - Bosnia and Herzegovina (%)
Place of birth for the foreign-born population - Bulgaria (%)
Place of birth for the foreign-born population - Croatia (%)
Place of birth for the foreign-born population - Czechoslovakia (%)
Place of birth for the foreign-born population - Hungary (%)
Place of birth for the foreign-born population - Latvia (%)
Place of birth for the foreign-born population - Lithuania (%)
Place of birth for the foreign-born population - North Macedonia (Macedonia) (%)
Place of birth for the foreign-born population - Moldova (%)
Place of birth for the foreign-born population - Poland (%)
Place of birth for the foreign-born population - Romania (%)
Place of birth for the foreign-born population - Russia (%)
Place of birth for the foreign-born population - Serbia (%)
Place of birth for the foreign-born population - Ukraine (%)
Place of birth for the foreign-born population - Other Eastern Europe (%)
Place of birth for the foreign-born population - China (%)
Place of birth for the foreign-born population - Hong Kong (%)
Place of birth for the foreign-born population - Taiwan (%)
Place of birth for the foreign-born population - Japan (%)
Place of birth for the foreign-born population - Korea (%)
Place of birth for the foreign-born population - Other Eastern Asia (%)
Place of birth for the foreign-born population - Afghanistan (%)
Place of birth for the foreign-born population - Bangladesh (%)
Place of birth for the foreign-born population - India (%)
Place of birth for the foreign-born population - Iran (%)
Place of birth for the foreign-born population - Kazakhstan (%)
Place of birth for the foreign-born population - Nepal (%)
Place of birth for the foreign-born population - Pakistan (%)
Place of birth for the foreign-born population - Sri Lanka (%)
Place of birth for the foreign-born population - Uzbekistan (%)
Place of birth for the foreign-born population - Other South Central Asia (%)
Place of birth for the foreign-born population - Burma (%)
Place of birth for the foreign-born population - Cambodia (%)
Place of birth for the foreign-born population - Indonesia (%)
Place of birth for the foreign-born population - Laos (%)
Place of birth for the foreign-born population - Malaysia (%)
Place of birth for the foreign-born population - Philippines (%)
Place of birth for the foreign-born population - Singapore (%)
Place of birth for the foreign-born population - Thailand (%)
Place of birth for the foreign-born population - Vietnam (%)
Place of birth for the foreign-born population - Other South Eastern Asia (%)
Place of birth for the foreign-born population - Armenia (%)
Place of birth for the foreign-born population - Iraq (%)
Place of birth for the foreign-born population - Israel (%)
Place of birth for the foreign-born population - Jordan (%)
Place of birth for the foreign-born population - Kuwait (%)
Place of birth for the foreign-born population - Lebanon (%)
Place of birth for the foreign-born population - Saudi Arabia (%)
Place of birth for the foreign-born population - Syria (%)
Place of birth for the foreign-born population - Turkey (%)
Place of birth for the foreign-born population - Yemen (%)
Place of birth for the foreign-born population - Other Western Asia (%)
Place of birth for the foreign-born population - Eritrea (%)
Place of birth for the foreign-born population - Ethiopia (%)
Place of birth for the foreign-born population - Kenya (%)
Place of birth for the foreign-born population - Somalia (%)
Place of birth for the foreign-born population - Uganda (%)
Place of birth for the foreign-born population - Zimbabwe (%)
Place of birth for the foreign-born population - Other Eastern Africa (%)
Place of birth for the foreign-born population - Cameroon (%)
Place of birth for the foreign-born population - Congo (%)
Place of birth for the foreign-born population - Democratic Republic of Congo (Zaire) (%)
Place of birth for the foreign-born population - Other Middle Africa (%)
Place of birth for the foreign-born population - Egypt (%)
Place of birth for the foreign-born population - Morocco (%)
Place of birth for the foreign-born population - Sudan (%)
Place of birth for the foreign-born population - Other Northern Africa (%)
Place of birth for the foreign-born population - South Africa (%)
Place of birth for the foreign-born population - Other Southern Africa (%)
Place of birth for the foreign-born population - Cabo Verde (%)
Place of birth for the foreign-born population - Ghana (%)
Place of birth for the foreign-born population - Liberia (%)
Place of birth for the foreign-born population - Nigeria (%)
Place of birth for the foreign-born population - Senegal (%)
Place of birth for the foreign-born population - Sierra Leone (%)
Place of birth for the foreign-born population - Other Western Africa (%)
Place of birth for the foreign-born population - Australia (%)
Place of birth for the foreign-born population - New Zealand (%)
Place of birth for the foreign-born population - Fiji (%)
Place of birth for the foreign-born population - Micronesia (%)
Place of birth for the foreign-born population - Bahamas (%)
Place of birth for the foreign-born population - Barbados (%)
Place of birth for the foreign-born population - Cuba (%)
Place of birth for the foreign-born population - Dominica (%)
Place of birth for the foreign-born population - Dominican Republic (%)
Place of birth for the foreign-born population - Grenada (%)
Place of birth for the foreign-born population - Haiti (%)
Place of birth for the foreign-born population - Jamaica (%)
Place of birth for the foreign-born population - St. Vincent and the Grenadines (%)
Place of birth for the foreign-born population - Trinidad and Tobago (%)
Place of birth for the foreign-born population - West Indies (%)
Place of birth for the foreign-born population - Other Caribbean (%)
Place of birth for the foreign-born population - Belize (%)
Place of birth for the foreign-born population - Costa Rica (%)
Place of birth for the foreign-born population - El Salvador (%)
Place of birth for the foreign-born population - Guatemala (%)
Place of birth for the foreign-born population - Honduras (%)
Place of birth for the foreign-born population - Mexico (%)
Place of birth for the foreign-born population - Nicaragua (%)
Place of birth for the foreign-born population - Panama (%)
Place of birth for the foreign-born population - Other Central America (%)
Place of birth for the foreign-born population - Argentina (%)
Place of birth for the foreign-born population - Bolivia (%)
Place of birth for the foreign-born population - Brazil (%)
Place of birth for the foreign-born population - Chile (%)
Place of birth for the foreign-born population - Colombia (%)
Place of birth for the foreign-born population - Ecuador (%)
Place of birth for the foreign-born population - Guyana (%)
Place of birth for the foreign-born population - Peru (%)
Place of birth for the foreign-born population - Uruguay (%)
Place of birth for the foreign-born population - Venezuela (%)
Place of birth for the foreign-born population - Other South America (%)
Place of birth for the foreign-born population - Canada (%)
Place of birth for the foreign-born population - Other Northern America (%)
Place of birth for the foreign-born population - Other (%)
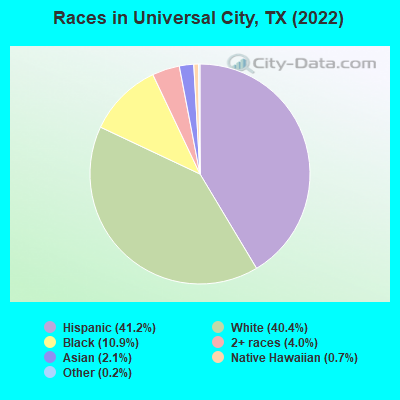
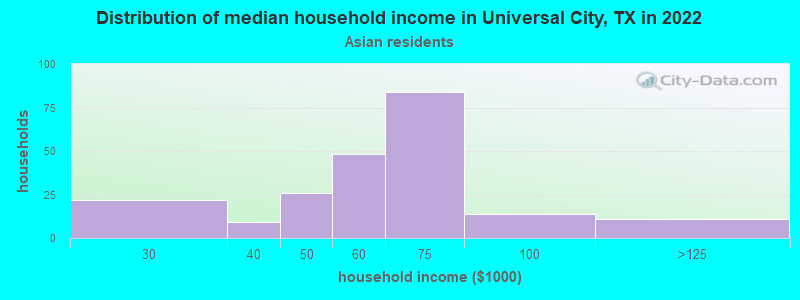
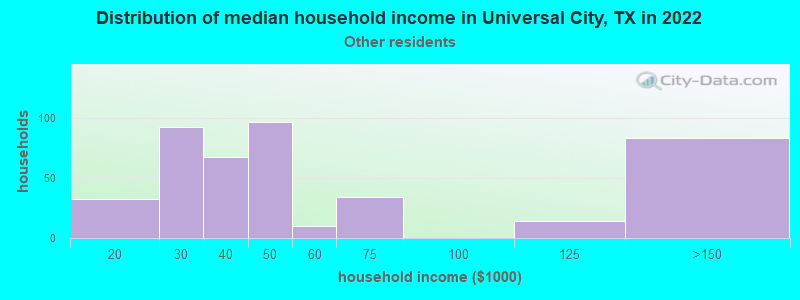
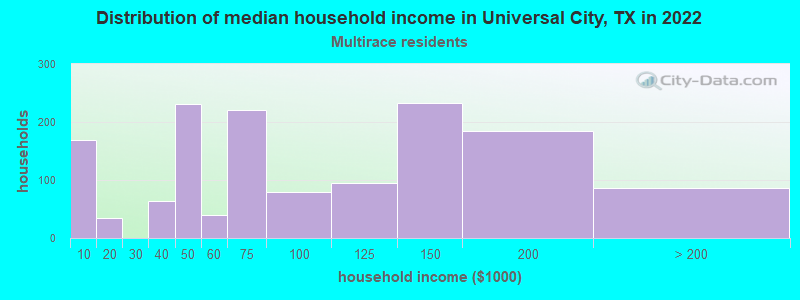
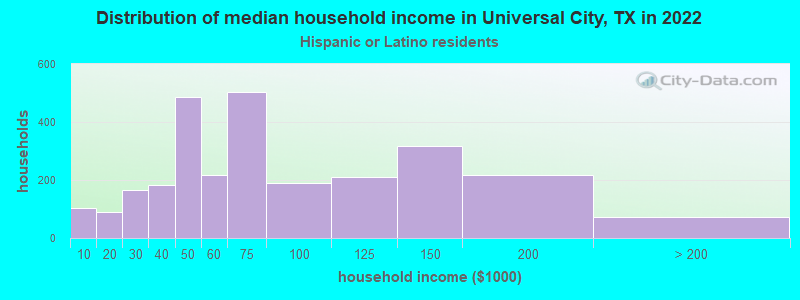
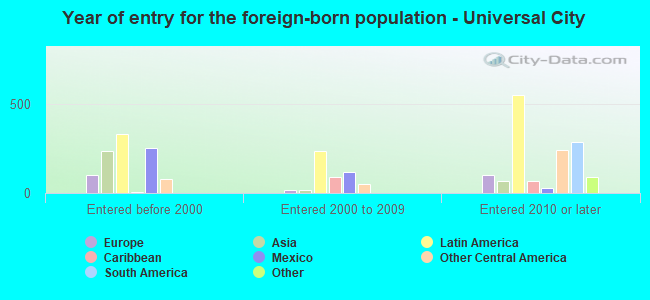
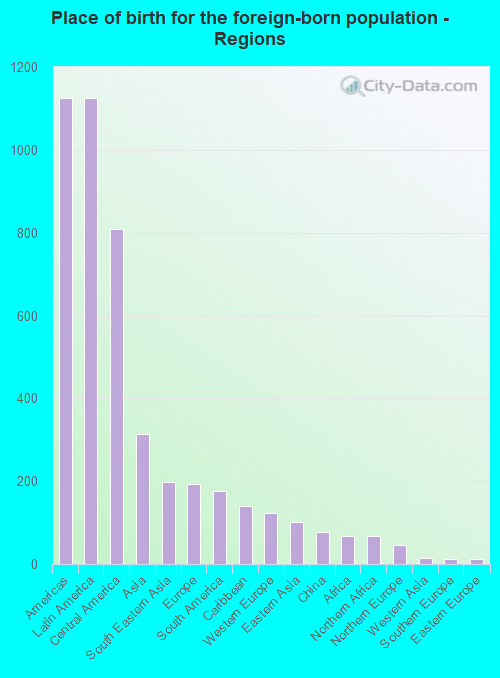
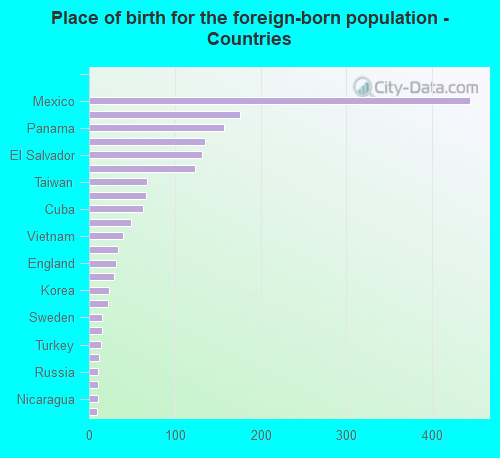
According to 2022 data, the most numerous races in Universal City, TX are Hispanic (8,332 residents), White alone (8,176 residents), and Black alone (2,212 residents). 78.4% of Universal City residents speak English at home. 8.4% of Universal City, TX residents are foreign-born (5.5% born in Latin America, 1.5% born in Asia, 0.9% born in Europe), which is 102.3% less than the foreign-born rate of 17.0% across the entire state of Texas.
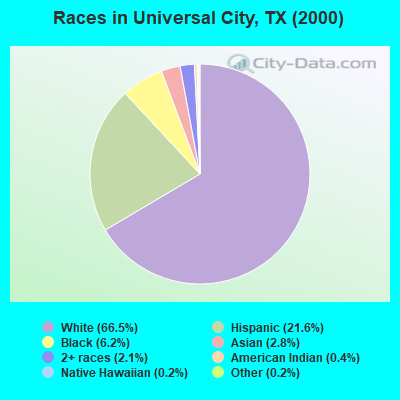
Race distribution in Universal City
2000 2022
10,933,313 52.4% White alone 6,669,666 32.0% Hispanic 2,364,255 11.3% Black alone 554,445 2.7% Asian alone 230,567 1.1% Two or more races 68,859 0.3% American Indian alone 19,958 0.10% Other race alone 10,757 0.05% Native Hawaiian and Other
12,070,642 40.2% Hispanic 11,683,430 38.9% White alone 3,508,706 11.7% Black alone 1,608,173 5.4% Asian alone 956,560 3.2% Two or more races 125,763 0.4% Other race alone 47,023 0.2% American Indian alone 29,275 0.10% Native Hawaiian and Other
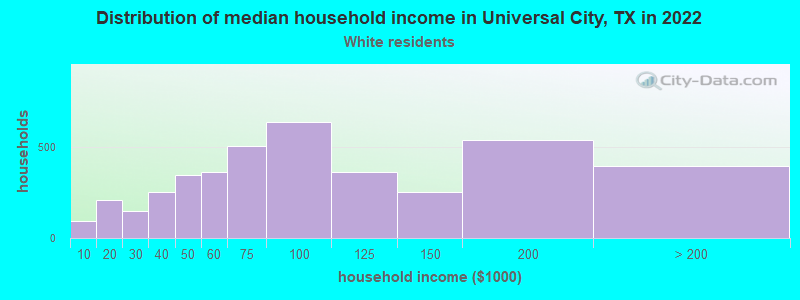
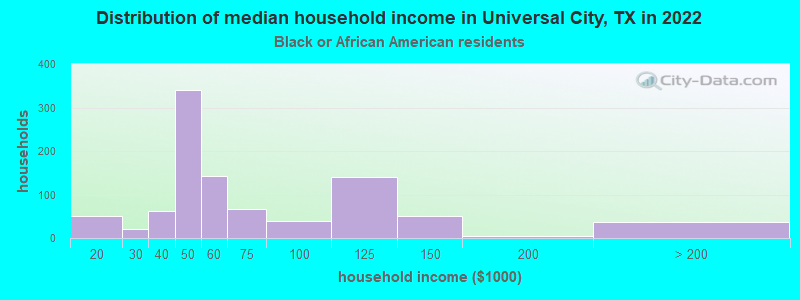
Income and house value in Universal City Median household income in 2022 $86,474 White non-Hispanic householders$49,603 Black householders$54,569 Asian householders$42,574 Some other race householders$65,614 Hispanic or Latino race householdersMedian 2022 house value $268,793 White Non-Hispanic householders$322,037 Black or African American householders$322,037 American Indian or Alaska Native householders $267,076 Asian householders$157,440 Native Hawaiian and other Pacific Islander householders$205,531 Some other race householders$280,530 Two or more races householders$221,275 Hispanic or Latino householders
Median age by race in Universal City
39.6 Median age for White residents38.2 41.4 32.1 Median age for Black or African American residents33.8 28.6 -662,686,566.5 Median age for American Indian / Alaska Native residents-656,656,656.0 -672,601,384.1 59.7 Median age for Asian residents61.5 57.7 -674,441,204.4 Median age for Native Hawaiian / Pacific Islander residents-596,986,816.7 -748,387,096.0 39.7 Median age for Other race residents35.5 43.7 29.9 Median age for Two or more races residents37.2 27.2 41.8 Median age for White alone residents41.5 42.0 32.5 Median age for Hispanic or Latino residents28.5 36.2
Owner/renter occupied households by race in Universal City
House owners and renters - White residents 2,761 67.0% Owner occupied1,358 33.0% Renter occupiedHouse owners and renters - Black or African American residents 191 20.4% Owner occupied746 79.6% Renter occupiedHouse owners and renters - American Indian / Alaska Native residents 31 100.0% Owner occupiedHouse owners and renters - Asian residents 135 58.7% Owner occupied95 41.3% Renter occupiedHouse owners and renters - Native Hawaiian / Pacific Islander residents 46 100.0% Owner occupiedHouse owners and renters - Other race residents 192 41.8% Owner occupied267 58.2% Renter occupiedHouse owners and renters - Two or more races residents 592 40.4% Owner occupied873 59.6% Renter occupiedHouse owners and renters - White alone residents 2,715 73.4% Owner occupied985 26.6% Renter occupiedHouse owners and renters - Hispanic or Latino residents 1,203 43.6% Owner occupied1,558 56.4% Renter occupied
Language usage in Universal City
English speakers - Total 78.4% of residents of Universal City speak English at home.
18.1% of residents speak Spanish at home 2,606 74.1% Speak English very well912 25.9% Speak English less than very well4.3% of residents speak other language at home 354 42.2% Speak English very well484 57.8% Speak English less than very well
English speakers - Born in the United States 93.1% of residents of Universal City speak English at home.
5.8% of residents speak Spanish at home 399 95.2% Speak English very well20 4.8% Speak English less than very well1.6% of residents speak other language at home 59 52.2% Speak English very well54 47.8% Speak English less than very well
English speakers - Native, born elsewhere 84.1% of residents of Universal City speak English at home.
10.9% of residents speak Spanish at home 13 17.6% Speak English very well61 82.4% Speak English less than very well1.8% of residents speak other language at home 12 100.0% Speak English very well
English speakers - Foreign-born 15.5% of residents of Universal City speak English at home.
54.9% of residents speak Spanish at home 341 37.6% Speak English very well566 62.4% Speak English less than very well30.8% of residents speak other language at home 227 44.6% Speak English very well282 55.4% Speak English less than very well
White (Caucasian) - Speak only English Native:
94.8% (8,533)Foreign-born:
27.4% (84)
White (Caucasian) - Speak another language Native:
10.1% (904)Foreign-born:
75.9% (234)
Black or African American - Speak only English Native:
99.7% (2,348)Foreign-born:
16.4% (11)
Black or African American - Speak another language Native:
0.9% (22)Foreign-born:
88.7% (60)
Asian - Speak only English Native:
70.8% (74)Foreign-born:
15.5% (47)
Asian - Speak another language Native:
30.8% (32)Foreign-born:
84.4% (259)
Other race - Speak only English Native:
47.9% (635)Foreign-born:
30.7% (97)
Other race - Speak another language Native:
52.0% (689)Foreign-born:
64.1% (201)
Two or more races - Speak another language Native:
27.6% (1,036)Foreign-born:
100.0% (597)
White alone - Speak only English Native:
96.9% (7,410)Foreign-born:
32.0% (81)
White alone - Speak another language Native:
3.2% (248)Foreign-born:
68.1% (172)
Hispanic or Latino - Speak only English Native:
62.7% (4,328)Foreign-born:
11.4% (117)
Hispanic or Latino - Speak another language Native:
37.7% (2,602)Foreign-born:
89.0% (915)
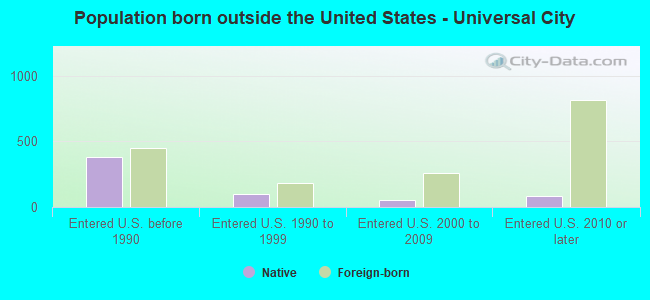
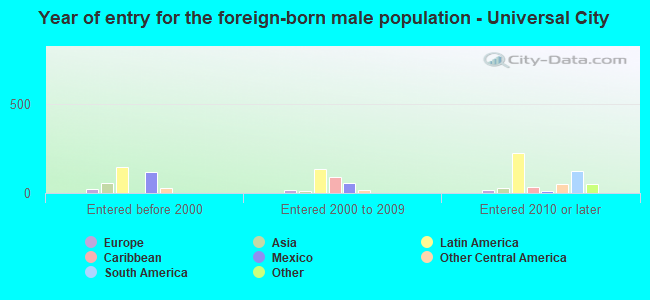
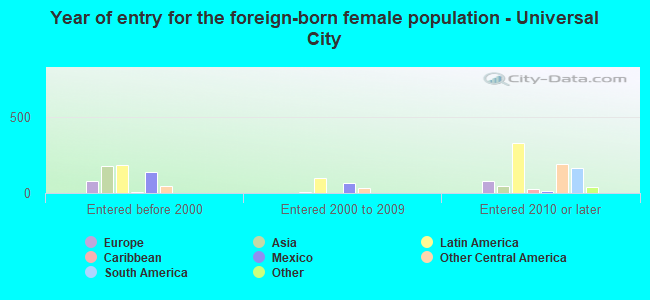
Foreign-born residents in Universal City 1,701 residents are foreign born (5.5% Latin America , 1.5% Asia , 0.9% Europe ).
This city:
8.4%Texas:
17.1%
Marital status for residents in Universal City Marital status - White (Caucasian) population 15 years and over
Males 34.4% Never married49.2% Now married0.7% Separated2.4% Widowed13.3% DivorcedFemales 21.0% Never married51.0% Now married1.3% Separated5.9% Widowed20.8% DivorcedWomen who gave birth in the past 12 months Now married:
57.4% (73)Unmarried:
42.6% (54)
Women who did not give birth in the past 12 months Now married:
38.8% (672)Unmarried:
61.2% (1,060)
Marital status - Black or African American population 15 years and over
Males 41.9% Never married38.5% Now married12.0% Separated0.0% Widowed7.5% DivorcedFemales 34.7% Never married29.3% Now married4.9% Separated8.3% Widowed22.8% DivorcedWomen who gave birth in the past 12 months Now married:
0.0% (0)Unmarried:
100.0% (10)
Women who did not give birth in the past 12 months Now married:
28.9% (145)Unmarried:
71.1% (355)
Marital status - American Indian / Alaska Native population 15 years and over
Males 0.0% Never married100.0% Now married0.0% Separated0.0% Widowed0.0% DivorcedFemales 0.0% Never married0.0% Now married0.0% Separated0.0% Widowed100.0% DivorcedMarital status - Asian population 15 years and over
Males 25.9% Never married74.1% Now married0.0% Separated0.0% Widowed0.0% DivorcedFemales 9.4% Never married76.6% Now married0.0% Separated0.0% Widowed14.0% DivorcedWomen who did not give birth in the past 12 months Now married:
50.0% (46)Unmarried:
50.0% (46)
Marital status - Native Hawaiian / Pacific Islander population 15 years and over
Males 0.0% Never married0.0% Now married0.0% Separated0.0% Widowed100.0% DivorcedFemales 100.0% Never married0.0% Now married0.0% Separated0.0% Widowed0.0% DivorcedWomen who did not give birth in the past 12 months Now married:
0.0% (0)Unmarried:
100.0% (116)
Marital status - Other race population 15 years and over
Males 46.4% Never married44.0% Now married0.0% Separated2.5% Widowed7.2% DivorcedFemales 40.9% Never married49.1% Now married0.0% Separated1.4% Widowed8.5% DivorcedWomen who gave birth in the past 12 months Now married:
0.0% (0)Unmarried:
100.0% (42)
Women who did not give birth in the past 12 months Now married:
59.4% (331)Unmarried:
40.6% (226)
Marital status - Two or more races population 15 years and over
Males 31.3% Never married40.2% Now married10.0% Separated8.2% Widowed10.4% DivorcedFemales 42.8% Never married38.1% Now married0.0% Separated3.9% Widowed15.3% DivorcedWomen who did not give birth in the past 12 months Now married:
21.6% (249)Unmarried:
78.4% (905)
Marital status - White alone, not Hispanic / Latino population 15 years and over
Males 28.5% Never married53.7% Now married1.1% Separated2.4% Widowed14.3% DivorcedFemales 20.1% Never married47.8% Now married1.6% Separated6.1% Widowed24.4% DivorcedWomen who gave birth in the past 12 months Now married:
54.8% (89)Unmarried:
45.2% (73)
Women who did not give birth in the past 12 months Now married:
36.5% (547)Unmarried:
63.5% (952)
Marital status - Hispanic or Latino population 15 years and over
Males 43.0% Never married39.5% Now married3.0% Separated3.7% Widowed10.8% DivorcedFemales 30.6% Never married52.0% Now married0.3% Separated4.5% Widowed12.5% DivorcedWomen who gave birth in the past 12 months Now married:
25.0% (10)Unmarried:
75.0% (31)
Women who did not give birth in the past 12 months Now married:
41.7% (795)Unmarried:
58.3% (1,110)
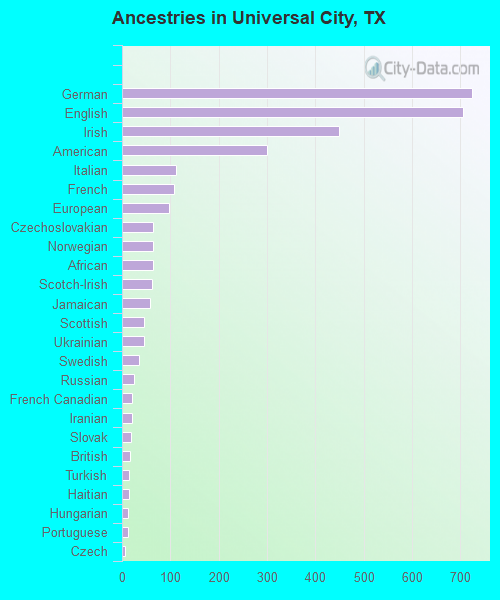
Ancestries in Universal City
723 6.9% German705 6.7% English448 4.3% Irish299 2.9% American111 1.1% Italian107 1.0% French98 0.9% European65 0.6% Czechoslovakian65 0.6% Norwegian64 0.6% African62 0.6% Scotch-Irish57 0.5% Jamaican45 0.4% Scottish45 0.4% Ukrainian36 0.3% Swedish25 0.2% Russian20 0.2% French Canadian20 0.2% Iranian19 0.2% Slovak16 0.2% British15 0.1% Turkish15 0.1% Haitian13 0.1% Hungarian13 0.1% Portuguese7 0.07% Czech
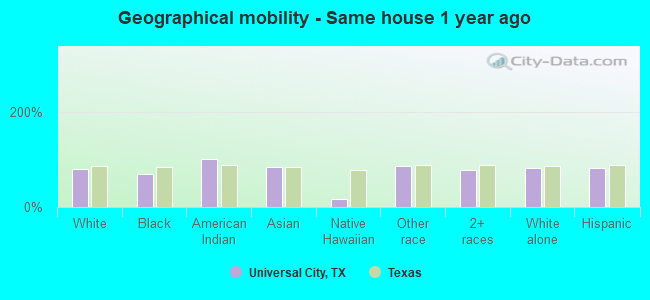
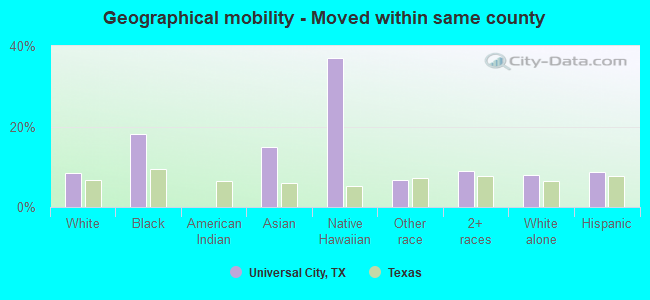
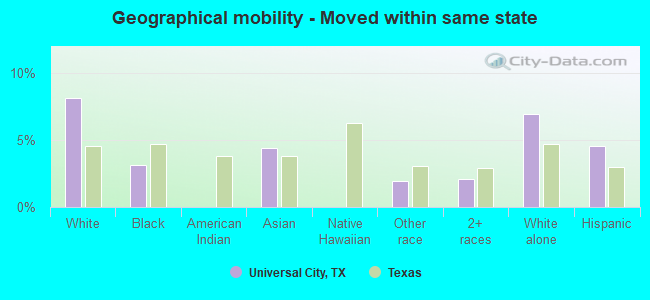
Geographical mobility in Universal City Same house 1 year ago 7,573 80.4% White (Caucasian)1,691 69.5% Black or African American44 100.0% American Indian / Alaska Native338 82.5% Asian24 16.2% Native Hawaiian / Pacific Islander1,385 84.8% Other race3,446 77.3% Two or more races6,507 80.8% White alone, not Hispanic / Latino6,652 80.9% Hispanic or LatinoMoved within same county 798 8.5% White / Caucasian440 18.1% Black or African American61 14.9% Asian54 37.0% Native Hawaiian / Pacific Islander108 6.6% Other race394 8.8% Two or more races640 7.9% White alone, not Hispanic / Latino707 8.6% Hispanic or LatinoMoved within same state 765 8.1% White / Caucasian77 3.2% Black or African American18 4.4% Asian32 2.0% Other race94 2.1% Two or more races559 6.9% White alone, not Hispanic / Latino375 4.6% Hispanic or LatinoMoved from different state 406 4.3% White / Caucasian219 9.0% Black or African American124 7.6% Other race90 2.0% Two or more races363 4.5% White alone, not Hispanic / Latino182 2.2% Hispanic or LatinoMoved from abroad 521 11.7% Two or more races365 4.4% Hispanic or Latino
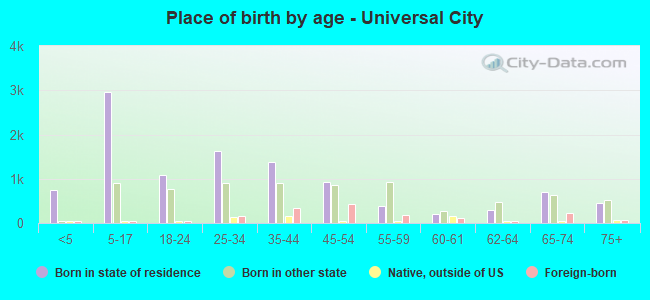
Children Nativity (place of birth) in Universal City
Children under 6 years - Living with two parents Both parents native 478 100.0% NativeOne native, one foreign-born parent 62 100.0% NativeChildren under 6 years - Living with one parent Native parent 293 100.0% NativeChildren 6 to 17 years - Living with two parents Both parents native 1,567 100.0% NativeBoth parents foreign-born 177 100.0% NativeOne native, one foreign-born parent 207 100.0% NativeChildren 6 to 17 years - Living with one parent Native parent 1,656 100.0% NativeForeign-born parent 174 53.8% Native150 46.2% Foreign-born
Grandparents responsible for own grandchildren in Universal City
Grandparents (30 to 59 years) White / Caucasian 12 100.0% Not responsible for grandchildrenBlack or African American 15 100.0% Not responsible for grandchildrenOther race 33 100.0% Not responsible for grandchildrenWhite alone, not Hispanic / Latino 19 100.0% Not responsible for grandchildrenHispanic or Latino 26 100.0% Not responsible for grandchildrenGrandparents (60 years and over) White / Caucasian 33 26.5% Responsible for grandchildren91 73.5% Not responsible for grandchildrenWhite alone, not Hispanic / Latino 15 12.3% Responsible for grandchildren105 87.7% Not responsible for grandchildrenHispanic or Latino 32 35.0% Responsible for grandchildren60 65.0% Not responsible for grandchildren