Races in University, Florida (FL) Detailed Stats
Data:
Races - White alone (%)
Races - White alone (% change since 2000)
Races - Black alone (%)
Races - Black alone (% change since 2000)
Races - American Indian alone (%)
Races - American Indian alone (% change since 2000)
Races - Asian alone (%)
Races - Asian alone (% change since 2000)
Races - Hispanic (%)
Races - Hispanic (% change since 2000)
Races - Native Hawaiian and Other Pacific Islander alone (%)
Races - Native Hawaiian and Other Pacific Islander alone (% change since 2000)
Races - Two or more races(%)
Races - Two or more races(% change since 2000)
Races - Other race alone (%)
Races - Other race alone (% change since 2000)
Racial diversity
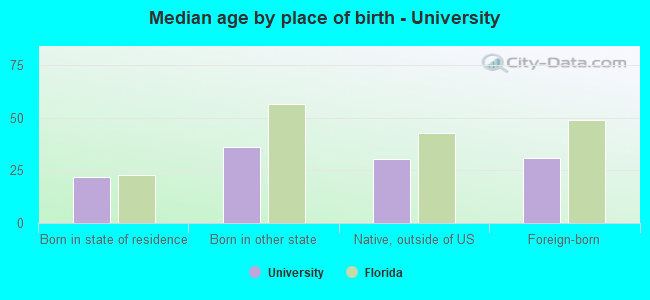
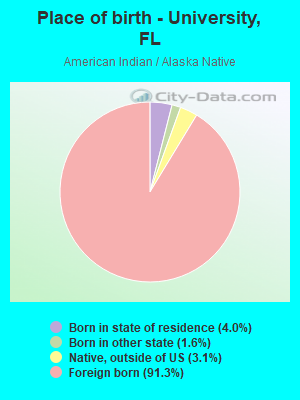
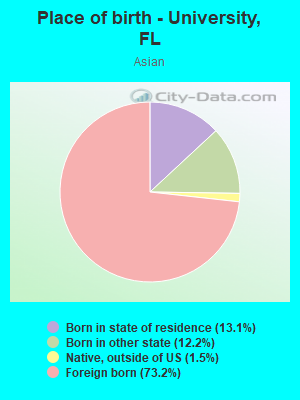
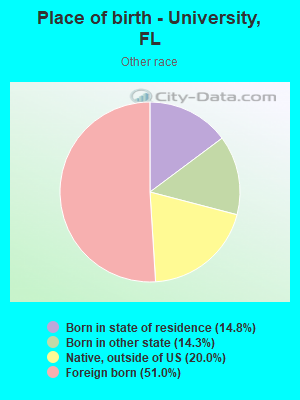
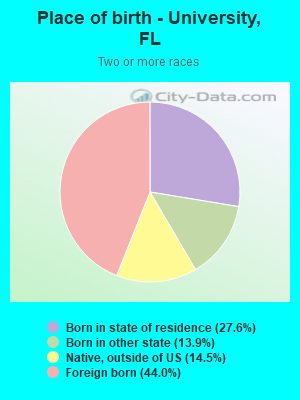
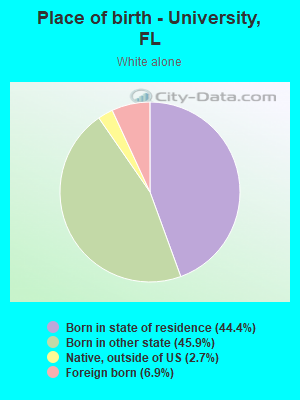
Place of birth - Born in state of residence (%)
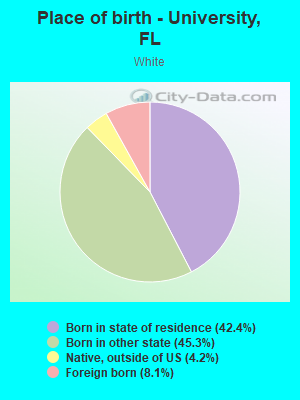
Place of birth - Born in state of residence (%) - White
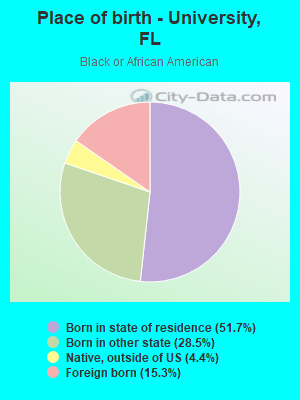
Place of birth - Born in state of residence (%) - Black or African American
Place of birth - Born in state of residence (%) - Asian
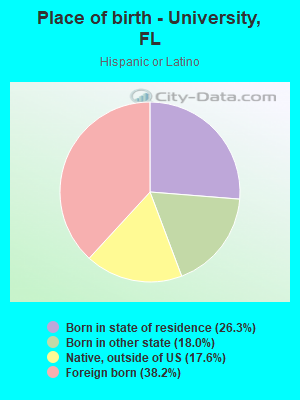
Place of birth - Born in state of residence (%) - Hispanic or Latino
Place of birth - Born in state of residence (%) - American Indian and Alaska Native
Place of birth - Born in state of residence (%) - Multirace
Place of birth - Born in state of residence (%) - Other Race
Place of birth - Born in other state (%)
Place of birth - Born in other state (%) - White
Place of birth - Born in other state (%) - Black or African American
Place of birth - Born in other state (%) - Asian
Place of birth - Born in other state (%) - Hispanic or Latino
Place of birth - Born in other state (%) - American Indian and Alaska Native
Place of birth - Born in other state (%) - Multirace
Place of birth - Born in other state (%) - Other Race
Place of birth - Native, outside of US (%)
Place of birth - Native, outside of US (%) - White
Place of birth - Native, outside of US (%) - Black or African American
Place of birth - Native, outside of US (%) - Asian
Place of birth - Native, outside of US (%) - Hispanic or Latino
Place of birth - Native, outside of US (%) - American Indian and Alaska Native
Place of birth - Native, outside of US (%) - Multirace
Place of birth - Native, outside of US (%) - Other Race
Place of birth - Foreign born (%)
Place of birth - Foreign born (%) - White
Place of birth - Foreign born (%) - Black or African American
Place of birth - Foreign born (%) - Asian
Place of birth - Foreign born (%) - Hispanic or Latino
Place of birth - Foreign born (%) - American Indian and Alaska Native
Place of birth - Foreign born (%) - Multirace
Place of birth - Foreign born (%) - Other Race
Residents speaking English at home (%)
Residents speaking English at home - Born in the United States (%)
Residents speaking English at home - Native, born elsewhere (%)
Residents speaking English at home - Foreign born (%)
Residents speaking Spanish at home (%)
Residents speaking Spanish at home - Born in the United States (%)
Residents speaking Spanish at home - Native, born elsewhere (%)
Residents speaking Spanish at home - Foreign born (%)
Residents speaking other language at home (%)
Residents speaking other language at home - Born in the United States (%)
Residents speaking other language at home - Native, born elsewhere (%)
Residents speaking other language at home - Foreign born (%)
Marital status - Never married (%)
Marital status - Now married (%)
Marital status - Separated (%)
Marital status - Widowed (%)
Marital status - Divorced (%)
Ancestries Reported - Arab (%)
Ancestries Reported - Czech (%)
Ancestries Reported - Danish (%)
Ancestries Reported - Dutch (%)
Ancestries Reported - English (%)
Ancestries Reported - French (%)
Ancestries Reported - French Canadian (%)
Ancestries Reported - German (%)
Ancestries Reported - Greek (%)
Ancestries Reported - Hungarian (%)
Ancestries Reported - Irish (%)
Ancestries Reported - Italian (%)
Ancestries Reported - Lithuanian (%)
Ancestries Reported - Norwegian (%)
Ancestries Reported - Polish (%)
Ancestries Reported - Portuguese (%)
Ancestries Reported - Russian (%)
Ancestries Reported - Scotch-Irish (%)
Ancestries Reported - Scottish (%)
Ancestries Reported - Slovak (%)
Ancestries Reported - Subsaharan African (%)
Ancestries Reported - Swedish (%)
Ancestries Reported - Swiss (%)
Ancestries Reported - Ukrainian (%)
Ancestries Reported - United States (%)
Ancestries Reported - Welsh (%)
Ancestries Reported - West Indian (%)
Ancestries Reported - Other (%)
Geographical mobility - Same house 1 year ago (%)
Geographical mobility - Same house 1 year ago (%) - White
Geographical mobility - Same house 1 year ago (%) - Black or African American
Geographical mobility - Same house 1 year ago (%) - Asian
Geographical mobility - Same house 1 year ago (%) - Hispanic or Latino
Geographical mobility - Same house 1 year ago (%) - American Indian and Alaska Native
Geographical mobility - Same house 1 year ago (%) - Multirace
Geographical mobility - Same house 1 year ago (%) - Other Race
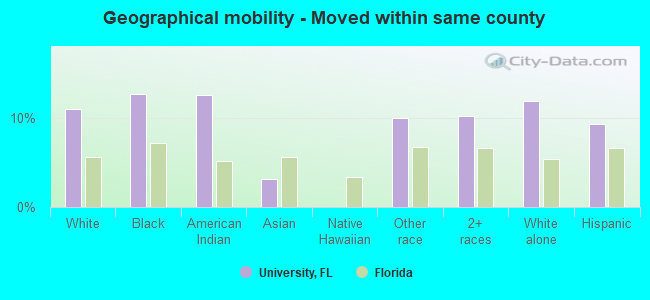
Geographical mobility - Moved within same county (%)
Geographical mobility - Moved within same county (%) - White
Geographical mobility - Moved within same county (%) - Black or African American
Geographical mobility - Moved within same county (%) - Asian
Geographical mobility - Moved within same county (%) - Hispanic or Latino
Geographical mobility - Moved within same county (%) - American Indian and Alaska Native
Geographical mobility - Moved within same county (%) - Multirace
Geographical mobility - Moved within same county (%) - Other Race
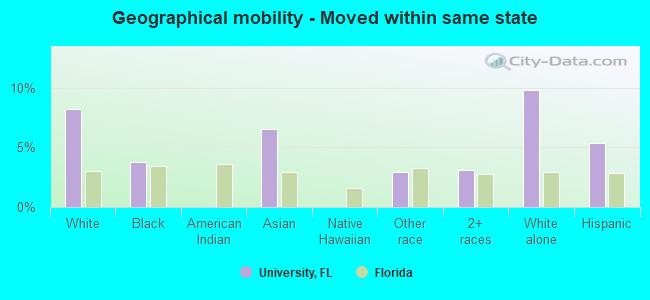
Geographical mobility - Moved from different county within same state (%)
Geographical mobility - Moved from different county within same state (%) - White
Geographical mobility - Moved from different county within same state (%) - Black or African American
Geographical mobility - Moved from different county within same state (%) - Asian
Geographical mobility - Moved from different county within same state (%) - Hispanic or Latino
Geographical mobility - Moved from different county within same state (%) - American Indian and Alaska Native
Geographical mobility - Moved from different county within same state (%) - Multirace
Geographical mobility - Moved from different county within same state (%) - Other Race
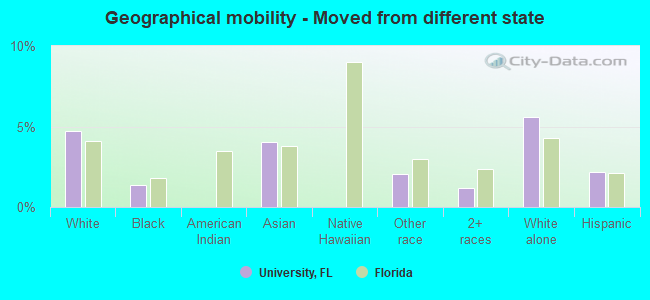
Geographical mobility - Moved from different state (%)
Geographical mobility - Moved from different state (%) - White
Geographical mobility - Moved from different state (%) - Black or African American
Geographical mobility - Moved from different state (%) - Asian
Geographical mobility - Moved from different state (%) - Hispanic or Latino
Geographical mobility - Moved from different state (%) - American Indian and Alaska Native
Geographical mobility - Moved from different state (%) - Multirace
Geographical mobility - Moved from different state (%) - Other Race
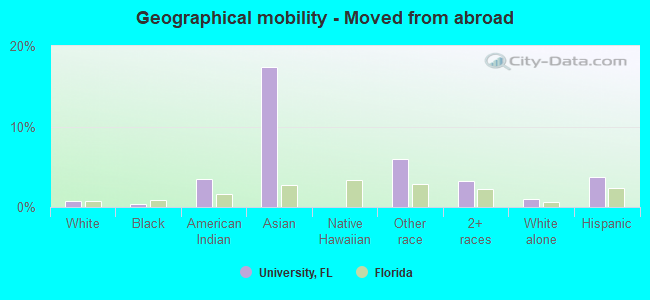
Geographical mobility - Moved from abroad (%)
Geographical mobility - Moved from abroad (%) - White
Geographical mobility - Moved from abroad (%) - Black or African American
Geographical mobility - Moved from abroad (%) - Asian
Geographical mobility - Moved from abroad (%) - Hispanic or Latino
Geographical mobility - Moved from abroad (%) - American Indian and Alaska Native
Geographical mobility - Moved from abroad (%) - Multirace
Geographical mobility - Moved from abroad (%) - Other Race
Place of birth for the foreign-born population - Ireland (%)
Place of birth for the foreign-born population - Denmark (%)
Place of birth for the foreign-born population - Norway (%)
Place of birth for the foreign-born population - Sweden (%)
Place of birth for the foreign-born population - United Kingdom (%)
Place of birth for the foreign-born population - England (%)
Place of birth for the foreign-born population - Scotland (%)
Place of birth for the foreign-born population - Other Northern Europe (%)
Place of birth for the foreign-born population - Austria (%)
Place of birth for the foreign-born population - Belgium (%)
Place of birth for the foreign-born population - France (%)
Place of birth for the foreign-born population - Germany (%)
Place of birth for the foreign-born population - Netherlands (%)
Place of birth for the foreign-born population - Switzerland (%)
Place of birth for the foreign-born population - Other Western Europe (%)
Place of birth for the foreign-born population - Greece (%)
Place of birth for the foreign-born population - Italy (%)
Place of birth for the foreign-born population - Portugal (%)
Place of birth for the foreign-born population - Spain (%)
Place of birth for the foreign-born population - Other Southern Europe (%)
Place of birth for the foreign-born population - Albania (%)
Place of birth for the foreign-born population - Belarus (%)
Place of birth for the foreign-born population - Bosnia and Herzegovina (%)
Place of birth for the foreign-born population - Bulgaria (%)
Place of birth for the foreign-born population - Croatia (%)
Place of birth for the foreign-born population - Czechoslovakia (%)
Place of birth for the foreign-born population - Hungary (%)
Place of birth for the foreign-born population - Latvia (%)
Place of birth for the foreign-born population - Lithuania (%)
Place of birth for the foreign-born population - North Macedonia (Macedonia) (%)
Place of birth for the foreign-born population - Moldova (%)
Place of birth for the foreign-born population - Poland (%)
Place of birth for the foreign-born population - Romania (%)
Place of birth for the foreign-born population - Russia (%)
Place of birth for the foreign-born population - Serbia (%)
Place of birth for the foreign-born population - Ukraine (%)
Place of birth for the foreign-born population - Other Eastern Europe (%)
Place of birth for the foreign-born population - China (%)
Place of birth for the foreign-born population - Hong Kong (%)
Place of birth for the foreign-born population - Taiwan (%)
Place of birth for the foreign-born population - Japan (%)
Place of birth for the foreign-born population - Korea (%)
Place of birth for the foreign-born population - Other Eastern Asia (%)
Place of birth for the foreign-born population - Afghanistan (%)
Place of birth for the foreign-born population - Bangladesh (%)
Place of birth for the foreign-born population - India (%)
Place of birth for the foreign-born population - Iran (%)
Place of birth for the foreign-born population - Kazakhstan (%)
Place of birth for the foreign-born population - Nepal (%)
Place of birth for the foreign-born population - Pakistan (%)
Place of birth for the foreign-born population - Sri Lanka (%)
Place of birth for the foreign-born population - Uzbekistan (%)
Place of birth for the foreign-born population - Other South Central Asia (%)
Place of birth for the foreign-born population - Burma (%)
Place of birth for the foreign-born population - Cambodia (%)
Place of birth for the foreign-born population - Indonesia (%)
Place of birth for the foreign-born population - Laos (%)
Place of birth for the foreign-born population - Malaysia (%)
Place of birth for the foreign-born population - Philippines (%)
Place of birth for the foreign-born population - Singapore (%)
Place of birth for the foreign-born population - Thailand (%)
Place of birth for the foreign-born population - Vietnam (%)
Place of birth for the foreign-born population - Other South Eastern Asia (%)
Place of birth for the foreign-born population - Armenia (%)
Place of birth for the foreign-born population - Iraq (%)
Place of birth for the foreign-born population - Israel (%)
Place of birth for the foreign-born population - Jordan (%)
Place of birth for the foreign-born population - Kuwait (%)
Place of birth for the foreign-born population - Lebanon (%)
Place of birth for the foreign-born population - Saudi Arabia (%)
Place of birth for the foreign-born population - Syria (%)
Place of birth for the foreign-born population - Turkey (%)
Place of birth for the foreign-born population - Yemen (%)
Place of birth for the foreign-born population - Other Western Asia (%)
Place of birth for the foreign-born population - Eritrea (%)
Place of birth for the foreign-born population - Ethiopia (%)
Place of birth for the foreign-born population - Kenya (%)
Place of birth for the foreign-born population - Somalia (%)
Place of birth for the foreign-born population - Uganda (%)
Place of birth for the foreign-born population - Zimbabwe (%)
Place of birth for the foreign-born population - Other Eastern Africa (%)
Place of birth for the foreign-born population - Cameroon (%)
Place of birth for the foreign-born population - Congo (%)
Place of birth for the foreign-born population - Democratic Republic of Congo (Zaire) (%)
Place of birth for the foreign-born population - Other Middle Africa (%)
Place of birth for the foreign-born population - Egypt (%)
Place of birth for the foreign-born population - Morocco (%)
Place of birth for the foreign-born population - Sudan (%)
Place of birth for the foreign-born population - Other Northern Africa (%)
Place of birth for the foreign-born population - South Africa (%)
Place of birth for the foreign-born population - Other Southern Africa (%)
Place of birth for the foreign-born population - Cabo Verde (%)
Place of birth for the foreign-born population - Ghana (%)
Place of birth for the foreign-born population - Liberia (%)
Place of birth for the foreign-born population - Nigeria (%)
Place of birth for the foreign-born population - Senegal (%)
Place of birth for the foreign-born population - Sierra Leone (%)
Place of birth for the foreign-born population - Other Western Africa (%)
Place of birth for the foreign-born population - Australia (%)
Place of birth for the foreign-born population - New Zealand (%)
Place of birth for the foreign-born population - Fiji (%)
Place of birth for the foreign-born population - Micronesia (%)
Place of birth for the foreign-born population - Bahamas (%)
Place of birth for the foreign-born population - Barbados (%)
Place of birth for the foreign-born population - Cuba (%)
Place of birth for the foreign-born population - Dominica (%)
Place of birth for the foreign-born population - Dominican Republic (%)
Place of birth for the foreign-born population - Grenada (%)
Place of birth for the foreign-born population - Haiti (%)
Place of birth for the foreign-born population - Jamaica (%)
Place of birth for the foreign-born population - St. Vincent and the Grenadines (%)
Place of birth for the foreign-born population - Trinidad and Tobago (%)
Place of birth for the foreign-born population - West Indies (%)
Place of birth for the foreign-born population - Other Caribbean (%)
Place of birth for the foreign-born population - Belize (%)
Place of birth for the foreign-born population - Costa Rica (%)
Place of birth for the foreign-born population - El Salvador (%)
Place of birth for the foreign-born population - Guatemala (%)
Place of birth for the foreign-born population - Honduras (%)
Place of birth for the foreign-born population - Mexico (%)
Place of birth for the foreign-born population - Nicaragua (%)
Place of birth for the foreign-born population - Panama (%)
Place of birth for the foreign-born population - Other Central America (%)
Place of birth for the foreign-born population - Argentina (%)
Place of birth for the foreign-born population - Bolivia (%)
Place of birth for the foreign-born population - Brazil (%)
Place of birth for the foreign-born population - Chile (%)
Place of birth for the foreign-born population - Colombia (%)
Place of birth for the foreign-born population - Ecuador (%)
Place of birth for the foreign-born population - Guyana (%)
Place of birth for the foreign-born population - Peru (%)
Place of birth for the foreign-born population - Uruguay (%)
Place of birth for the foreign-born population - Venezuela (%)
Place of birth for the foreign-born population - Other South America (%)
Place of birth for the foreign-born population - Canada (%)
Place of birth for the foreign-born population - Other Northern America (%)
Place of birth for the foreign-born population - Other (%)
Beertopia, Parrish Heritage Days, Art in the Park, Gamble Plantation Open House & more, all this weekend! (2 replies)Irish Celtic Festival, Palmetto Heritage Festival, Festival of the Arts, Paul Anka & Baseball, all this weekend! (0 replies)DeSoto Heritage Grand Parade, SRQ Comic-Con, Rowing Championships, BIG Car Show, Tattoo Expo & more, all this weekend! (1 reply)Downtown SRQ Blues Festival, Quilts on Parade, Gamble Plantation Open House, NHRA Pro Mods & more, all this weekend! (2 replies)Sarasota & Manatee Counties news thread (4615 replies)Where to rent a house (safe place): working at University of Miami (college of arts and science) (5 replies)
Latest news about races in University, FL collected exclusively by city-data.com from local newspapers, TV, and radio stations
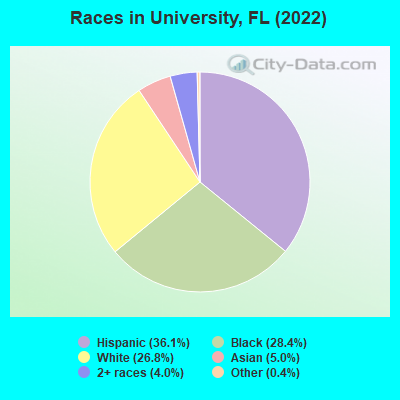
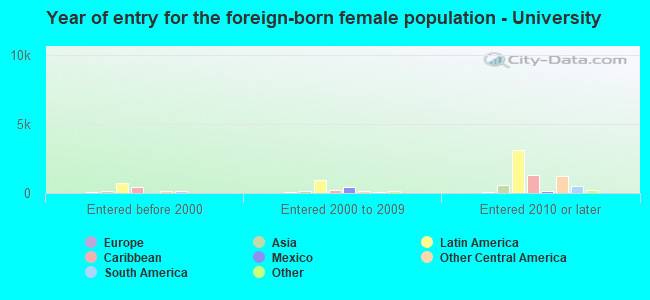
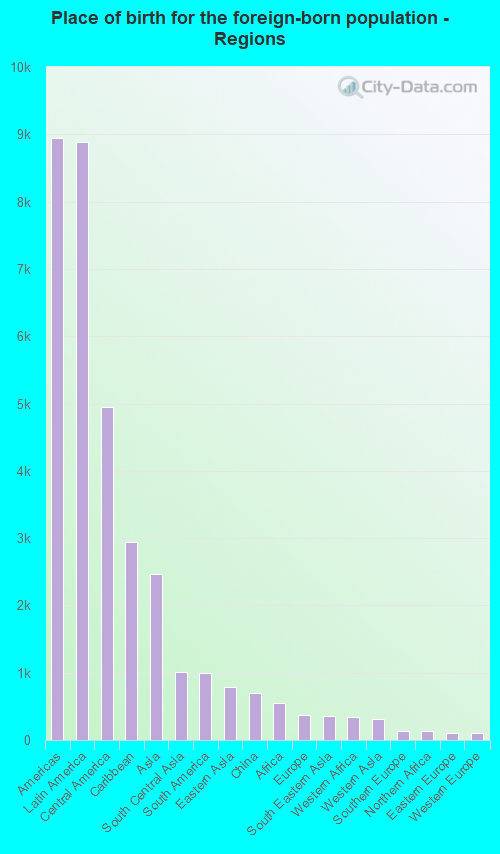
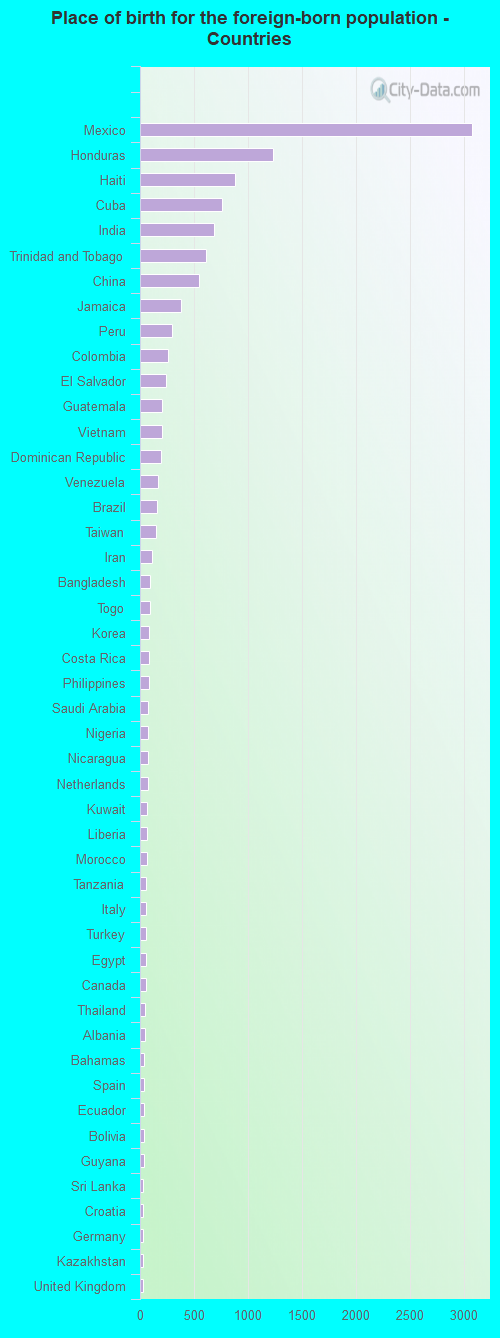
According to 2022 data, the most numerous races in University, FL are White alone (13,598 residents), Hispanic (18,302 residents), and Black alone (14,379 residents). 60.1% of University residents speak English at home. 24.4% of University, FL residents are foreign-born (17.2% born in Latin America, 4.8% born in Asia), which is 13.8% greater than the foreign-born rate of 21.0% across the entire state of Florida.
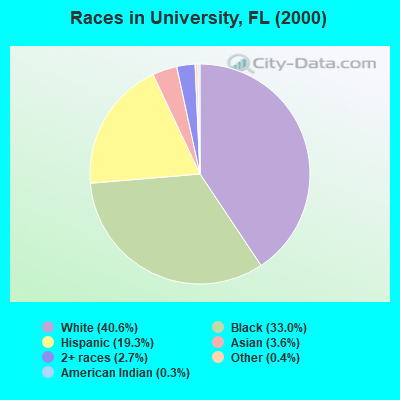
Race distribution in University
2000 2022
10,458,509 65.4% White alone 2,682,715 16.8% Hispanic 2,264,268 14.2% Black alone 261,693 1.6% Asian alone 236,954 1.5% Two or more races 42,358 0.3% American Indian alone 28,994 0.2% Other race alone 6,887 0.04% Native Hawaiian and Other
11,309,403 50.8% White alone 6,025,039 27.1% Hispanic 3,241,015 14.6% Black alone 861,630 3.9% Two or more races 623,692 2.8% Asian alone 152,054 0.7% Other race alone 22,504 0.1% American Indian alone 9,486 0.04% Native Hawaiian and Other
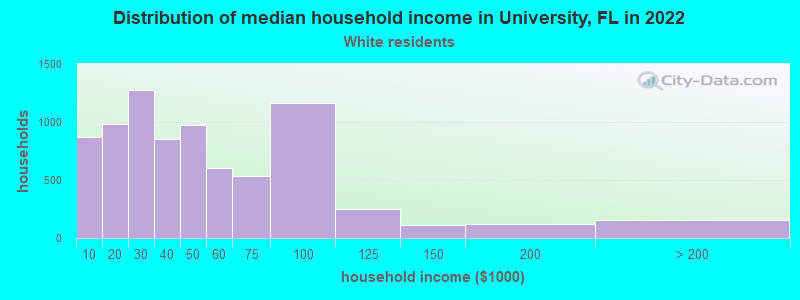
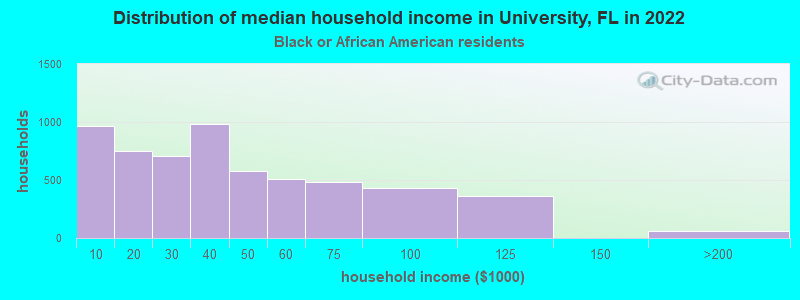
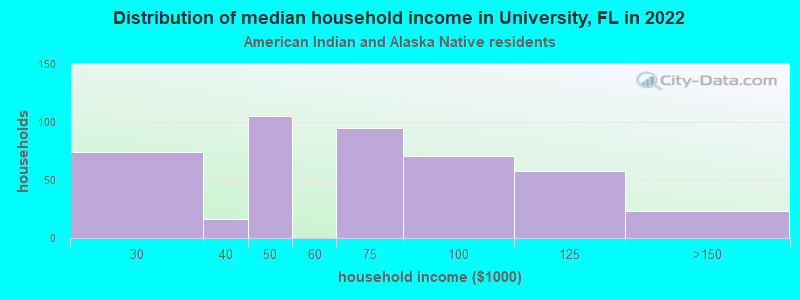
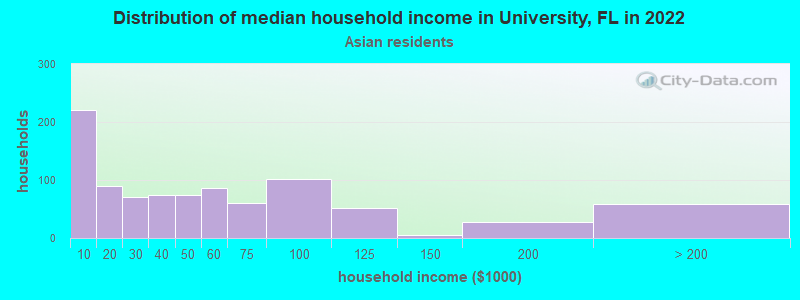
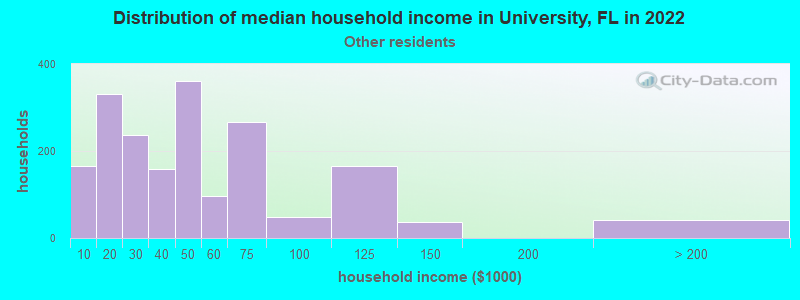
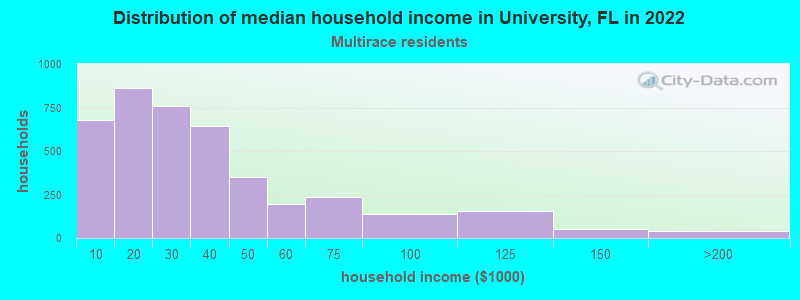
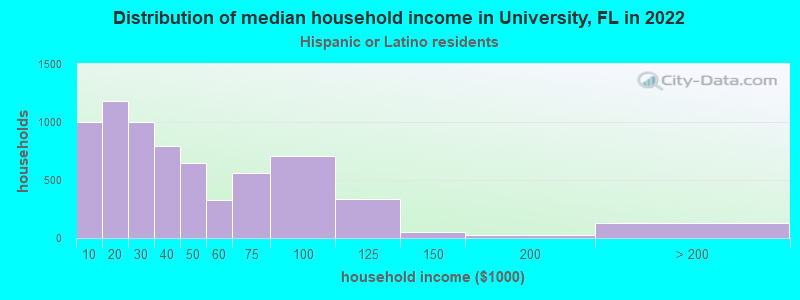
Income and house value in University Median household income in 2022 $40,530 White non-Hispanic householders$33,120 Black householders$92,987 American Indian and Alaska Native householders$43,710 Asian householders$40,988 Some other race householders$28,798 Two or more races householders$35,369 Hispanic or Latino race householdersMedian 2022 house value $234,022 White Non-Hispanic householders$215,197 Black or African American householders $308,351 Asian householders$89,259 Some other race householders$229,803 Two or more races householders$204,810 Hispanic or Latino householders
Median age by race in University
27.4 Median age for White residents25.2 30.2 27.4 Median age for Black or African American residents28.1 27.0 30.5 Median age for American Indian / Alaska Native residents31.0 26.0 28.5 Median age for Asian residents26.8 30.9 -848,484,847.6 Median age for Native Hawaiian / Pacific Islander residents-776,729,559.0 -490,118,576.6 29.1 Median age for Other race residents29.0 30.3 27.2 Median age for Two or more races residents28.6 24.3 27.1 Median age for White alone residents26.3 28.9 27.0 Median age for Hispanic or Latino residents25.2 29.3
Owner/renter occupied households by race in University
House owners and renters - White residents 1,492 18.5% Owner occupied6,552 81.5% Renter occupiedHouse owners and renters - Black or African American residents 373 6.2% Owner occupied5,643 93.8% Renter occupiedHouse owners and renters - American Indian / Alaska Native residents 17 3.6% Owner occupied447 96.4% Renter occupiedHouse owners and renters - Asian residents 340 38.7% Owner occupied539 61.3% Renter occupiedHouse owners and renters - Native Hawaiian / Pacific Islander residents 43 100.0% Renter occupiedHouse owners and renters - Other race residents 242 13.1% Owner occupied1,602 86.9% Renter occupiedHouse owners and renters - Two or more races residents 633 15.8% Owner occupied3,376 84.2% Renter occupiedHouse owners and renters - White alone residents 1,033 15.6% Owner occupied5,597 84.4% Renter occupiedHouse owners and renters - Hispanic or Latino residents 1,151 16.6% Owner occupied5,769 83.4% Renter occupied
Language usage in University
English speakers - Total 60.1% of residents of University speak English at home.
29.7% of residents speak Spanish at home 5,796 41.0% Speak English very well8,329 59.0% Speak English less than very well11.2% of residents speak other language at home 2,863 53.8% Speak English very well2,457 46.2% Speak English less than very well
English speakers - Born in the United States 84.2% of residents of University speak English at home.
13.5% of residents speak Spanish at home 1,713 87.0% Speak English very well255 13.0% Speak English less than very well2.1% of residents speak other language at home 258 83.0% Speak English very well53 17.0% Speak English less than very well
English speakers - Native, born elsewhere 17.3% of residents of University speak English at home.
79.6% of residents speak Spanish at home 1,212 41.4% Speak English very well1,714 58.6% Speak English less than very well2.1% of residents speak other language at home 41 52.6% Speak English very well37 47.4% Speak English less than very well
English speakers - Foreign-born 16.1% of residents of University speak English at home.
53.1% of residents speak Spanish at home 1,139 16.9% Speak English very well5,619 83.1% Speak English less than very well32.3% of residents speak other language at home 1,821 44.3% Speak English very well2,287 55.7% Speak English less than very well
White (Caucasian) - Speak only English Native:
84.6% (13,111)Foreign-born:
26.2% (353)
White (Caucasian) - Speak another language Native:
10.4% (1,615)Foreign-born:
72.2% (972)
Black or African American - Speak only English Native:
89.7% (10,626)Foreign-born:
31.2% (738)
Black or African American - Speak another language Native:
10.2% (1,203)Foreign-born:
69.0% (1,633)
American Indian / Alaska Native - Speak another language Native:
42.3% (45)Foreign-born:
100.0% (1,275)
Asian - Speak only English Native:
47.8% (287)Foreign-born:
15.5% (298)
Asian - Speak another language Native:
52.6% (315)Foreign-born:
84.5% (1,621)
Other race - Speak only English Native:
17.8% (379)Foreign-born:
7.1% (180)
Other race - Speak another language Native:
81.1% (1,726)Foreign-born:
92.7% (2,368)
Two or more races - Speak only English Native:
36.1% (1,912)Foreign-born:
12.8% (593)
Two or more races - Speak another language Native:
65.6% (3,478)Foreign-born:
84.9% (3,926)
White alone - Speak only English Native:
95.6% (11,666)Foreign-born:
26.1% (238)
White alone - Speak another language Native:
4.3% (521)Foreign-born:
72.7% (663)
Hispanic or Latino - Speak only English Native:
33.8% (3,446)Foreign-born:
4.6% (317)
Hispanic or Latino - Speak another language Native:
64.5% (6,581)Foreign-born:
95.4% (6,548)
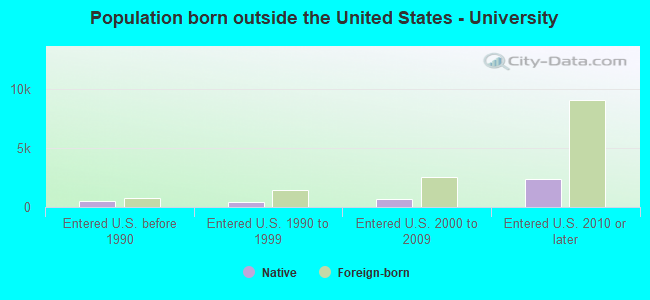
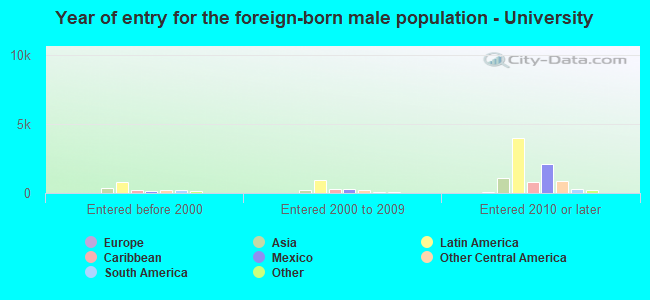
Foreign-born residents in University 12,338 residents are foreign born (17.2% Latin America , 4.8% Asia ).
This city:
24.4%Florida:
21.1%
Marital status for residents in University Marital status - White (Caucasian) population 15 years and over
Males 65.9% Never married18.9% Now married1.9% Separated2.5% Widowed10.8% DivorcedFemales 56.6% Never married18.5% Now married1.5% Separated9.4% Widowed13.9% DivorcedWomen who gave birth in the past 12 months Now married:
46.6% (105)Unmarried:
53.4% (120)
Women who did not give birth in the past 12 months Now married:
17.6% (941)Unmarried:
82.4% (4,413)
Marital status - Black or African American population 15 years and over
Males 65.6% Never married16.9% Now married3.6% Separated1.9% Widowed12.1% DivorcedFemales 68.5% Never married10.4% Now married6.3% Separated7.4% Widowed7.4% DivorcedWomen who gave birth in the past 12 months Now married:
9.3% (45)Unmarried:
90.7% (440)
Women who did not give birth in the past 12 months Now married:
14.9% (751)Unmarried:
85.1% (4,276)
Marital status - American Indian / Alaska Native population 15 years and over
Males 36.2% Never married63.8% Now married0.0% Separated0.0% Widowed0.0% DivorcedFemales 39.1% Never married57.1% Now married0.0% Separated3.7% Widowed0.0% DivorcedWomen who gave birth in the past 12 months Now married:
100.0% (66)Unmarried:
0.0% (0)
Women who did not give birth in the past 12 months Now married:
41.1% (88)Unmarried:
58.9% (127)
Marital status - Asian population 15 years and over
Males 67.8% Never married25.9% Now married0.0% Separated3.2% Widowed3.1% DivorcedFemales 39.9% Never married56.2% Now married1.9% Separated2.0% Widowed0.0% DivorcedWomen who gave birth in the past 12 months Now married:
100.0% (17)Unmarried:
0.0% (0)
Women who did not give birth in the past 12 months Now married:
48.6% (288)Unmarried:
51.4% (305)
Marital status - Other race population 15 years and over
Males 70.3% Never married23.3% Now married2.9% Separated0.0% Widowed3.5% DivorcedFemales 49.8% Never married23.9% Now married2.7% Separated4.0% Widowed19.6% DivorcedWomen who gave birth in the past 12 months Now married:
100.0% (36)Unmarried:
0.0% (0)
Women who did not give birth in the past 12 months Now married:
23.1% (331)Unmarried:
76.9% (1,102)
Marital status - Two or more races population 15 years and over
Males 63.7% Never married26.5% Now married3.4% Separated0.0% Widowed6.5% DivorcedFemales 56.6% Never married22.5% Now married3.6% Separated4.0% Widowed13.2% DivorcedWomen who gave birth in the past 12 months Now married:
0.0% (0)Unmarried:
100.0% (179)
Women who did not give birth in the past 12 months Now married:
24.8% (693)Unmarried:
75.2% (2,100)
Marital status - White alone, not Hispanic / Latino population 15 years and over
Males 69.1% Never married14.0% Now married0.8% Separated3.1% Widowed12.9% DivorcedFemales 56.9% Never married15.1% Now married1.1% Separated11.7% Widowed15.3% DivorcedWomen who gave birth in the past 12 months Now married:
59.1% (110)Unmarried:
40.9% (76)
Women who did not give birth in the past 12 months Now married:
13.7% (605)Unmarried:
86.3% (3,803)
Marital status - Hispanic or Latino population 15 years and over
Males 63.2% Never married29.3% Now married2.9% Separated0.4% Widowed4.2% DivorcedFemales 53.7% Never married25.0% Now married3.0% Separated4.1% Widowed14.2% DivorcedWomen who gave birth in the past 12 months Now married:
31.2% (75)Unmarried:
68.8% (165)
Women who did not give birth in the past 12 months Now married:
26.7% (1,242)Unmarried:
73.3% (3,408)
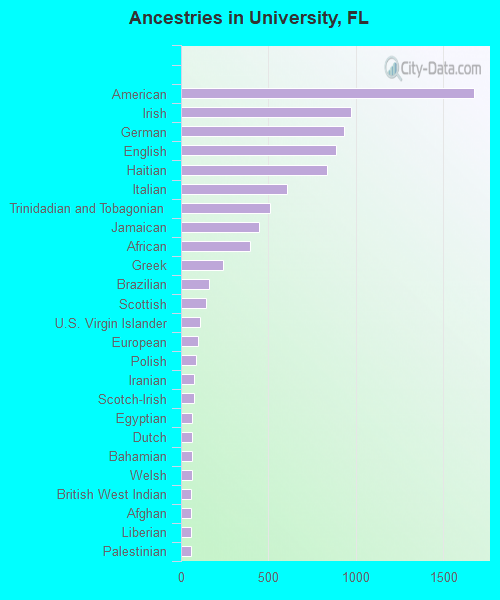
Ancestries in University
1,678 4.9% American975 2.9% Irish933 2.7% German888 2.6% English837 2.5% Haitian604 1.8% Italian507 1.5% Trinidadian and Tobagonian444 1.3% Jamaican394 1.2% African239 0.7% Greek158 0.5% Brazilian141 0.4% Scottish111 0.3% U.S. Virgin Islander98 0.3% European88 0.3% Polish74 0.2% Iranian72 0.2% Scotch-Irish65 0.2% Egyptian65 0.2% Dutch62 0.2% Bahamian61 0.2% Welsh60 0.2% British West Indian59 0.2% Afghan57 0.2% Liberian55 0.2% Palestinian55 0.2% Canadian48 0.1% Czechoslovakian48 0.1% French42 0.1% Russian36 0.1% Turkish36 0.1% Albanian35 0.1% Danish34 0.10% Iraqi33 0.10% Guyanese26 0.08% Nigerian24 0.07% French Canadian23 0.07% Senegalese23 0.07% West Indian21 0.06% Israeli19 0.06% Celtic18 0.05% South African15 0.04% Cape Verdean12 0.04% Croatian10 0.03% Jordanian10 0.03% Belizean9 0.03% Norwegian6 0.02% Moroccan
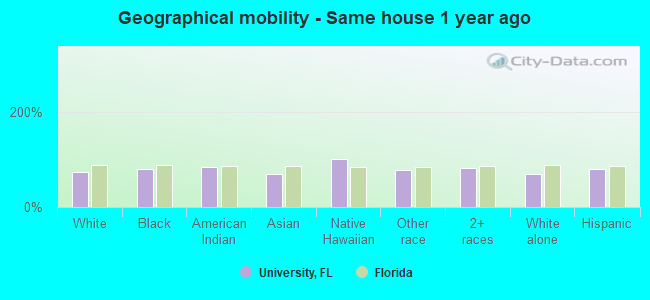
Geographical mobility in University Same house 1 year ago 13,009 73.0% White (Caucasian)11,842 79.1% Black or African American890 83.7% American Indian / Alaska Native1,842 70.2% Asian39 100.0% Native Hawaiian / Pacific Islander3,798 78.1% Other race8,472 82.2% Two or more races9,373 69.2% White alone, not Hispanic / Latino14,482 79.9% Hispanic or LatinoMoved within same county 1,942 10.9% White / Caucasian1,890 12.6% Black or African American134 12.6% American Indian / Alaska Native84 3.2% Asian485 10.0% Other race1,054 10.2% Two or more races1,597 11.8% White alone, not Hispanic / Latino1,683 9.3% Hispanic or LatinoMoved within same state 1,461 8.2% White / Caucasian567 3.8% Black or African American172 6.5% Asian141 2.9% Other race323 3.1% Two or more races1,324 9.8% White alone, not Hispanic / Latino968 5.3% Hispanic or LatinoMoved from different state 845 4.7% White / Caucasian209 1.4% Black or African American106 4.0% Asian100 2.1% Other race122 1.2% Two or more races757 5.6% White alone, not Hispanic / Latino398 2.2% Hispanic or LatinoMoved from abroad 132 0.7% White58 0.4% Black or African American37 3.5% American Indian / Alaska Native456 17.4% Asian288 5.9% Other race333 3.2% Two or more races140 1.0% White alone, not Hispanic / Latino671 3.7% Hispanic or Latino
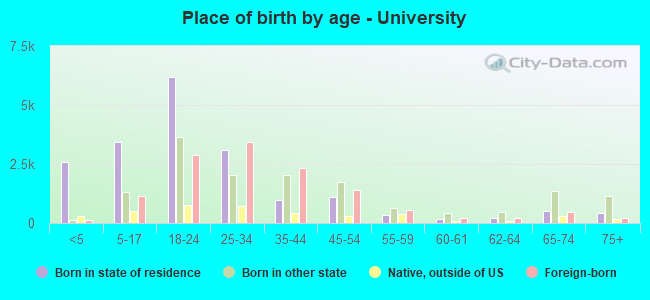
Children Nativity (place of birth) in University
Children under 6 years - Living with two parents Both parents native 521 100.0% NativeBoth parents foreign-born 421 91.8% Native38 8.2% Foreign-bornOne native, one foreign-born parent 91 100.0% NativeChildren under 6 years - Living with one parent Native parent 1,404 100.0% NativeForeign-born parent 543 81.6% Native123 18.4% Foreign-bornChildren 6 to 17 years - Living with two parents Both parents native 848 100.0% NativeBoth parents foreign-born 714 73.2% Native261 26.8% Foreign-bornOne native, one foreign-born parent 53 100.0% NativeChildren 6 to 17 years - Living with one parent Native parent 1,708 87.8% Native237 12.2% Foreign-bornForeign-born parent 1,035 68.2% Native483 31.8% Foreign-born
Grandparents responsible for own grandchildren in University
Grandparents (30 to 59 years) White / Caucasian 16 8.0% Responsible for grandchildren184 92.0% Not responsible for grandchildrenBlack or African American 199 82.6% Responsible for grandchildren42 17.4% Not responsible for grandchildrenAsian 117 100.0% Not responsible for grandchildrenTwo or more races 110 100.0% Not responsible for grandchildrenWhite alone, not Hispanic / Latino 10 17.9% Responsible for grandchildren46 82.1% Not responsible for grandchildrenHispanic or Latino 71 25.6% Responsible for grandchildren205 74.4% Not responsible for grandchildrenGrandparents (60 years and over) White / Caucasian 158 57.7% Responsible for grandchildren116 42.3% Not responsible for grandchildrenBlack or African American 23 73.3% Responsible for grandchildren9 26.7% Not responsible for grandchildrenTwo or more races 18 16.2% Responsible for grandchildren92 83.8% Not responsible for grandchildrenWhite alone, not Hispanic / Latino 142 93.1% Responsible for grandchildren11 6.9% Not responsible for grandchildrenHispanic or Latino 31 11.7% Responsible for grandchildren231 88.3% Not responsible for grandchildren