Races in University Park, Texas (TX) Detailed Stats
Data:
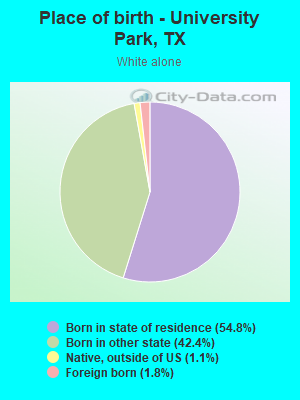
Races - White alone (%)
Races - White alone (% change since 2000)
Races - Black alone (%)
Races - Black alone (% change since 2000)
Races - American Indian alone (%)
Races - American Indian alone (% change since 2000)
Races - Asian alone (%)
Races - Asian alone (% change since 2000)
Races - Hispanic (%)
Races - Hispanic (% change since 2000)
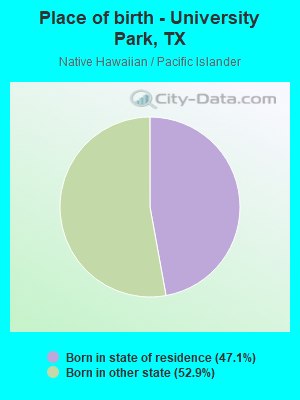
Races - Native Hawaiian and Other Pacific Islander alone (%)
Races - Native Hawaiian and Other Pacific Islander alone (% change since 2000)
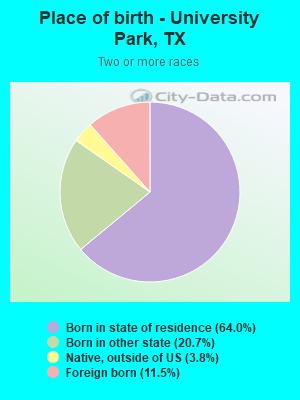
Races - Two or more races(%)
Races - Two or more races(% change since 2000)
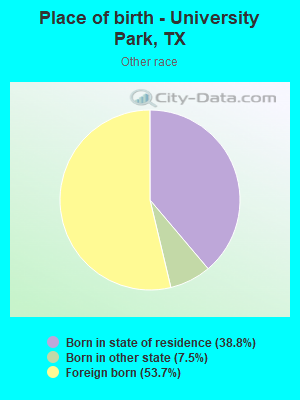
Races - Other race alone (%)
Races - Other race alone (% change since 2000)
Racial diversity
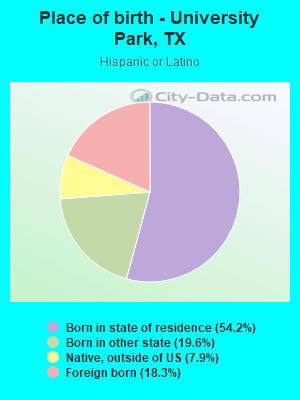
Place of birth - Born in state of residence (%)
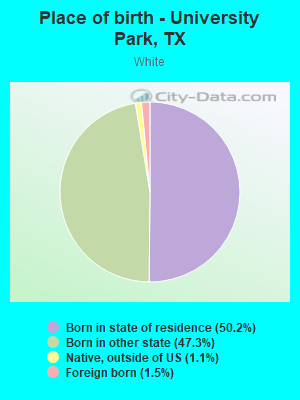
Place of birth - Born in state of residence (%) - White
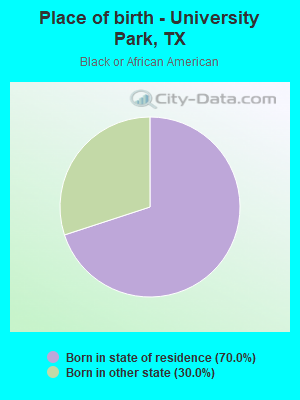
Place of birth - Born in state of residence (%) - Black or African American
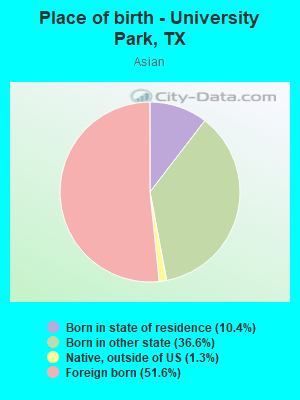
Place of birth - Born in state of residence (%) - Asian
Place of birth - Born in state of residence (%) - Hispanic or Latino
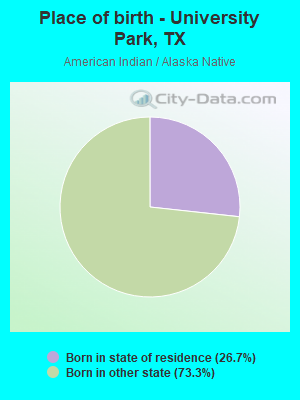
Place of birth - Born in state of residence (%) - American Indian and Alaska Native
Place of birth - Born in state of residence (%) - Multirace
Place of birth - Born in state of residence (%) - Other Race
Place of birth - Born in other state (%)
Place of birth - Born in other state (%) - White
Place of birth - Born in other state (%) - Black or African American
Place of birth - Born in other state (%) - Asian
Place of birth - Born in other state (%) - Hispanic or Latino
Place of birth - Born in other state (%) - American Indian and Alaska Native
Place of birth - Born in other state (%) - Multirace
Place of birth - Born in other state (%) - Other Race
Place of birth - Native, outside of US (%)
Place of birth - Native, outside of US (%) - White
Place of birth - Native, outside of US (%) - Black or African American
Place of birth - Native, outside of US (%) - Asian
Place of birth - Native, outside of US (%) - Hispanic or Latino
Place of birth - Native, outside of US (%) - American Indian and Alaska Native
Place of birth - Native, outside of US (%) - Multirace
Place of birth - Native, outside of US (%) - Other Race
Place of birth - Foreign born (%)
Place of birth - Foreign born (%) - White
Place of birth - Foreign born (%) - Black or African American
Place of birth - Foreign born (%) - Asian
Place of birth - Foreign born (%) - Hispanic or Latino
Place of birth - Foreign born (%) - American Indian and Alaska Native
Place of birth - Foreign born (%) - Multirace
Place of birth - Foreign born (%) - Other Race
Residents speaking English at home (%)
Residents speaking English at home - Born in the United States (%)
Residents speaking English at home - Native, born elsewhere (%)
Residents speaking English at home - Foreign born (%)
Residents speaking Spanish at home (%)
Residents speaking Spanish at home - Born in the United States (%)
Residents speaking Spanish at home - Native, born elsewhere (%)
Residents speaking Spanish at home - Foreign born (%)
Residents speaking other language at home (%)
Residents speaking other language at home - Born in the United States (%)
Residents speaking other language at home - Native, born elsewhere (%)
Residents speaking other language at home - Foreign born (%)
Marital status - Never married (%)
Marital status - Now married (%)
Marital status - Separated (%)
Marital status - Widowed (%)
Marital status - Divorced (%)
Ancestries Reported - Arab (%)
Ancestries Reported - Czech (%)
Ancestries Reported - Danish (%)
Ancestries Reported - Dutch (%)
Ancestries Reported - English (%)
Ancestries Reported - French (%)
Ancestries Reported - French Canadian (%)
Ancestries Reported - German (%)
Ancestries Reported - Greek (%)
Ancestries Reported - Hungarian (%)
Ancestries Reported - Irish (%)
Ancestries Reported - Italian (%)
Ancestries Reported - Lithuanian (%)
Ancestries Reported - Norwegian (%)
Ancestries Reported - Polish (%)
Ancestries Reported - Portuguese (%)
Ancestries Reported - Russian (%)
Ancestries Reported - Scotch-Irish (%)
Ancestries Reported - Scottish (%)
Ancestries Reported - Slovak (%)
Ancestries Reported - Subsaharan African (%)
Ancestries Reported - Swedish (%)
Ancestries Reported - Swiss (%)
Ancestries Reported - Ukrainian (%)
Ancestries Reported - United States (%)
Ancestries Reported - Welsh (%)
Ancestries Reported - West Indian (%)
Ancestries Reported - Other (%)
Geographical mobility - Same house 1 year ago (%)
Geographical mobility - Same house 1 year ago (%) - White
Geographical mobility - Same house 1 year ago (%) - Black or African American
Geographical mobility - Same house 1 year ago (%) - Asian
Geographical mobility - Same house 1 year ago (%) - Hispanic or Latino
Geographical mobility - Same house 1 year ago (%) - American Indian and Alaska Native
Geographical mobility - Same house 1 year ago (%) - Multirace
Geographical mobility - Same house 1 year ago (%) - Other Race
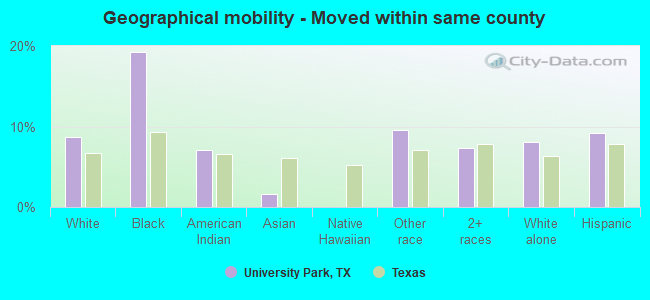
Geographical mobility - Moved within same county (%)
Geographical mobility - Moved within same county (%) - White
Geographical mobility - Moved within same county (%) - Black or African American
Geographical mobility - Moved within same county (%) - Asian
Geographical mobility - Moved within same county (%) - Hispanic or Latino
Geographical mobility - Moved within same county (%) - American Indian and Alaska Native
Geographical mobility - Moved within same county (%) - Multirace
Geographical mobility - Moved within same county (%) - Other Race
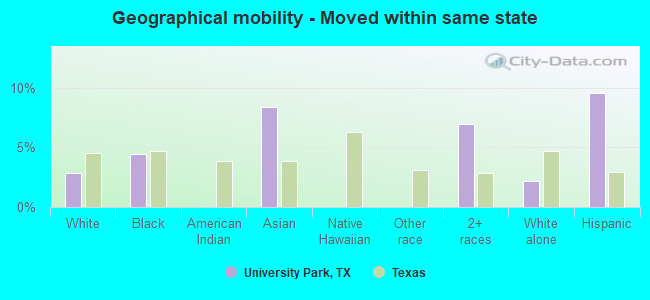
Geographical mobility - Moved from different county within same state (%)
Geographical mobility - Moved from different county within same state (%) - White
Geographical mobility - Moved from different county within same state (%) - Black or African American
Geographical mobility - Moved from different county within same state (%) - Asian
Geographical mobility - Moved from different county within same state (%) - Hispanic or Latino
Geographical mobility - Moved from different county within same state (%) - American Indian and Alaska Native
Geographical mobility - Moved from different county within same state (%) - Multirace
Geographical mobility - Moved from different county within same state (%) - Other Race
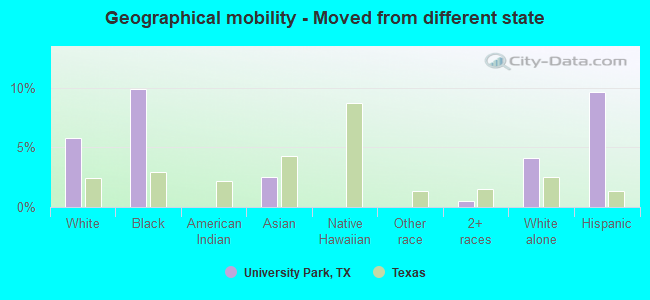
Geographical mobility - Moved from different state (%)
Geographical mobility - Moved from different state (%) - White
Geographical mobility - Moved from different state (%) - Black or African American
Geographical mobility - Moved from different state (%) - Asian
Geographical mobility - Moved from different state (%) - Hispanic or Latino
Geographical mobility - Moved from different state (%) - American Indian and Alaska Native
Geographical mobility - Moved from different state (%) - Multirace
Geographical mobility - Moved from different state (%) - Other Race
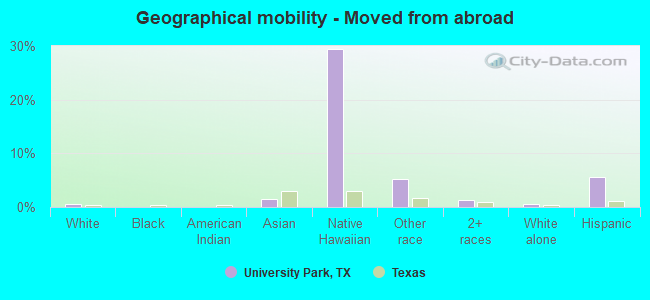
Geographical mobility - Moved from abroad (%)
Geographical mobility - Moved from abroad (%) - White
Geographical mobility - Moved from abroad (%) - Black or African American
Geographical mobility - Moved from abroad (%) - Asian
Geographical mobility - Moved from abroad (%) - Hispanic or Latino
Geographical mobility - Moved from abroad (%) - American Indian and Alaska Native
Geographical mobility - Moved from abroad (%) - Multirace
Geographical mobility - Moved from abroad (%) - Other Race
Place of birth for the foreign-born population - Ireland (%)
Place of birth for the foreign-born population - Denmark (%)
Place of birth for the foreign-born population - Norway (%)
Place of birth for the foreign-born population - Sweden (%)
Place of birth for the foreign-born population - United Kingdom (%)
Place of birth for the foreign-born population - England (%)
Place of birth for the foreign-born population - Scotland (%)
Place of birth for the foreign-born population - Other Northern Europe (%)
Place of birth for the foreign-born population - Austria (%)
Place of birth for the foreign-born population - Belgium (%)
Place of birth for the foreign-born population - France (%)
Place of birth for the foreign-born population - Germany (%)
Place of birth for the foreign-born population - Netherlands (%)
Place of birth for the foreign-born population - Switzerland (%)
Place of birth for the foreign-born population - Other Western Europe (%)
Place of birth for the foreign-born population - Greece (%)
Place of birth for the foreign-born population - Italy (%)
Place of birth for the foreign-born population - Portugal (%)
Place of birth for the foreign-born population - Spain (%)
Place of birth for the foreign-born population - Other Southern Europe (%)
Place of birth for the foreign-born population - Albania (%)
Place of birth for the foreign-born population - Belarus (%)
Place of birth for the foreign-born population - Bosnia and Herzegovina (%)
Place of birth for the foreign-born population - Bulgaria (%)
Place of birth for the foreign-born population - Croatia (%)
Place of birth for the foreign-born population - Czechoslovakia (%)
Place of birth for the foreign-born population - Hungary (%)
Place of birth for the foreign-born population - Latvia (%)
Place of birth for the foreign-born population - Lithuania (%)
Place of birth for the foreign-born population - North Macedonia (Macedonia) (%)
Place of birth for the foreign-born population - Moldova (%)
Place of birth for the foreign-born population - Poland (%)
Place of birth for the foreign-born population - Romania (%)
Place of birth for the foreign-born population - Russia (%)
Place of birth for the foreign-born population - Serbia (%)
Place of birth for the foreign-born population - Ukraine (%)
Place of birth for the foreign-born population - Other Eastern Europe (%)
Place of birth for the foreign-born population - China (%)
Place of birth for the foreign-born population - Hong Kong (%)
Place of birth for the foreign-born population - Taiwan (%)
Place of birth for the foreign-born population - Japan (%)
Place of birth for the foreign-born population - Korea (%)
Place of birth for the foreign-born population - Other Eastern Asia (%)
Place of birth for the foreign-born population - Afghanistan (%)
Place of birth for the foreign-born population - Bangladesh (%)
Place of birth for the foreign-born population - India (%)
Place of birth for the foreign-born population - Iran (%)
Place of birth for the foreign-born population - Kazakhstan (%)
Place of birth for the foreign-born population - Nepal (%)
Place of birth for the foreign-born population - Pakistan (%)
Place of birth for the foreign-born population - Sri Lanka (%)
Place of birth for the foreign-born population - Uzbekistan (%)
Place of birth for the foreign-born population - Other South Central Asia (%)
Place of birth for the foreign-born population - Burma (%)
Place of birth for the foreign-born population - Cambodia (%)
Place of birth for the foreign-born population - Indonesia (%)
Place of birth for the foreign-born population - Laos (%)
Place of birth for the foreign-born population - Malaysia (%)
Place of birth for the foreign-born population - Philippines (%)
Place of birth for the foreign-born population - Singapore (%)
Place of birth for the foreign-born population - Thailand (%)
Place of birth for the foreign-born population - Vietnam (%)
Place of birth for the foreign-born population - Other South Eastern Asia (%)
Place of birth for the foreign-born population - Armenia (%)
Place of birth for the foreign-born population - Iraq (%)
Place of birth for the foreign-born population - Israel (%)
Place of birth for the foreign-born population - Jordan (%)
Place of birth for the foreign-born population - Kuwait (%)
Place of birth for the foreign-born population - Lebanon (%)
Place of birth for the foreign-born population - Saudi Arabia (%)
Place of birth for the foreign-born population - Syria (%)
Place of birth for the foreign-born population - Turkey (%)
Place of birth for the foreign-born population - Yemen (%)
Place of birth for the foreign-born population - Other Western Asia (%)
Place of birth for the foreign-born population - Eritrea (%)
Place of birth for the foreign-born population - Ethiopia (%)
Place of birth for the foreign-born population - Kenya (%)
Place of birth for the foreign-born population - Somalia (%)
Place of birth for the foreign-born population - Uganda (%)
Place of birth for the foreign-born population - Zimbabwe (%)
Place of birth for the foreign-born population - Other Eastern Africa (%)
Place of birth for the foreign-born population - Cameroon (%)
Place of birth for the foreign-born population - Congo (%)
Place of birth for the foreign-born population - Democratic Republic of Congo (Zaire) (%)
Place of birth for the foreign-born population - Other Middle Africa (%)
Place of birth for the foreign-born population - Egypt (%)
Place of birth for the foreign-born population - Morocco (%)
Place of birth for the foreign-born population - Sudan (%)
Place of birth for the foreign-born population - Other Northern Africa (%)
Place of birth for the foreign-born population - South Africa (%)
Place of birth for the foreign-born population - Other Southern Africa (%)
Place of birth for the foreign-born population - Cabo Verde (%)
Place of birth for the foreign-born population - Ghana (%)
Place of birth for the foreign-born population - Liberia (%)
Place of birth for the foreign-born population - Nigeria (%)
Place of birth for the foreign-born population - Senegal (%)
Place of birth for the foreign-born population - Sierra Leone (%)
Place of birth for the foreign-born population - Other Western Africa (%)
Place of birth for the foreign-born population - Australia (%)
Place of birth for the foreign-born population - New Zealand (%)
Place of birth for the foreign-born population - Fiji (%)
Place of birth for the foreign-born population - Micronesia (%)
Place of birth for the foreign-born population - Bahamas (%)
Place of birth for the foreign-born population - Barbados (%)
Place of birth for the foreign-born population - Cuba (%)
Place of birth for the foreign-born population - Dominica (%)
Place of birth for the foreign-born population - Dominican Republic (%)
Place of birth for the foreign-born population - Grenada (%)
Place of birth for the foreign-born population - Haiti (%)
Place of birth for the foreign-born population - Jamaica (%)
Place of birth for the foreign-born population - St. Vincent and the Grenadines (%)
Place of birth for the foreign-born population - Trinidad and Tobago (%)
Place of birth for the foreign-born population - West Indies (%)
Place of birth for the foreign-born population - Other Caribbean (%)
Place of birth for the foreign-born population - Belize (%)
Place of birth for the foreign-born population - Costa Rica (%)
Place of birth for the foreign-born population - El Salvador (%)
Place of birth for the foreign-born population - Guatemala (%)
Place of birth for the foreign-born population - Honduras (%)
Place of birth for the foreign-born population - Mexico (%)
Place of birth for the foreign-born population - Nicaragua (%)
Place of birth for the foreign-born population - Panama (%)
Place of birth for the foreign-born population - Other Central America (%)
Place of birth for the foreign-born population - Argentina (%)
Place of birth for the foreign-born population - Bolivia (%)
Place of birth for the foreign-born population - Brazil (%)
Place of birth for the foreign-born population - Chile (%)
Place of birth for the foreign-born population - Colombia (%)
Place of birth for the foreign-born population - Ecuador (%)
Place of birth for the foreign-born population - Guyana (%)
Place of birth for the foreign-born population - Peru (%)
Place of birth for the foreign-born population - Uruguay (%)
Place of birth for the foreign-born population - Venezuela (%)
Place of birth for the foreign-born population - Other South America (%)
Place of birth for the foreign-born population - Canada (%)
Place of birth for the foreign-born population - Other Northern America (%)
Place of birth for the foreign-born population - Other (%)
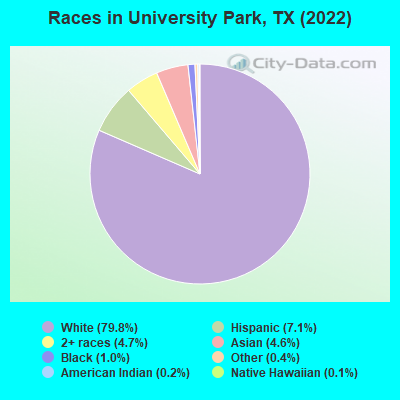
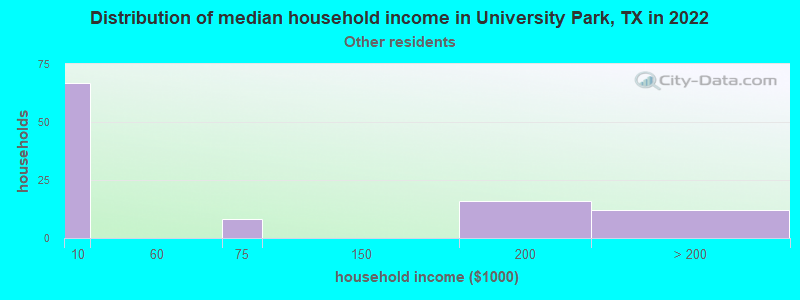
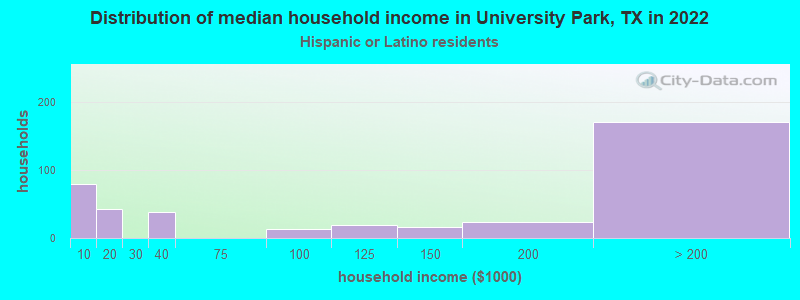
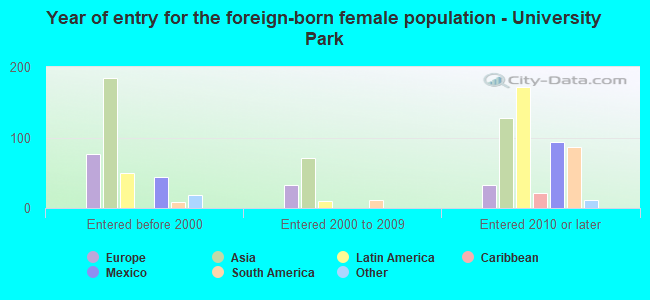
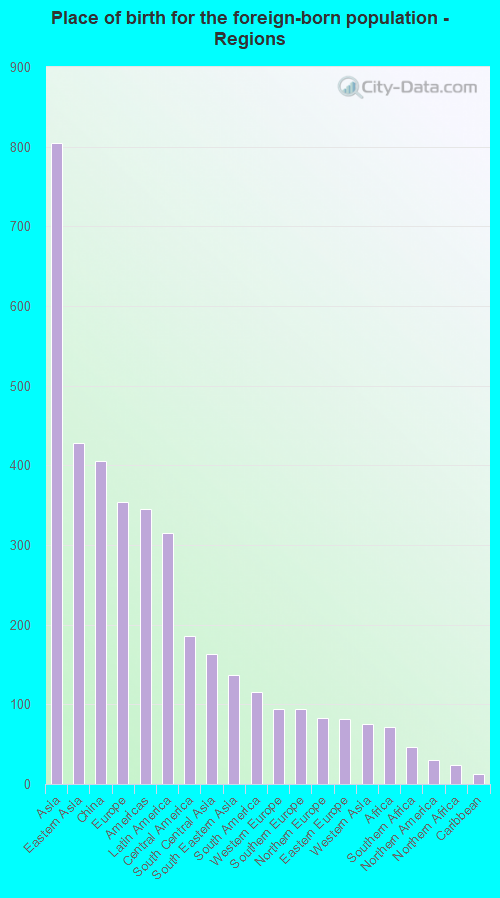
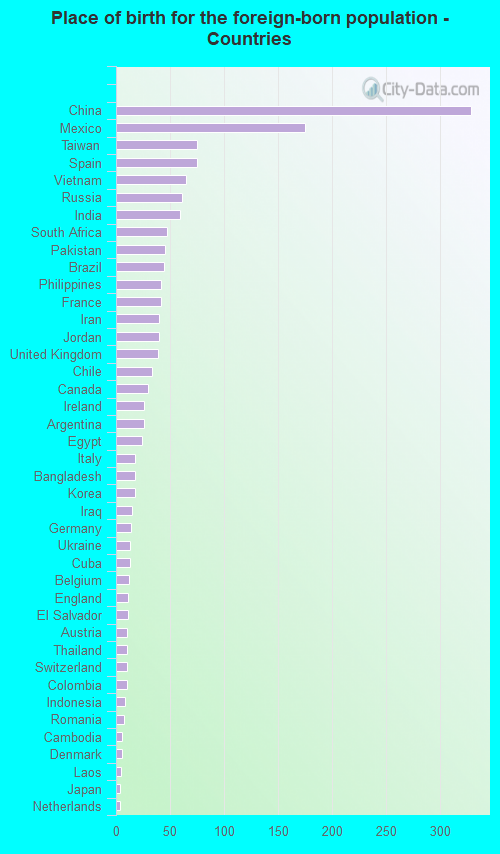
According to 2022 data, the most numerous races in University Park, TX are Hispanic (1,777 residents), White alone (20,069 residents), and Black alone (244 residents). 91.0% of University Park residents speak English at home. 6.3% of University Park, TX residents are foreign-born (3.1% born in Asia, 1.4% born in Europe, 1.2% born in Latin America), which is 170.8% less than the foreign-born rate of 17.0% across the entire state of Texas.
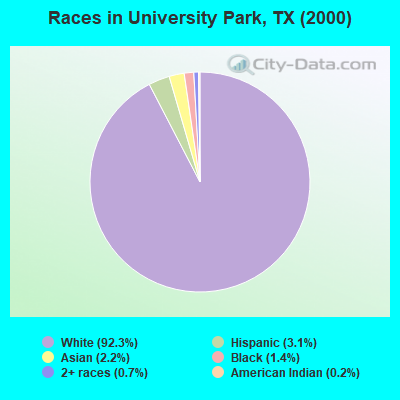
Race distribution in University Park
2000 2022
10,933,313 52.4% White alone 6,669,666 32.0% Hispanic 2,364,255 11.3% Black alone 554,445 2.7% Asian alone 230,567 1.1% Two or more races 68,859 0.3% American Indian alone 19,958 0.10% Other race alone 10,757 0.05% Native Hawaiian and Other
12,070,642 40.2% Hispanic 11,683,430 38.9% White alone 3,508,706 11.7% Black alone 1,608,173 5.4% Asian alone 956,560 3.2% Two or more races 125,763 0.4% Other race alone 47,023 0.2% American Indian alone 29,275 0.10% Native Hawaiian and Other
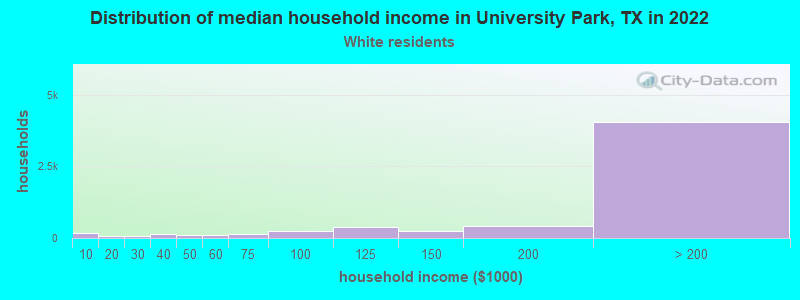
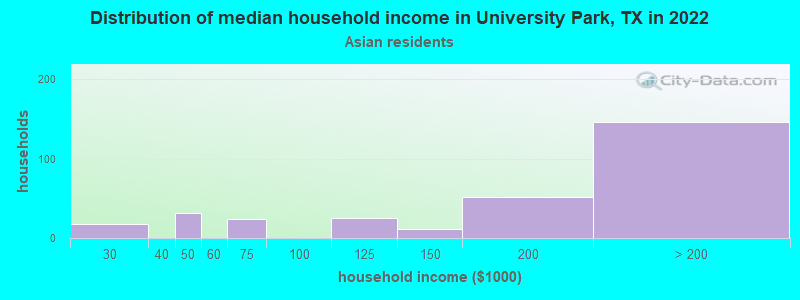
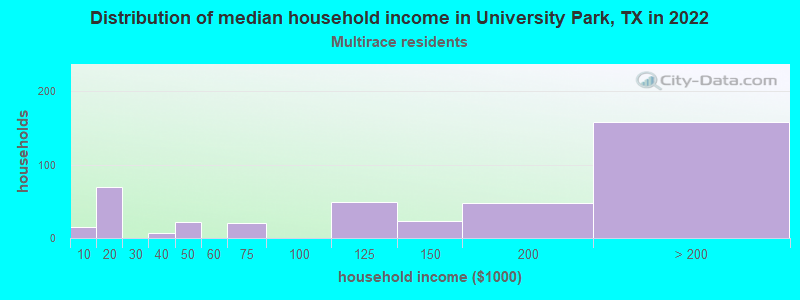
Income and house value in University Park Median household income in 2022 over $200,000 White non-Hispanic householders$198,769 Asian householders$2,715 Some other race householders$165,955 Two or more races householdersMedian 2022 house value over $1,000,000 White Non-Hispanic householders$325,073 American Indian or Alaska Native householders over $1,000,000 Asian householdersover $1,000,000 Some other race householdersover $1,000,000 Two or more races householdersover $1,000,000 Hispanic or Latino householders
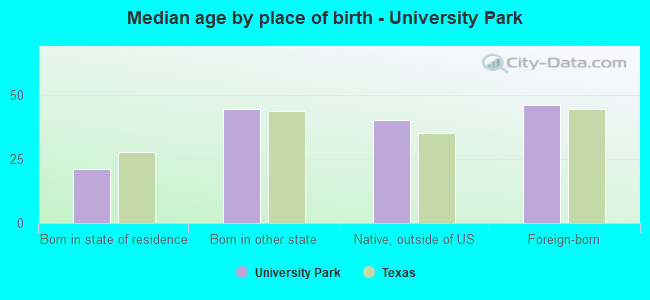
Median age by race in University Park
38.1 Median age for White residents37.7 38.5 20.3 Median age for Black or African American residents20.0 20.9 36.7 Median age for American Indian / Alaska Native residents69.0 40.3 40.0 Median age for Asian residents22.1 42.1 15.5 Median age for Native Hawaiian / Pacific Islander residents15.4 -464,594,127.3 20.9 Median age for Other race residents20.2 20.7 18.6 Median age for Two or more races residents18.6 18.2 36.0 Median age for White alone residents35.8 36.0 20.3 Median age for Hispanic or Latino residents21.4 20.0
Owner/renter occupied households by race in University Park
House owners and renters - White residents 4,839 86.0% Owner occupied786 14.0% Renter occupiedHouse owners and renters - Black or African American residents 10 100.0% Owner occupiedHouse owners and renters - American Indian / Alaska Native residents 9 100.0% Owner occupiedHouse owners and renters - Asian residents 190 65.3% Owner occupied101 34.7% Renter occupiedHouse owners and renters - Other race residents 28 29.1% Owner occupied68 70.9% Renter occupiedHouse owners and renters - Two or more races residents 305 72.0% Owner occupied119 28.0% Renter occupiedHouse owners and renters - White alone residents 5,543 85.8% Owner occupied914 14.2% Renter occupiedHouse owners and renters - Hispanic or Latino residents 203 55.9% Owner occupied160 44.1% Renter occupied
Language usage in University Park
English speakers - Total 91.0% of residents of University Park speak English at home.
3.8% of residents speak Spanish at home 835 91.4% Speak English very well79 8.6% Speak English less than very well5.8% of residents speak other language at home 1,203 86.9% Speak English very well182 13.1% Speak English less than very well
English speakers - Born in the United States 93.8% of residents of University Park speak English at home.
1.7% of residents speak Spanish at home 152 91.0% Speak English very well15 9.0% Speak English less than very well2.9% of residents speak other language at home 256 88.9% Speak English very well32 11.1% Speak English less than very well
English speakers - Native, born elsewhere 71.0% of residents of University Park speak English at home.
14.2% of residents speak Spanish at home 51 100.0% Speak English very well22.0% of residents speak other language at home 79 100.0% Speak English very well
English speakers - Foreign-born 25.1% of residents of University Park speak English at home.
20.5% of residents speak Spanish at home 286 93.2% Speak English very well21 6.8% Speak English less than very well58.0% of residents speak other language at home 722 83.0% Speak English very well148 17.0% Speak English less than very well
White (Caucasian) - Speak only English Native:
100.0% (16,220)Foreign-born:
48.7% (131)
White (Caucasian) - Speak another language Native:
1.6% (264)Foreign-born:
61.8% (166)
Asian - Speak only English Native:
54.3% (294)Foreign-born:
19.4% (123)
Asian - Speak another language Native:
44.5% (241)Foreign-born:
80.2% (508)
Other race - Speak only English Native:
53.1% (51)Foreign-born:
12.6% (23)
Other race - Speak another language Native:
47.5% (46)Foreign-born:
87.3% (162)
Two or more races - Speak only English Native:
76.0% (1,620)Foreign-born:
32.7% (98)
Two or more races - Speak another language Native:
17.6% (376)Foreign-born:
70.8% (211)
White alone - Speak only English Native:
99.2% (18,506)Foreign-born:
39.8% (142)
White alone - Speak another language Native:
1.4% (256)Foreign-born:
60.4% (215)
Hispanic or Latino - Speak only English Native:
61.2% (816)Foreign-born:
8.3% (27)
Hispanic or Latino - Speak another language Native:
40.4% (539)Foreign-born:
92.7% (307)
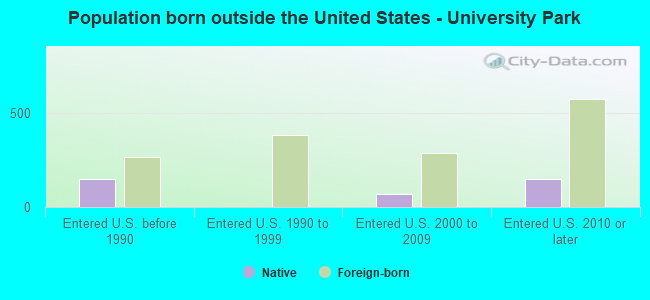
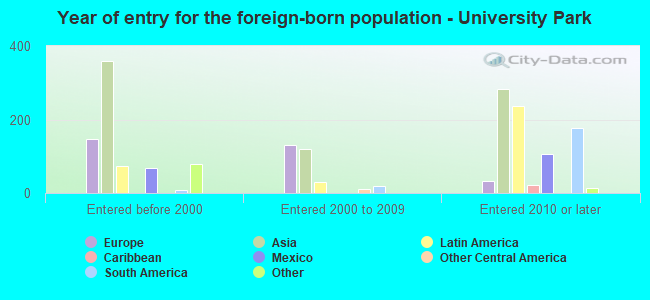
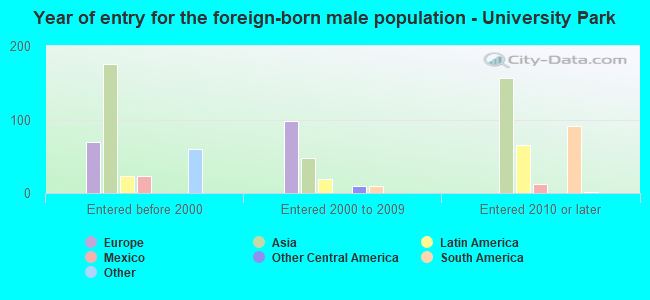
Foreign-born residents in University Park 1,579 residents are foreign born (3.1% Asia , 1.4% Europe , 1.2% Latin America ).
This city:
6.3%Texas:
17.1%
Marital status for residents in University Park Marital status - White (Caucasian) population 15 years and over
Males 32.4% Never married63.0% Now married0.5% Separated1.3% Widowed2.9% DivorcedFemales 31.5% Never married57.1% Now married0.5% Separated2.6% Widowed8.3% DivorcedWomen who gave birth in the past 12 months Now married:
100.0% (191)Unmarried:
0.0% (0)
Women who did not give birth in the past 12 months Now married:
44.6% (1,622)Unmarried:
55.4% (2,017)
Marital status - Black or African American population 15 years and over
Males 100.0% Never married0.0% Now married0.0% Separated0.0% Widowed0.0% DivorcedFemales 91.5% Never married8.5% Now married0.0% Separated0.0% Widowed0.0% DivorcedWomen who did not give birth in the past 12 months Now married:
0.0% (0)Unmarried:
100.0% (105)
Marital status - American Indian / Alaska Native population 15 years and over
Males 0.0% Never married100.0% Now married0.0% Separated0.0% Widowed0.0% DivorcedFemales 14.3% Never married85.7% Now married0.0% Separated0.0% Widowed0.0% DivorcedWomen who did not give birth in the past 12 months Now married:
85.7% (46)Unmarried:
14.3% (8)
Marital status - Asian population 15 years and over
Males 33.6% Never married66.1% Now married0.0% Separated0.2% Widowed0.0% DivorcedFemales 34.1% Never married62.7% Now married0.0% Separated0.9% Widowed2.3% DivorcedWomen who gave birth in the past 12 months Now married:
100.0% (15)Unmarried:
0.0% (0)
Women who did not give birth in the past 12 months Now married:
43.6% (150)Unmarried:
56.4% (194)
Marital status - Native Hawaiian / Pacific Islander population 15 years and over
Males 100.0% Never married0.0% Now married0.0% Separated0.0% Widowed0.0% DivorcedFemales 100.0% Never married0.0% Now married0.0% Separated0.0% Widowed0.0% DivorcedWomen who did not give birth in the past 12 months Now married:
0.0% (0)Unmarried:
100.0% (6)
Marital status - Other race population 15 years and over
Males 51.2% Never married48.8% Now married0.0% Separated0.0% Widowed0.0% DivorcedFemales 75.5% Never married17.0% Now married0.0% Separated0.0% Widowed7.5% DivorcedWomen who gave birth in the past 12 months Now married:
100.0% (20)Unmarried:
0.0% (0)
Women who did not give birth in the past 12 months Now married:
3.2% (6)Unmarried:
96.8% (179)
Marital status - Two or more races population 15 years and over
Males 47.8% Never married50.5% Now married0.0% Separated0.0% Widowed1.7% DivorcedFemales 64.1% Never married21.9% Now married0.0% Separated0.0% Widowed13.9% DivorcedWomen who did not give birth in the past 12 months Now married:
16.8% (134)Unmarried:
83.2% (664)
Marital status - White alone, not Hispanic / Latino population 15 years and over
Males 30.7% Never married64.5% Now married0.5% Separated1.3% Widowed3.0% DivorcedFemales 29.9% Never married58.8% Now married0.5% Separated2.6% Widowed8.2% DivorcedWomen who gave birth in the past 12 months Now married:
100.0% (255)Unmarried:
0.0% (0)
Women who did not give birth in the past 12 months Now married:
46.7% (2,241)Unmarried:
53.3% (2,556)
Marital status - Hispanic or Latino population 15 years and over
Males 65.2% Never married34.8% Now married0.0% Separated0.0% Widowed0.0% DivorcedFemales 71.2% Never married20.3% Now married0.0% Separated1.1% Widowed7.4% DivorcedWomen who gave birth in the past 12 months Now married:
100.0% (21)Unmarried:
0.0% (0)
Women who did not give birth in the past 12 months Now married:
8.3% (58)Unmarried:
91.7% (637)
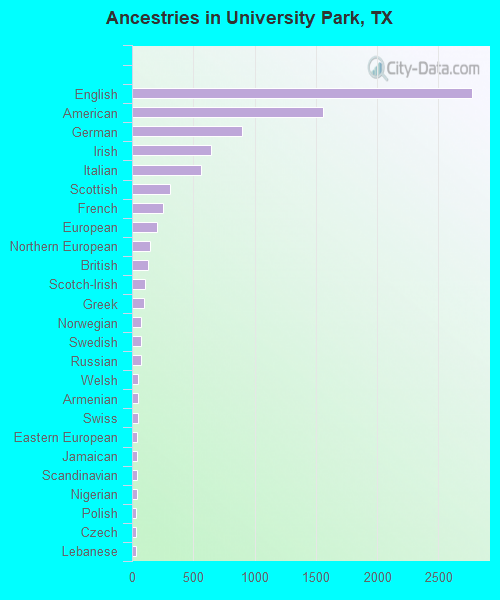
Ancestries in University Park
2,775 24.6% English1,559 13.8% American898 7.9% German645 5.7% Irish566 5.0% Italian307 2.7% Scottish252 2.2% French206 1.8% European149 1.3% Northern European127 1.1% British110 1.0% Scotch-Irish98 0.9% Greek77 0.7% Norwegian75 0.7% Swedish70 0.6% Russian50 0.4% Welsh49 0.4% Armenian47 0.4% Swiss44 0.4% Eastern European44 0.4% Jamaican41 0.4% Scandinavian37 0.3% Nigerian36 0.3% Polish34 0.3% Czech32 0.3% Lebanese31 0.3% Iranian28 0.2% Jordanian27 0.2% Dutch23 0.2% Palestinian21 0.2% Brazilian20 0.2% Turkish19 0.2% Cajun18 0.2% Slavic17 0.2% Afghan16 0.1% Austrian15 0.1% Israeli14 0.1% Belgian11 0.10% Egyptian9 0.08% French Canadian8 0.07% Hungarian8 0.07% Romanian7 0.06% Ukrainian6 0.05% Iraqi3 0.03% Danish3 0.03% Czechoslovakian2 0.02% Yugoslavian
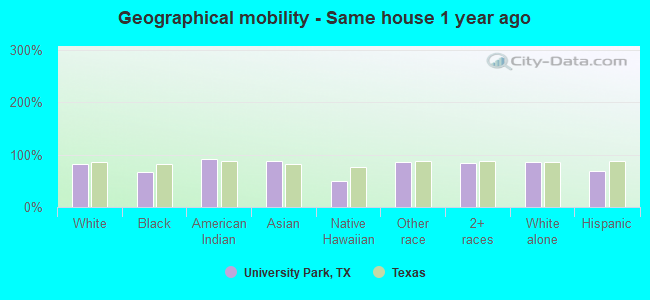
Geographical mobility in University Park Same house 1 year ago 12,863 82.9% White (Caucasian)166 67.5% Black or African American78 91.2% American Indian / Alaska Native1,018 88.5% Asian18 49.1% Native Hawaiian / Pacific Islander273 84.9% Other race2,207 83.9% Two or more races16,957 85.3% White alone, not Hispanic / Latino1,188 68.0% Hispanic or LatinoMoved within same county 1,352 8.7% White / Caucasian47 19.3% Black or African American6 7.1% American Indian / Alaska Native19 1.6% Asian31 9.5% Other race194 7.4% Two or more races1,595 8.0% White alone, not Hispanic / Latino160 9.2% Hispanic or LatinoMoved within same state 448 2.9% White / Caucasian11 4.5% Black or African American96 8.4% Asian183 7.0% Two or more races442 2.2% White alone, not Hispanic / Latino166 9.5% Hispanic or LatinoMoved from different state 896 5.8% White / Caucasian24 9.9% Black or African American29 2.5% Asian13 0.5% Two or more races822 4.1% White alone, not Hispanic / Latino169 9.7% Hispanic or LatinoMoved from abroad 92 0.6% White16 1.4% Asian11 29.5% Native Hawaiian / Pacific Islander17 5.3% Other race34 1.3% Two or more races99 0.5% White alone, not Hispanic / Latino99 5.7% Hispanic or Latino
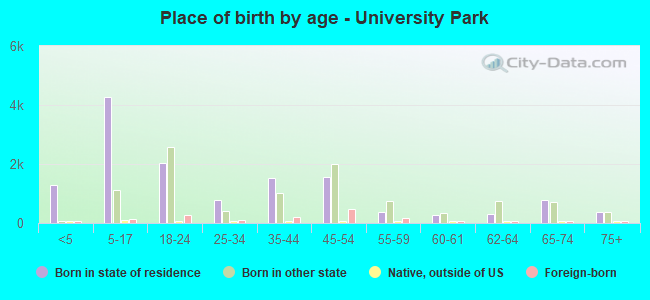
Children Nativity (place of birth) in University Park
Children under 6 years - Living with two parents Both parents native 1,521 100.0% NativeBoth parents foreign-born 45 100.0% NativeOne native, one foreign-born parent 172 100.0% NativeChildren under 6 years - Living with one parent Native parent 104 100.0% NativeChildren 6 to 17 years - Living with two parents Both parents native 3,727 99.3% Native27 0.7% Foreign-bornBoth parents foreign-born 98 46.9% Native111 53.1% Foreign-bornOne native, one foreign-born parent 260 100.0% NativeChildren 6 to 17 years - Living with one parent Native parent 741 100.0% NativeForeign-born parent 99 50.7% Native96 49.3% Foreign-born
Grandparents responsible for own grandchildren in University Park
Grandparents (30 to 59 years) White / Caucasian 33 100.0% Not responsible for grandchildrenWhite alone, not Hispanic / Latino 43 100.0% Not responsible for grandchildren
Grandparents (60 years and over) White / Caucasian 59 100.0% Not responsible for grandchildrenWhite alone, not Hispanic / Latino 112 100.0% Not responsible for grandchildren