Races in University Place, Washington (WA) Detailed Stats
Data:
Races - White alone (%)
Races - White alone (% change since 2000)
Races - Black alone (%)
Races - Black alone (% change since 2000)
Races - American Indian alone (%)
Races - American Indian alone (% change since 2000)
Races - Asian alone (%)
Races - Asian alone (% change since 2000)
Races - Hispanic (%)
Races - Hispanic (% change since 2000)
Races - Native Hawaiian and Other Pacific Islander alone (%)
Races - Native Hawaiian and Other Pacific Islander alone (% change since 2000)
Races - Two or more races(%)
Races - Two or more races(% change since 2000)
Races - Other race alone (%)
Races - Other race alone (% change since 2000)
Racial diversity
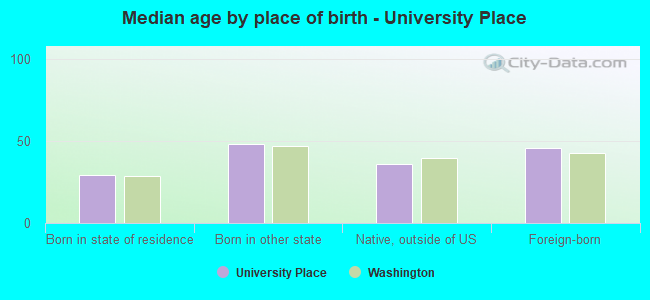
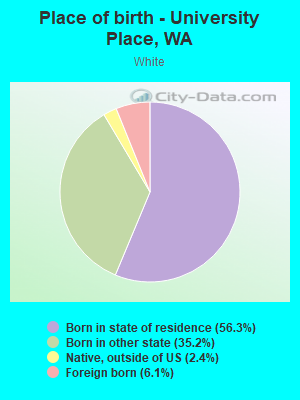
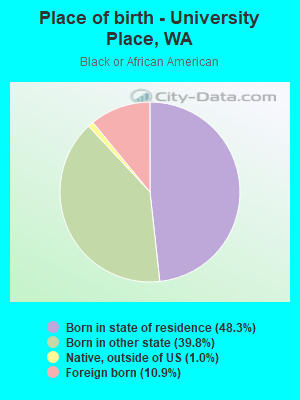
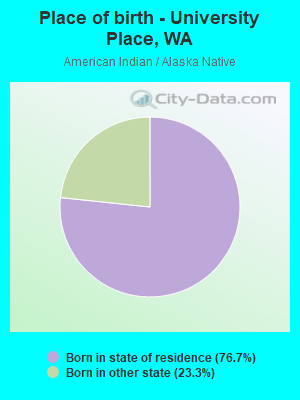
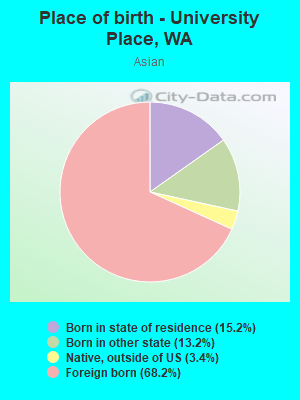
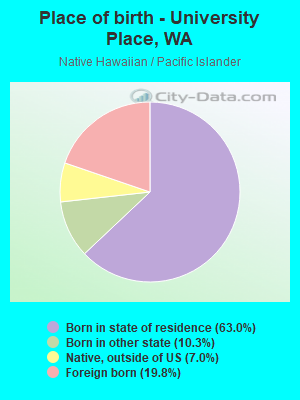
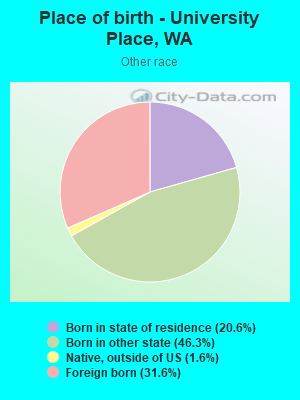
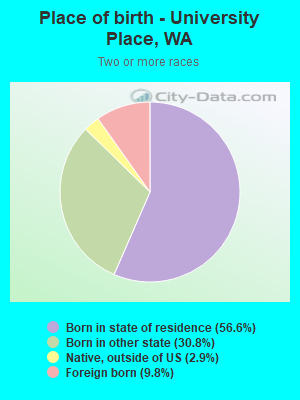
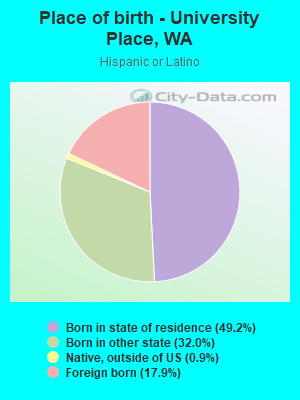
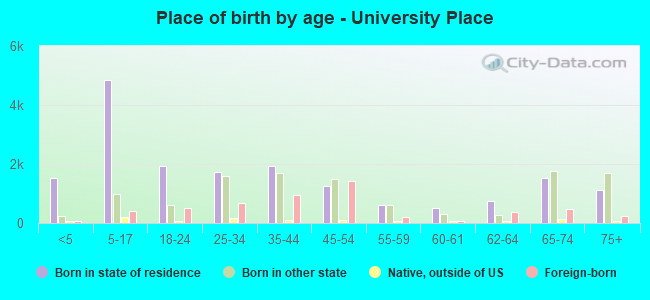
Place of birth - Born in state of residence (%)
Place of birth - Born in state of residence (%) - White
Place of birth - Born in state of residence (%) - Black or African American
Place of birth - Born in state of residence (%) - Asian
Place of birth - Born in state of residence (%) - Hispanic or Latino
Place of birth - Born in state of residence (%) - American Indian and Alaska Native
Place of birth - Born in state of residence (%) - Multirace
Place of birth - Born in state of residence (%) - Other Race
Place of birth - Born in other state (%)
Place of birth - Born in other state (%) - White
Place of birth - Born in other state (%) - Black or African American
Place of birth - Born in other state (%) - Asian
Place of birth - Born in other state (%) - Hispanic or Latino
Place of birth - Born in other state (%) - American Indian and Alaska Native
Place of birth - Born in other state (%) - Multirace
Place of birth - Born in other state (%) - Other Race
Place of birth - Native, outside of US (%)
Place of birth - Native, outside of US (%) - White
Place of birth - Native, outside of US (%) - Black or African American
Place of birth - Native, outside of US (%) - Asian
Place of birth - Native, outside of US (%) - Hispanic or Latino
Place of birth - Native, outside of US (%) - American Indian and Alaska Native
Place of birth - Native, outside of US (%) - Multirace
Place of birth - Native, outside of US (%) - Other Race
Place of birth - Foreign born (%)
Place of birth - Foreign born (%) - White
Place of birth - Foreign born (%) - Black or African American
Place of birth - Foreign born (%) - Asian
Place of birth - Foreign born (%) - Hispanic or Latino
Place of birth - Foreign born (%) - American Indian and Alaska Native
Place of birth - Foreign born (%) - Multirace
Place of birth - Foreign born (%) - Other Race
Residents speaking English at home (%)
Residents speaking English at home - Born in the United States (%)
Residents speaking English at home - Native, born elsewhere (%)
Residents speaking English at home - Foreign born (%)
Residents speaking Spanish at home (%)
Residents speaking Spanish at home - Born in the United States (%)
Residents speaking Spanish at home - Native, born elsewhere (%)
Residents speaking Spanish at home - Foreign born (%)
Residents speaking other language at home (%)
Residents speaking other language at home - Born in the United States (%)
Residents speaking other language at home - Native, born elsewhere (%)
Residents speaking other language at home - Foreign born (%)
Marital status - Never married (%)
Marital status - Now married (%)
Marital status - Separated (%)
Marital status - Widowed (%)
Marital status - Divorced (%)
Ancestries Reported - Arab (%)
Ancestries Reported - Czech (%)
Ancestries Reported - Danish (%)
Ancestries Reported - Dutch (%)
Ancestries Reported - English (%)
Ancestries Reported - French (%)
Ancestries Reported - French Canadian (%)
Ancestries Reported - German (%)
Ancestries Reported - Greek (%)
Ancestries Reported - Hungarian (%)
Ancestries Reported - Irish (%)
Ancestries Reported - Italian (%)
Ancestries Reported - Lithuanian (%)
Ancestries Reported - Norwegian (%)
Ancestries Reported - Polish (%)
Ancestries Reported - Portuguese (%)
Ancestries Reported - Russian (%)
Ancestries Reported - Scotch-Irish (%)
Ancestries Reported - Scottish (%)
Ancestries Reported - Slovak (%)
Ancestries Reported - Subsaharan African (%)
Ancestries Reported - Swedish (%)
Ancestries Reported - Swiss (%)
Ancestries Reported - Ukrainian (%)
Ancestries Reported - United States (%)
Ancestries Reported - Welsh (%)
Ancestries Reported - West Indian (%)
Ancestries Reported - Other (%)
Geographical mobility - Same house 1 year ago (%)
Geographical mobility - Same house 1 year ago (%) - White
Geographical mobility - Same house 1 year ago (%) - Black or African American
Geographical mobility - Same house 1 year ago (%) - Asian
Geographical mobility - Same house 1 year ago (%) - Hispanic or Latino
Geographical mobility - Same house 1 year ago (%) - American Indian and Alaska Native
Geographical mobility - Same house 1 year ago (%) - Multirace
Geographical mobility - Same house 1 year ago (%) - Other Race
Geographical mobility - Moved within same county (%)
Geographical mobility - Moved within same county (%) - White
Geographical mobility - Moved within same county (%) - Black or African American
Geographical mobility - Moved within same county (%) - Asian
Geographical mobility - Moved within same county (%) - Hispanic or Latino
Geographical mobility - Moved within same county (%) - American Indian and Alaska Native
Geographical mobility - Moved within same county (%) - Multirace
Geographical mobility - Moved within same county (%) - Other Race
Geographical mobility - Moved from different county within same state (%)
Geographical mobility - Moved from different county within same state (%) - White
Geographical mobility - Moved from different county within same state (%) - Black or African American
Geographical mobility - Moved from different county within same state (%) - Asian
Geographical mobility - Moved from different county within same state (%) - Hispanic or Latino
Geographical mobility - Moved from different county within same state (%) - American Indian and Alaska Native
Geographical mobility - Moved from different county within same state (%) - Multirace
Geographical mobility - Moved from different county within same state (%) - Other Race
Geographical mobility - Moved from different state (%)
Geographical mobility - Moved from different state (%) - White
Geographical mobility - Moved from different state (%) - Black or African American
Geographical mobility - Moved from different state (%) - Asian
Geographical mobility - Moved from different state (%) - Hispanic or Latino
Geographical mobility - Moved from different state (%) - American Indian and Alaska Native
Geographical mobility - Moved from different state (%) - Multirace
Geographical mobility - Moved from different state (%) - Other Race
Geographical mobility - Moved from abroad (%)
Geographical mobility - Moved from abroad (%) - White
Geographical mobility - Moved from abroad (%) - Black or African American
Geographical mobility - Moved from abroad (%) - Asian
Geographical mobility - Moved from abroad (%) - Hispanic or Latino
Geographical mobility - Moved from abroad (%) - American Indian and Alaska Native
Geographical mobility - Moved from abroad (%) - Multirace
Geographical mobility - Moved from abroad (%) - Other Race
Place of birth for the foreign-born population - Ireland (%)
Place of birth for the foreign-born population - Denmark (%)
Place of birth for the foreign-born population - Norway (%)
Place of birth for the foreign-born population - Sweden (%)
Place of birth for the foreign-born population - United Kingdom (%)
Place of birth for the foreign-born population - England (%)
Place of birth for the foreign-born population - Scotland (%)
Place of birth for the foreign-born population - Other Northern Europe (%)
Place of birth for the foreign-born population - Austria (%)
Place of birth for the foreign-born population - Belgium (%)
Place of birth for the foreign-born population - France (%)
Place of birth for the foreign-born population - Germany (%)
Place of birth for the foreign-born population - Netherlands (%)
Place of birth for the foreign-born population - Switzerland (%)
Place of birth for the foreign-born population - Other Western Europe (%)
Place of birth for the foreign-born population - Greece (%)
Place of birth for the foreign-born population - Italy (%)
Place of birth for the foreign-born population - Portugal (%)
Place of birth for the foreign-born population - Spain (%)
Place of birth for the foreign-born population - Other Southern Europe (%)
Place of birth for the foreign-born population - Albania (%)
Place of birth for the foreign-born population - Belarus (%)
Place of birth for the foreign-born population - Bosnia and Herzegovina (%)
Place of birth for the foreign-born population - Bulgaria (%)
Place of birth for the foreign-born population - Croatia (%)
Place of birth for the foreign-born population - Czechoslovakia (%)
Place of birth for the foreign-born population - Hungary (%)
Place of birth for the foreign-born population - Latvia (%)
Place of birth for the foreign-born population - Lithuania (%)
Place of birth for the foreign-born population - North Macedonia (Macedonia) (%)
Place of birth for the foreign-born population - Moldova (%)
Place of birth for the foreign-born population - Poland (%)
Place of birth for the foreign-born population - Romania (%)
Place of birth for the foreign-born population - Russia (%)
Place of birth for the foreign-born population - Serbia (%)
Place of birth for the foreign-born population - Ukraine (%)
Place of birth for the foreign-born population - Other Eastern Europe (%)
Place of birth for the foreign-born population - China (%)
Place of birth for the foreign-born population - Hong Kong (%)
Place of birth for the foreign-born population - Taiwan (%)
Place of birth for the foreign-born population - Japan (%)
Place of birth for the foreign-born population - Korea (%)
Place of birth for the foreign-born population - Other Eastern Asia (%)
Place of birth for the foreign-born population - Afghanistan (%)
Place of birth for the foreign-born population - Bangladesh (%)
Place of birth for the foreign-born population - India (%)
Place of birth for the foreign-born population - Iran (%)
Place of birth for the foreign-born population - Kazakhstan (%)
Place of birth for the foreign-born population - Nepal (%)
Place of birth for the foreign-born population - Pakistan (%)
Place of birth for the foreign-born population - Sri Lanka (%)
Place of birth for the foreign-born population - Uzbekistan (%)
Place of birth for the foreign-born population - Other South Central Asia (%)
Place of birth for the foreign-born population - Burma (%)
Place of birth for the foreign-born population - Cambodia (%)
Place of birth for the foreign-born population - Indonesia (%)
Place of birth for the foreign-born population - Laos (%)
Place of birth for the foreign-born population - Malaysia (%)
Place of birth for the foreign-born population - Philippines (%)
Place of birth for the foreign-born population - Singapore (%)
Place of birth for the foreign-born population - Thailand (%)
Place of birth for the foreign-born population - Vietnam (%)
Place of birth for the foreign-born population - Other South Eastern Asia (%)
Place of birth for the foreign-born population - Armenia (%)
Place of birth for the foreign-born population - Iraq (%)
Place of birth for the foreign-born population - Israel (%)
Place of birth for the foreign-born population - Jordan (%)
Place of birth for the foreign-born population - Kuwait (%)
Place of birth for the foreign-born population - Lebanon (%)
Place of birth for the foreign-born population - Saudi Arabia (%)
Place of birth for the foreign-born population - Syria (%)
Place of birth for the foreign-born population - Turkey (%)
Place of birth for the foreign-born population - Yemen (%)
Place of birth for the foreign-born population - Other Western Asia (%)
Place of birth for the foreign-born population - Eritrea (%)
Place of birth for the foreign-born population - Ethiopia (%)
Place of birth for the foreign-born population - Kenya (%)
Place of birth for the foreign-born population - Somalia (%)
Place of birth for the foreign-born population - Uganda (%)
Place of birth for the foreign-born population - Zimbabwe (%)
Place of birth for the foreign-born population - Other Eastern Africa (%)
Place of birth for the foreign-born population - Cameroon (%)
Place of birth for the foreign-born population - Congo (%)
Place of birth for the foreign-born population - Democratic Republic of Congo (Zaire) (%)
Place of birth for the foreign-born population - Other Middle Africa (%)
Place of birth for the foreign-born population - Egypt (%)
Place of birth for the foreign-born population - Morocco (%)
Place of birth for the foreign-born population - Sudan (%)
Place of birth for the foreign-born population - Other Northern Africa (%)
Place of birth for the foreign-born population - South Africa (%)
Place of birth for the foreign-born population - Other Southern Africa (%)
Place of birth for the foreign-born population - Cabo Verde (%)
Place of birth for the foreign-born population - Ghana (%)
Place of birth for the foreign-born population - Liberia (%)
Place of birth for the foreign-born population - Nigeria (%)
Place of birth for the foreign-born population - Senegal (%)
Place of birth for the foreign-born population - Sierra Leone (%)
Place of birth for the foreign-born population - Other Western Africa (%)
Place of birth for the foreign-born population - Australia (%)
Place of birth for the foreign-born population - New Zealand (%)
Place of birth for the foreign-born population - Fiji (%)
Place of birth for the foreign-born population - Micronesia (%)
Place of birth for the foreign-born population - Bahamas (%)
Place of birth for the foreign-born population - Barbados (%)
Place of birth for the foreign-born population - Cuba (%)
Place of birth for the foreign-born population - Dominica (%)
Place of birth for the foreign-born population - Dominican Republic (%)
Place of birth for the foreign-born population - Grenada (%)
Place of birth for the foreign-born population - Haiti (%)
Place of birth for the foreign-born population - Jamaica (%)
Place of birth for the foreign-born population - St. Vincent and the Grenadines (%)
Place of birth for the foreign-born population - Trinidad and Tobago (%)
Place of birth for the foreign-born population - West Indies (%)
Place of birth for the foreign-born population - Other Caribbean (%)
Place of birth for the foreign-born population - Belize (%)
Place of birth for the foreign-born population - Costa Rica (%)
Place of birth for the foreign-born population - El Salvador (%)
Place of birth for the foreign-born population - Guatemala (%)
Place of birth for the foreign-born population - Honduras (%)
Place of birth for the foreign-born population - Mexico (%)
Place of birth for the foreign-born population - Nicaragua (%)
Place of birth for the foreign-born population - Panama (%)
Place of birth for the foreign-born population - Other Central America (%)
Place of birth for the foreign-born population - Argentina (%)
Place of birth for the foreign-born population - Bolivia (%)
Place of birth for the foreign-born population - Brazil (%)
Place of birth for the foreign-born population - Chile (%)
Place of birth for the foreign-born population - Colombia (%)
Place of birth for the foreign-born population - Ecuador (%)
Place of birth for the foreign-born population - Guyana (%)
Place of birth for the foreign-born population - Peru (%)
Place of birth for the foreign-born population - Uruguay (%)
Place of birth for the foreign-born population - Venezuela (%)
Place of birth for the foreign-born population - Other South America (%)
Place of birth for the foreign-born population - Canada (%)
Place of birth for the foreign-born population - Other Northern America (%)
Place of birth for the foreign-born population - Other (%)
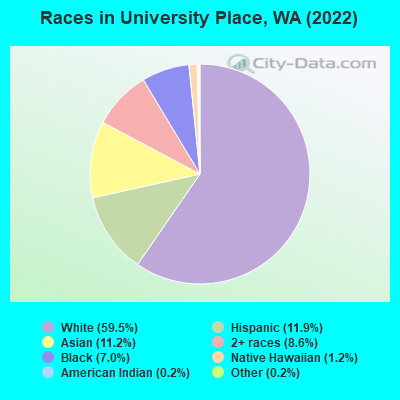
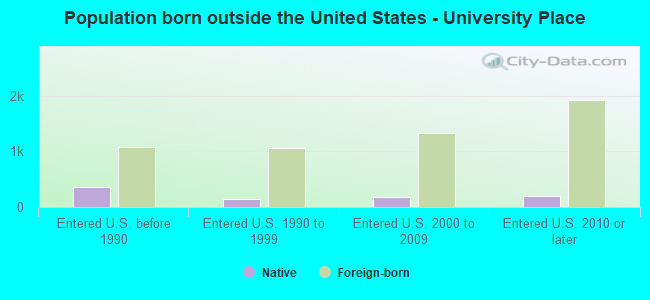
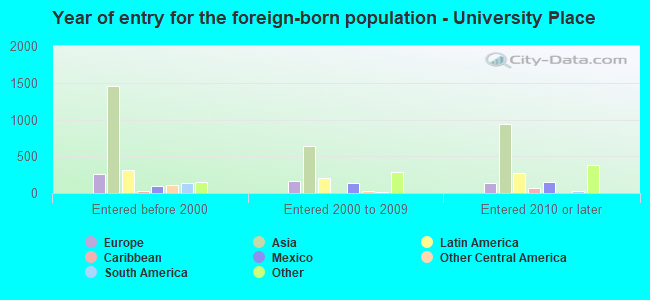
According to 2022 data, the most numerous races in University Place, WA are White alone (20,839 residents), Hispanic (4,157 residents), and Asian alone (3,915 residents). 79.6% of University Place residents speak English at home. 14.7% of University Place, WA residents are foreign-born (8.5% born in Asia, 2.2% born in Latin America, 1.5% born in Europe), which is about the same as the foreign-born rate of 15.0% across the entire state of Washington.
Race distribution in University Place
2000 2022
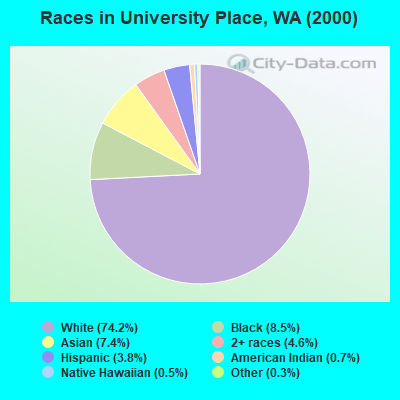
22,207 74.2% White alone 2,555 8.5% Black alone 2,204 7.4% Asian alone 1,372 4.6% Two or more races 1,150 3.8% Hispanic 197 0.7% American Indian alone 162 0.5% Native Hawaiian and Other 86 0.3% Other race alone
20,839 59.5% White alone 4,157 11.9% Hispanic 3,915 11.2% Asian alone 3,006 8.6% Two or more races 2,468 7.0% Black alone 412 1.2% Native Hawaiian and Other 85 0.2% American Indian alone 84 0.2% Other race alone
2000 2022
4,652,490 78.9% White alone 441,509 7.5% Hispanic 319,401 5.4% Asian alone 184,631 3.1% Black alone 175,926 3.0% Two or more races 85,396 1.4% American Indian alone 22,779 0.4% Native Hawaiian and Other 11,989 0.2% Other race alone
4,941,456 63.5% White alone 1,093,313 14.0% Hispanic 755,832 9.7% Asian alone 523,448 6.7% Two or more races 299,537 3.8% Black alone 69,024 0.9% American Indian alone 52,231 0.7% Native Hawaiian and Other 50,945 0.7% Other race alone
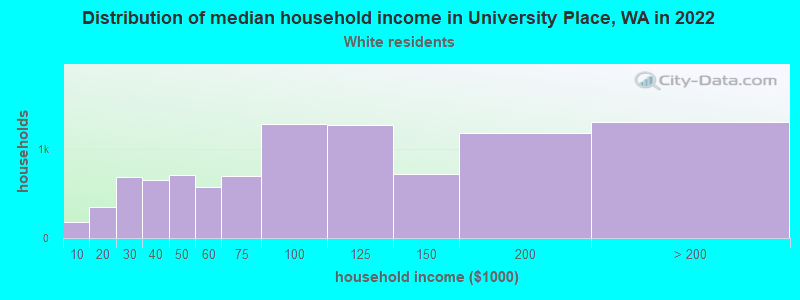
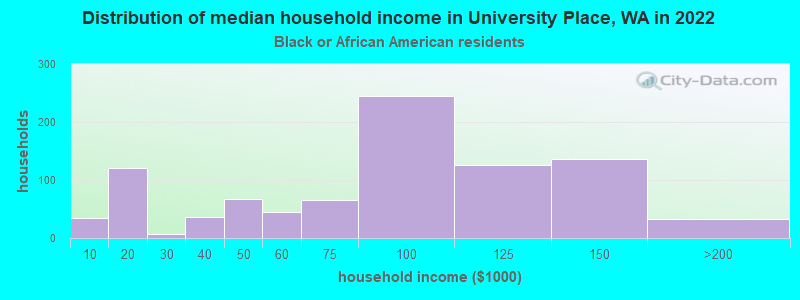
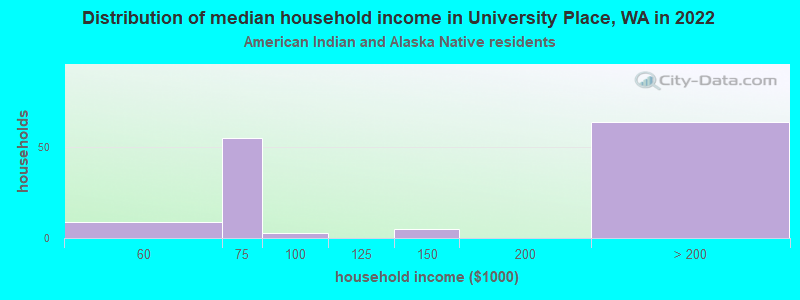
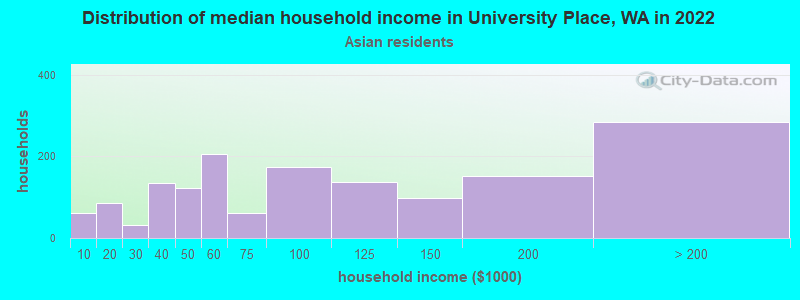
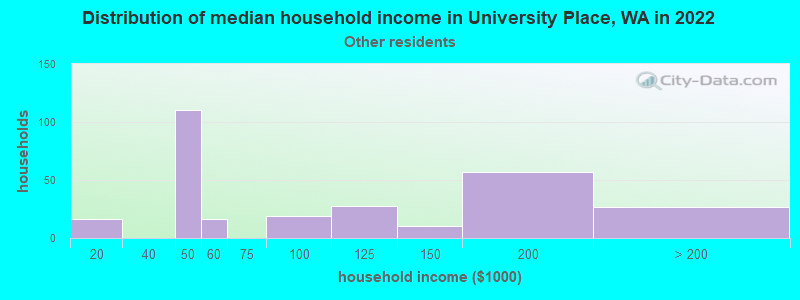
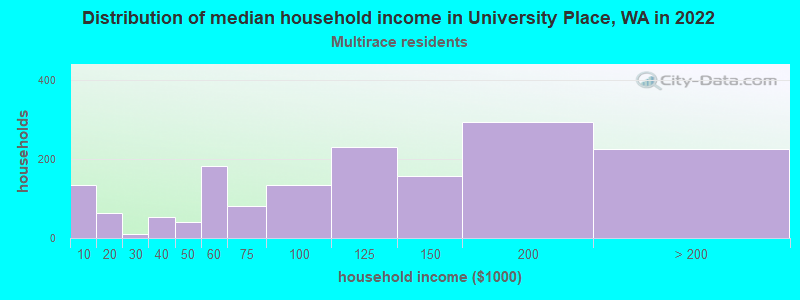
Income and house value in University Place Median household income in 2022 $91,851 White non-Hispanic householders$76,335 Black householders$90,223 Asian householders$111,789 Native Hawaiian and other Pacific Islander householders$82,715 Some other race householders$115,276 Two or more races householders$88,986 Hispanic or Latino race householdersMedian 2022 house value $625,773 White Non-Hispanic householders$711,510 Black or African American householders$671,666 American Indian or Alaska Native householders $621,504 Asian householders$602,649 Native Hawaiian and other Pacific Islander householders$711,510 Some other race householders$653,522 Two or more races householders$601,938 Hispanic or Latino householders
Median age by race in University Place
43.5 Median age for White residents40.8 46.7 39.2 Median age for Black or African American residents30.8 46.0 12.2 Median age for American Indian / Alaska Native residents21.0 11.7 40.7 Median age for Asian residents35.6 43.0 24.4 Median age for Native Hawaiian / Pacific Islander residents33.5 15.8 32.0 Median age for Other race residents48.8 17.5 25.3 Median age for Two or more races residents22.8 29.2 44.8 Median age for White alone residents41.6 48.2 22.4 Median age for Hispanic or Latino residents23.8 18.9
Owner/renter occupied households by race in University Place
House owners and renters - White residents 6,099 63.0% Owner occupied3,584 37.0% Renter occupiedHouse owners and renters - Black or African American residents 152 15.6% Owner occupied822 84.4% Renter occupiedHouse owners and renters - American Indian / Alaska Native residents 44 48.9% Owner occupied46 51.1% Renter occupiedHouse owners and renters - Asian residents 1,015 67.0% Owner occupied499 33.0% Renter occupiedHouse owners and renters - Native Hawaiian / Pacific Islander residents 23 27.3% Owner occupied62 72.7% Renter occupiedHouse owners and renters - Other race residents 123 50.7% Owner occupied119 49.3% Renter occupiedHouse owners and renters - Two or more races residents 729 46.8% Owner occupied827 53.2% Renter occupiedHouse owners and renters - White alone residents 6,061 63.5% Owner occupied3,481 36.5% Renter occupiedHouse owners and renters - Hispanic or Latino residents 392 40.5% Owner occupied575 59.5% Renter occupied
Language usage in University Place
English speakers - Total 79.6% of residents of University Place speak English at home.
6.3% of residents speak Spanish at home 1,706 80.9% Speak English very well402 19.1% Speak English less than very well14.5% of residents speak other language at home 2,605 54.1% Speak English very well2,211 45.9% Speak English less than very well
English speakers - Born in the United States 91.7% of residents of University Place speak English at home.
5.3% of residents speak Spanish at home 515 89.4% Speak English very well61 10.6% Speak English less than very well2.9% of residents speak other language at home 296 92.8% Speak English very well23 7.2% Speak English less than very well
English speakers - Native, born elsewhere 70.9% of residents of University Place speak English at home.
2.7% of residents speak Spanish at home 24 100.0% Speak English very well30.6% of residents speak other language at home 155 56.2% Speak English very well121 43.8% Speak English less than very well
English speakers - Foreign-born 19.9% of residents of University Place speak English at home.
12.8% of residents speak Spanish at home 381 56.2% Speak English very well297 43.8% Speak English less than very well68.1% of residents speak other language at home 1,615 44.6% Speak English very well2,004 55.4% Speak English less than very well
White (Caucasian) - Speak only English Native:
96.7% (18,407)Foreign-born:
28.1% (368)
White (Caucasian) - Speak another language Native:
3.1% (596)Foreign-born:
72.1% (946)
Black or African American - Speak only English Native:
99.6% (2,114)Foreign-born:
8.8% (24)
Asian - Speak only English Native:
54.0% (630)Foreign-born:
23.4% (639)
Asian - Speak another language Native:
44.5% (519)Foreign-born:
77.3% (2,109)
Native Hawaiian / Pacific Islander - Speak another language Native:
36.3% (107)Foreign-born:
91.9% (75)
Other race - Speak only English Native:
27.4% (189)Foreign-born:
6.5% (20)
Other race - Speak another language Native:
71.7% (496)Foreign-born:
93.1% (287)
Two or more races - Speak only English Native:
85.8% (3,622)Foreign-born:
21.9% (110)
Two or more races - Speak another language Native:
13.9% (588)Foreign-born:
69.2% (346)
White alone - Speak only English Native:
96.5% (17,950)Foreign-born:
27.9% (382)
White alone - Speak another language Native:
3.2% (597)Foreign-born:
73.4% (1,002)
Hispanic or Latino - Speak only English Native:
62.6% (1,931)Foreign-born:
4.6% (35)
Hispanic or Latino - Speak another language Native:
37.1% (1,145)Foreign-born:
96.2% (729)
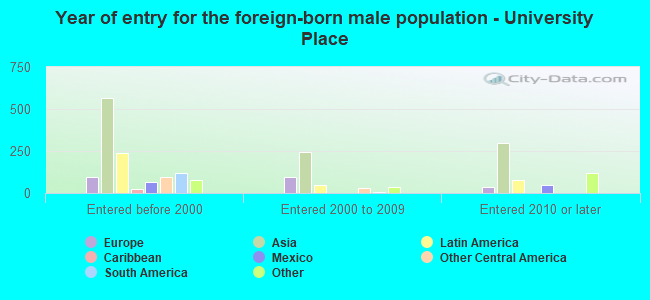
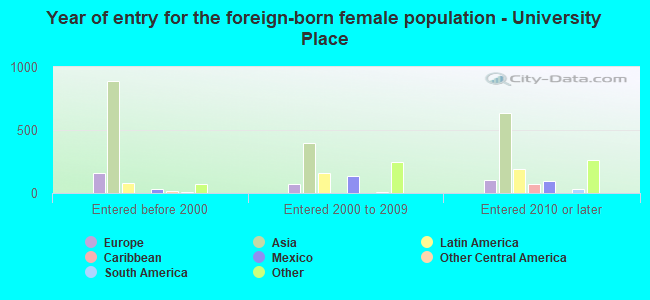
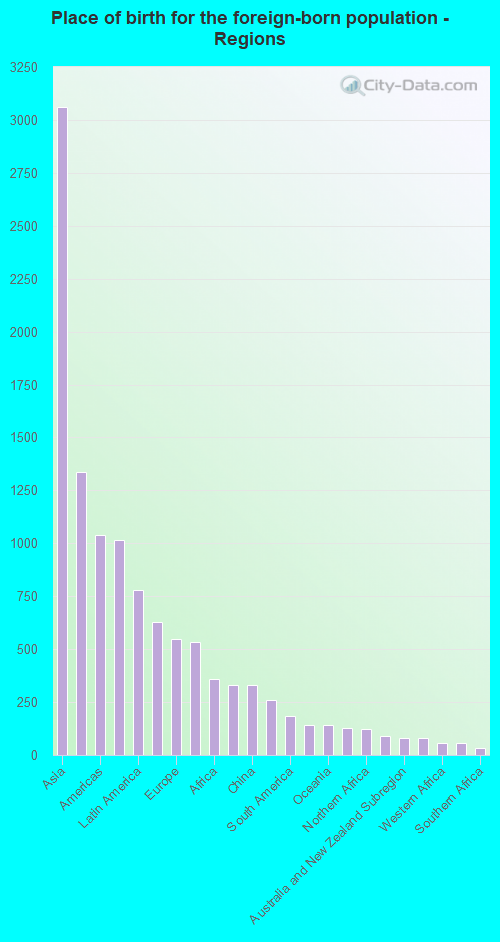
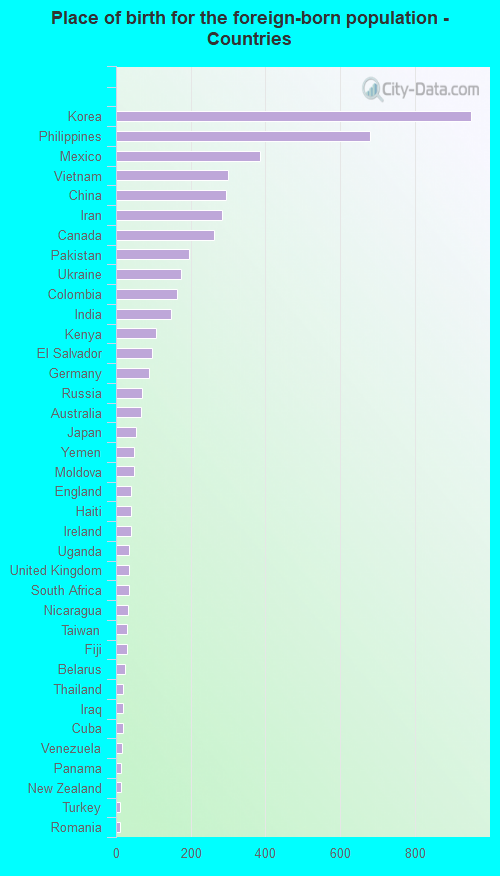
Foreign-born residents in University Place 5,152 residents are foreign born (8.5% Asia , 2.2% Latin America , 1.5% Europe ).
This city:
14.7%Washington:
14.9%
Marital status for residents in University Place Marital status - White (Caucasian) population 15 years and over
Males 26.2% Never married59.6% Now married3.4% Separated1.5% Widowed9.2% DivorcedFemales 23.5% Never married52.9% Now married1.2% Separated9.1% Widowed13.3% DivorcedWomen who gave birth in the past 12 months Now married:
95.7% (190)Unmarried:
4.3% (8)
Women who did not give birth in the past 12 months Now married:
47.1% (1,878)Unmarried:
52.9% (2,110)
Marital status - Black or African American population 15 years and over
Males 46.3% Never married38.9% Now married2.0% Separated0.0% Widowed12.8% DivorcedFemales 19.0% Never married32.9% Now married2.8% Separated16.3% Widowed29.0% DivorcedWomen who did not give birth in the past 12 months Now married:
38.6% (128)Unmarried:
61.4% (203)
Marital status - American Indian / Alaska Native population 15 years and over
Males 38.0% Never married48.2% Now married0.0% Separated0.0% Widowed13.9% DivorcedFemales 35.7% Never married35.0% Now married0.0% Separated0.0% Widowed29.3% DivorcedWomen who did not give birth in the past 12 months Now married:
35.7% (54)Unmarried:
64.3% (97)
Marital status - Asian population 15 years and over
Males 41.3% Never married52.4% Now married0.0% Separated1.9% Widowed4.3% DivorcedFemales 22.5% Never married64.5% Now married1.5% Separated3.3% Widowed8.2% DivorcedWomen who gave birth in the past 12 months Now married:
100.0% (61)Unmarried:
0.0% (0)
Women who did not give birth in the past 12 months Now married:
58.3% (683)Unmarried:
41.7% (489)
Marital status - Native Hawaiian / Pacific Islander population 15 years and over
Males 37.8% Never married62.2% Now married0.0% Separated0.0% Widowed0.0% DivorcedFemales 45.9% Never married54.1% Now married0.0% Separated0.0% Widowed0.0% DivorcedWomen who gave birth in the past 12 months Now married:
100.0% (36)Unmarried:
0.0% (0)
Women who did not give birth in the past 12 months Now married:
39.6% (45)Unmarried:
60.4% (69)
Marital status - Other race population 15 years and over
Males 36.2% Never married46.1% Now married0.0% Separated0.0% Widowed17.7% DivorcedFemales 53.6% Never married27.0% Now married0.0% Separated19.4% Widowed0.0% DivorcedWomen who did not give birth in the past 12 months Now married:
19.1% (63)Unmarried:
80.9% (267)
Marital status - Two or more races population 15 years and over
Males 47.7% Never married43.4% Now married0.0% Separated0.9% Widowed8.0% DivorcedFemales 44.3% Never married36.9% Now married1.2% Separated5.8% Widowed11.7% DivorcedWomen who gave birth in the past 12 months Now married:
52.9% (12)Unmarried:
47.1% (11)
Women who did not give birth in the past 12 months Now married:
30.7% (504)Unmarried:
69.3% (1,136)
Marital status - White alone, not Hispanic / Latino population 15 years and over
Males 26.4% Never married59.1% Now married3.5% Separated1.6% Widowed9.4% DivorcedFemales 23.1% Never married53.4% Now married0.8% Separated9.2% Widowed13.5% DivorcedWomen who gave birth in the past 12 months Now married:
95.7% (195)Unmarried:
4.3% (9)
Women who did not give birth in the past 12 months Now married:
47.3% (1,831)Unmarried:
52.7% (2,037)
Marital status - Hispanic or Latino population 15 years and over
Males 38.8% Never married49.6% Now married0.0% Separated0.0% Widowed11.6% DivorcedFemales 41.1% Never married39.5% Now married2.4% Separated8.5% Widowed8.5% DivorcedWomen who did not give birth in the past 12 months Now married:
37.6% (446)Unmarried:
62.4% (740)
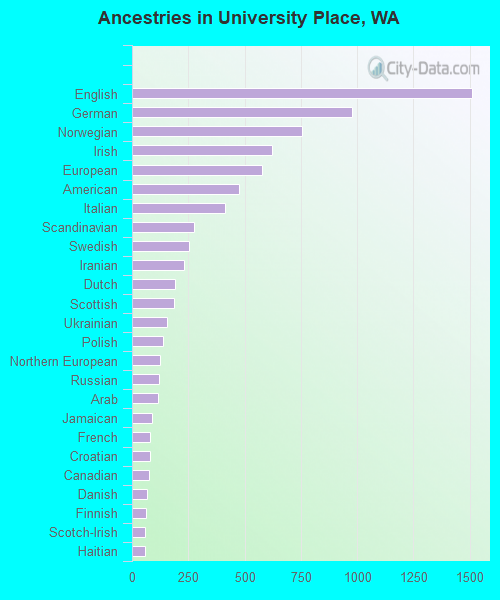
Ancestries in University Place
1,511 8.9% English979 5.7% German757 4.4% Norwegian622 3.6% Irish576 3.4% European476 2.8% American413 2.4% Italian277 1.6% Scandinavian253 1.5% Swedish231 1.4% Iranian191 1.1% Dutch188 1.1% Scottish154 0.9% Ukrainian138 0.8% Polish126 0.7% Northern European119 0.7% Russian114 0.7% Arab89 0.5% Jamaican82 0.5% French78 0.5% Croatian74 0.4% Canadian66 0.4% Danish64 0.4% Finnish59 0.3% Scotch-Irish57 0.3% Haitian56 0.3% African51 0.3% Greek44 0.3% Ugandan33 0.2% Swiss27 0.2% Romanian24 0.1% Iraqi24 0.1% French Canadian23 0.1% Austrian20 0.1% Welsh17 0.10% Icelander17 0.10% British16 0.09% Bulgarian15 0.09% Latvian15 0.09% Celtic14 0.08% Portuguese12 0.07% Czech12 0.07% Turkish11 0.06% Eastern European8 0.05% New Zealander7 0.04% Hungarian
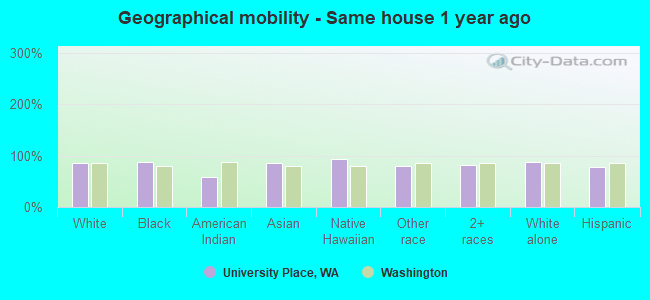
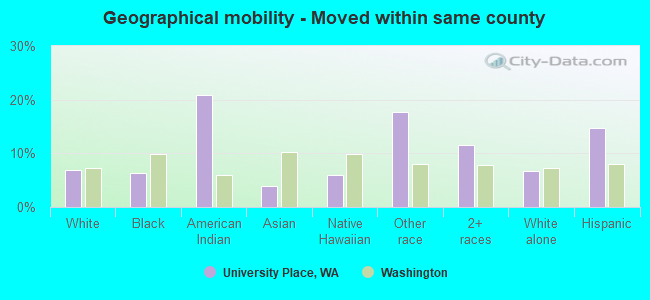
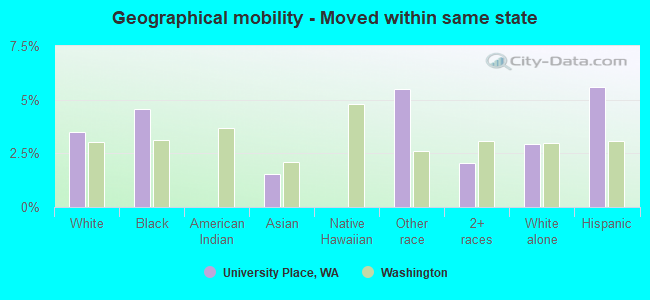
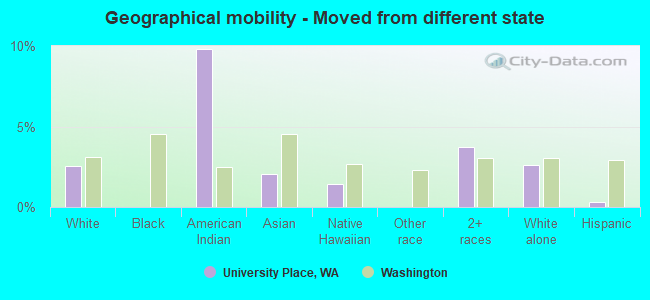
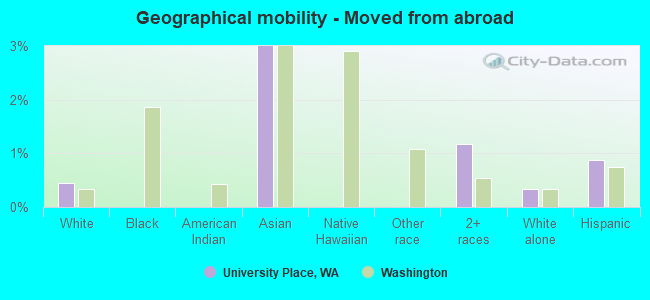
Geographical mobility in University Place Same house 1 year ago 18,479 86.7% White (Caucasian)2,193 87.4% Black or African American318 57.7% American Indian / Alaska Native3,398 86.6% Asian339 93.7% Native Hawaiian / Pacific Islander819 80.8% Other race4,155 82.0% Two or more races18,160 87.6% White alone, not Hispanic / Latino3,214 77.7% Hispanic or LatinoMoved within same county 1,459 6.8% White / Caucasian160 6.4% Black or African American115 20.8% American Indian / Alaska Native156 4.0% Asian21 5.9% Native Hawaiian / Pacific Islander179 17.7% Other race589 11.6% Two or more races1,381 6.7% White alone, not Hispanic / Latino609 14.7% Hispanic or LatinoMoved within same state 740 3.5% White / Caucasian115 4.6% Black or African American60 1.5% Asian56 5.5% Other race104 2.1% Two or more races608 2.9% White alone, not Hispanic / Latino231 5.6% Hispanic or LatinoMoved from different state 545 2.6% White / Caucasian54 9.8% American Indian / Alaska Native80 2.0% Asian5 1.4% Native Hawaiian / Pacific Islander190 3.8% Two or more races540 2.6% White alone, not Hispanic / Latino12 0.3% Hispanic or LatinoMoved from abroad 94 0.4% White119 3.0% Asian60 1.2% Two or more races69 0.3% White alone, not Hispanic / Latino36 0.9% Hispanic or Latino
Children Nativity (place of birth) in University Place
Children under 6 years - Living with two parents Both parents native 1,281 100.0% NativeBoth parents foreign-born 196 89.8% Native22 10.2% Foreign-bornOne native, one foreign-born parent 308 100.0% NativeChildren under 6 years - Living with one parent Native parent 121 100.0% NativeForeign-born parent 124 100.0% NativeChildren 6 to 17 years - Living with two parents Both parents native 2,383 99.4% Native15 0.6% Foreign-bornBoth parents foreign-born 718 62.0% Native440 38.0% Foreign-bornOne native, one foreign-born parent 797 100.0% NativeChildren 6 to 17 years - Living with one parent Native parent 1,279 100.0% NativeForeign-born parent 255 50.4% Native251 49.6% Foreign-born
Grandparents responsible for own grandchildren in University Place
Grandparents (30 to 59 years) White / Caucasian 57 100.0% Not responsible for grandchildrenBlack or African American 96 100.0% Responsible for grandchildrenTwo or more races 13 100.0% Not responsible for grandchildrenWhite alone, not Hispanic / Latino 59 100.0% Not responsible for grandchildrenGrandparents (60 years and over) White / Caucasian 42 39.9% Responsible for grandchildren64 60.1% Not responsible for grandchildrenBlack or African American 77 100.0% Not responsible for grandchildrenTwo or more races 12 14.8% Responsible for grandchildren68 85.2% Not responsible for grandchildrenWhite alone, not Hispanic / Latino 44 40.8% Responsible for grandchildren64 59.2% Not responsible for grandchildren