Races in Upper Sandusky, Ohio (OH) Detailed Stats
Data:
Races - White alone (%)
Races - White alone (% change since 2000)
Races - Black alone (%)
Races - Black alone (% change since 2000)
Races - American Indian alone (%)
Races - American Indian alone (% change since 2000)
Races - Asian alone (%)
Races - Asian alone (% change since 2000)
Races - Hispanic (%)
Races - Hispanic (% change since 2000)
Races - Native Hawaiian and Other Pacific Islander alone (%)
Races - Native Hawaiian and Other Pacific Islander alone (% change since 2000)
Races - Two or more races(%)
Races - Two or more races(% change since 2000)
Races - Other race alone (%)
Races - Other race alone (% change since 2000)
Racial diversity
Place of birth - Born in state of residence (%)
Place of birth - Born in state of residence (%) - White
Place of birth - Born in state of residence (%) - Black or African American
Place of birth - Born in state of residence (%) - Asian
Place of birth - Born in state of residence (%) - Hispanic or Latino
Place of birth - Born in state of residence (%) - American Indian and Alaska Native
Place of birth - Born in state of residence (%) - Multirace
Place of birth - Born in state of residence (%) - Other Race
Place of birth - Born in other state (%)
Place of birth - Born in other state (%) - White
Place of birth - Born in other state (%) - Black or African American
Place of birth - Born in other state (%) - Asian
Place of birth - Born in other state (%) - Hispanic or Latino
Place of birth - Born in other state (%) - American Indian and Alaska Native
Place of birth - Born in other state (%) - Multirace
Place of birth - Born in other state (%) - Other Race
Place of birth - Native, outside of US (%)
Place of birth - Native, outside of US (%) - White
Place of birth - Native, outside of US (%) - Black or African American
Place of birth - Native, outside of US (%) - Asian
Place of birth - Native, outside of US (%) - Hispanic or Latino
Place of birth - Native, outside of US (%) - American Indian and Alaska Native
Place of birth - Native, outside of US (%) - Multirace
Place of birth - Native, outside of US (%) - Other Race
Place of birth - Foreign born (%)
Place of birth - Foreign born (%) - White
Place of birth - Foreign born (%) - Black or African American
Place of birth - Foreign born (%) - Asian
Place of birth - Foreign born (%) - Hispanic or Latino
Place of birth - Foreign born (%) - American Indian and Alaska Native
Place of birth - Foreign born (%) - Multirace
Place of birth - Foreign born (%) - Other Race
Residents speaking English at home (%)
Residents speaking English at home - Born in the United States (%)
Residents speaking English at home - Native, born elsewhere (%)
Residents speaking English at home - Foreign born (%)
Residents speaking Spanish at home (%)
Residents speaking Spanish at home - Born in the United States (%)
Residents speaking Spanish at home - Native, born elsewhere (%)
Residents speaking Spanish at home - Foreign born (%)
Residents speaking other language at home (%)
Residents speaking other language at home - Born in the United States (%)
Residents speaking other language at home - Native, born elsewhere (%)
Residents speaking other language at home - Foreign born (%)
Marital status - Never married (%)
Marital status - Now married (%)
Marital status - Separated (%)
Marital status - Widowed (%)
Marital status - Divorced (%)
Ancestries Reported - Arab (%)
Ancestries Reported - Czech (%)
Ancestries Reported - Danish (%)
Ancestries Reported - Dutch (%)
Ancestries Reported - English (%)
Ancestries Reported - French (%)
Ancestries Reported - French Canadian (%)
Ancestries Reported - German (%)
Ancestries Reported - Greek (%)
Ancestries Reported - Hungarian (%)
Ancestries Reported - Irish (%)
Ancestries Reported - Italian (%)
Ancestries Reported - Lithuanian (%)
Ancestries Reported - Norwegian (%)
Ancestries Reported - Polish (%)
Ancestries Reported - Portuguese (%)
Ancestries Reported - Russian (%)
Ancestries Reported - Scotch-Irish (%)
Ancestries Reported - Scottish (%)
Ancestries Reported - Slovak (%)
Ancestries Reported - Subsaharan African (%)
Ancestries Reported - Swedish (%)
Ancestries Reported - Swiss (%)
Ancestries Reported - Ukrainian (%)
Ancestries Reported - United States (%)
Ancestries Reported - Welsh (%)
Ancestries Reported - West Indian (%)
Ancestries Reported - Other (%)
Geographical mobility - Same house 1 year ago (%)
Geographical mobility - Same house 1 year ago (%) - White
Geographical mobility - Same house 1 year ago (%) - Black or African American
Geographical mobility - Same house 1 year ago (%) - Asian
Geographical mobility - Same house 1 year ago (%) - Hispanic or Latino
Geographical mobility - Same house 1 year ago (%) - American Indian and Alaska Native
Geographical mobility - Same house 1 year ago (%) - Multirace
Geographical mobility - Same house 1 year ago (%) - Other Race
Geographical mobility - Moved within same county (%)
Geographical mobility - Moved within same county (%) - White
Geographical mobility - Moved within same county (%) - Black or African American
Geographical mobility - Moved within same county (%) - Asian
Geographical mobility - Moved within same county (%) - Hispanic or Latino
Geographical mobility - Moved within same county (%) - American Indian and Alaska Native
Geographical mobility - Moved within same county (%) - Multirace
Geographical mobility - Moved within same county (%) - Other Race
Geographical mobility - Moved from different county within same state (%)
Geographical mobility - Moved from different county within same state (%) - White
Geographical mobility - Moved from different county within same state (%) - Black or African American
Geographical mobility - Moved from different county within same state (%) - Asian
Geographical mobility - Moved from different county within same state (%) - Hispanic or Latino
Geographical mobility - Moved from different county within same state (%) - American Indian and Alaska Native
Geographical mobility - Moved from different county within same state (%) - Multirace
Geographical mobility - Moved from different county within same state (%) - Other Race
Geographical mobility - Moved from different state (%)
Geographical mobility - Moved from different state (%) - White
Geographical mobility - Moved from different state (%) - Black or African American
Geographical mobility - Moved from different state (%) - Asian
Geographical mobility - Moved from different state (%) - Hispanic or Latino
Geographical mobility - Moved from different state (%) - American Indian and Alaska Native
Geographical mobility - Moved from different state (%) - Multirace
Geographical mobility - Moved from different state (%) - Other Race
Geographical mobility - Moved from abroad (%)
Geographical mobility - Moved from abroad (%) - White
Geographical mobility - Moved from abroad (%) - Black or African American
Geographical mobility - Moved from abroad (%) - Asian
Geographical mobility - Moved from abroad (%) - Hispanic or Latino
Geographical mobility - Moved from abroad (%) - American Indian and Alaska Native
Geographical mobility - Moved from abroad (%) - Multirace
Geographical mobility - Moved from abroad (%) - Other Race
Place of birth for the foreign-born population - Ireland (%)
Place of birth for the foreign-born population - Denmark (%)
Place of birth for the foreign-born population - Norway (%)
Place of birth for the foreign-born population - Sweden (%)
Place of birth for the foreign-born population - United Kingdom (%)
Place of birth for the foreign-born population - England (%)
Place of birth for the foreign-born population - Scotland (%)
Place of birth for the foreign-born population - Other Northern Europe (%)
Place of birth for the foreign-born population - Austria (%)
Place of birth for the foreign-born population - Belgium (%)
Place of birth for the foreign-born population - France (%)
Place of birth for the foreign-born population - Germany (%)
Place of birth for the foreign-born population - Netherlands (%)
Place of birth for the foreign-born population - Switzerland (%)
Place of birth for the foreign-born population - Other Western Europe (%)
Place of birth for the foreign-born population - Greece (%)
Place of birth for the foreign-born population - Italy (%)
Place of birth for the foreign-born population - Portugal (%)
Place of birth for the foreign-born population - Spain (%)
Place of birth for the foreign-born population - Other Southern Europe (%)
Place of birth for the foreign-born population - Albania (%)
Place of birth for the foreign-born population - Belarus (%)
Place of birth for the foreign-born population - Bosnia and Herzegovina (%)
Place of birth for the foreign-born population - Bulgaria (%)
Place of birth for the foreign-born population - Croatia (%)
Place of birth for the foreign-born population - Czechoslovakia (%)
Place of birth for the foreign-born population - Hungary (%)
Place of birth for the foreign-born population - Latvia (%)
Place of birth for the foreign-born population - Lithuania (%)
Place of birth for the foreign-born population - North Macedonia (Macedonia) (%)
Place of birth for the foreign-born population - Moldova (%)
Place of birth for the foreign-born population - Poland (%)
Place of birth for the foreign-born population - Romania (%)
Place of birth for the foreign-born population - Russia (%)
Place of birth for the foreign-born population - Serbia (%)
Place of birth for the foreign-born population - Ukraine (%)
Place of birth for the foreign-born population - Other Eastern Europe (%)
Place of birth for the foreign-born population - China (%)
Place of birth for the foreign-born population - Hong Kong (%)
Place of birth for the foreign-born population - Taiwan (%)
Place of birth for the foreign-born population - Japan (%)
Place of birth for the foreign-born population - Korea (%)
Place of birth for the foreign-born population - Other Eastern Asia (%)
Place of birth for the foreign-born population - Afghanistan (%)
Place of birth for the foreign-born population - Bangladesh (%)
Place of birth for the foreign-born population - India (%)
Place of birth for the foreign-born population - Iran (%)
Place of birth for the foreign-born population - Kazakhstan (%)
Place of birth for the foreign-born population - Nepal (%)
Place of birth for the foreign-born population - Pakistan (%)
Place of birth for the foreign-born population - Sri Lanka (%)
Place of birth for the foreign-born population - Uzbekistan (%)
Place of birth for the foreign-born population - Other South Central Asia (%)
Place of birth for the foreign-born population - Burma (%)
Place of birth for the foreign-born population - Cambodia (%)
Place of birth for the foreign-born population - Indonesia (%)
Place of birth for the foreign-born population - Laos (%)
Place of birth for the foreign-born population - Malaysia (%)
Place of birth for the foreign-born population - Philippines (%)
Place of birth for the foreign-born population - Singapore (%)
Place of birth for the foreign-born population - Thailand (%)
Place of birth for the foreign-born population - Vietnam (%)
Place of birth for the foreign-born population - Other South Eastern Asia (%)
Place of birth for the foreign-born population - Armenia (%)
Place of birth for the foreign-born population - Iraq (%)
Place of birth for the foreign-born population - Israel (%)
Place of birth for the foreign-born population - Jordan (%)
Place of birth for the foreign-born population - Kuwait (%)
Place of birth for the foreign-born population - Lebanon (%)
Place of birth for the foreign-born population - Saudi Arabia (%)
Place of birth for the foreign-born population - Syria (%)
Place of birth for the foreign-born population - Turkey (%)
Place of birth for the foreign-born population - Yemen (%)
Place of birth for the foreign-born population - Other Western Asia (%)
Place of birth for the foreign-born population - Eritrea (%)
Place of birth for the foreign-born population - Ethiopia (%)
Place of birth for the foreign-born population - Kenya (%)
Place of birth for the foreign-born population - Somalia (%)
Place of birth for the foreign-born population - Uganda (%)
Place of birth for the foreign-born population - Zimbabwe (%)
Place of birth for the foreign-born population - Other Eastern Africa (%)
Place of birth for the foreign-born population - Cameroon (%)
Place of birth for the foreign-born population - Congo (%)
Place of birth for the foreign-born population - Democratic Republic of Congo (Zaire) (%)
Place of birth for the foreign-born population - Other Middle Africa (%)
Place of birth for the foreign-born population - Egypt (%)
Place of birth for the foreign-born population - Morocco (%)
Place of birth for the foreign-born population - Sudan (%)
Place of birth for the foreign-born population - Other Northern Africa (%)
Place of birth for the foreign-born population - South Africa (%)
Place of birth for the foreign-born population - Other Southern Africa (%)
Place of birth for the foreign-born population - Cabo Verde (%)
Place of birth for the foreign-born population - Ghana (%)
Place of birth for the foreign-born population - Liberia (%)
Place of birth for the foreign-born population - Nigeria (%)
Place of birth for the foreign-born population - Senegal (%)
Place of birth for the foreign-born population - Sierra Leone (%)
Place of birth for the foreign-born population - Other Western Africa (%)
Place of birth for the foreign-born population - Australia (%)
Place of birth for the foreign-born population - New Zealand (%)
Place of birth for the foreign-born population - Fiji (%)
Place of birth for the foreign-born population - Micronesia (%)
Place of birth for the foreign-born population - Bahamas (%)
Place of birth for the foreign-born population - Barbados (%)
Place of birth for the foreign-born population - Cuba (%)
Place of birth for the foreign-born population - Dominica (%)
Place of birth for the foreign-born population - Dominican Republic (%)
Place of birth for the foreign-born population - Grenada (%)
Place of birth for the foreign-born population - Haiti (%)
Place of birth for the foreign-born population - Jamaica (%)
Place of birth for the foreign-born population - St. Vincent and the Grenadines (%)
Place of birth for the foreign-born population - Trinidad and Tobago (%)
Place of birth for the foreign-born population - West Indies (%)
Place of birth for the foreign-born population - Other Caribbean (%)
Place of birth for the foreign-born population - Belize (%)
Place of birth for the foreign-born population - Costa Rica (%)
Place of birth for the foreign-born population - El Salvador (%)
Place of birth for the foreign-born population - Guatemala (%)
Place of birth for the foreign-born population - Honduras (%)
Place of birth for the foreign-born population - Mexico (%)
Place of birth for the foreign-born population - Nicaragua (%)
Place of birth for the foreign-born population - Panama (%)
Place of birth for the foreign-born population - Other Central America (%)
Place of birth for the foreign-born population - Argentina (%)
Place of birth for the foreign-born population - Bolivia (%)
Place of birth for the foreign-born population - Brazil (%)
Place of birth for the foreign-born population - Chile (%)
Place of birth for the foreign-born population - Colombia (%)
Place of birth for the foreign-born population - Ecuador (%)
Place of birth for the foreign-born population - Guyana (%)
Place of birth for the foreign-born population - Peru (%)
Place of birth for the foreign-born population - Uruguay (%)
Place of birth for the foreign-born population - Venezuela (%)
Place of birth for the foreign-born population - Other South America (%)
Place of birth for the foreign-born population - Canada (%)
Place of birth for the foreign-born population - Other Northern America (%)
Place of birth for the foreign-born population - Other (%)
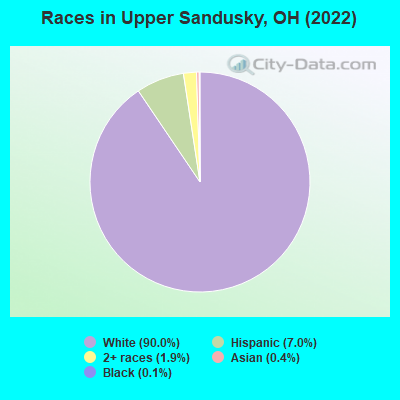
According to 2022 data, the most numerous races in Upper Sandusky, OH are White alone (5,874 residents), Black alone (8 residents), and Two or more races (121 residents). 95.0% of Upper Sandusky residents speak English at home. 2.2% of Upper Sandusky, OH residents are foreign-born (1.6% born in Latin America, 0.4% born in Asia), which is 78.8% less than the foreign-born rate of 4.0% across the entire state of Ohio.
Race distribution in Upper Sandusky
2000 2022
9,538,111 84.0% White alone 1,290,662 11.4% Black alone 217,123 1.9% Hispanic 137,770 1.2% Two or more races 131,670 1.2% Asian alone 21,985 0.2% American Indian alone 13,483 0.1% Other race alone 2,336 0.02% Native Hawaiian and Other
8,948,793 76.1% White alone 1,401,403 11.9% Black alone 529,291 4.5% Two or more races 517,232 4.4% Hispanic 293,387 2.5% Asian alone 52,805 0.4% Other race alone 9,785 0.08% American Indian alone 3,362 0.03% Native Hawaiian and Other
Income and house value in Upper Sandusky Median household income in 2022 $58,332 White non-Hispanic householders$82,396 Two or more races householders$82,828 Hispanic or Latino race householdersMedian 2022 house value $166,255 White Non-Hispanic householders$221,084 Some other race householders$167,041 Two or more races householders$207,917 Hispanic or Latino householders
Median age by race in Upper Sandusky
40.5 Median age for White residents38.2 43.6 -676,499,507.7 Median age for Black or African American residents-681,159,419.6 -674,157,302.7 -676,818,950.3 Median age for American Indian / Alaska Native residents-685,185,184.5 -658,163,264.6 -672,430,354.8 Median age for Asian residents-674,486,802.8 -674,285,713.6 -800,387,596.1 Median age for Native Hawaiian / Pacific Islander residents-750,242,953.6 -805,394,989.6 -675,467,546.1 Median age for Other race residents-691,275,167.1 -655,948,552.4 36.2 Median age for Two or more races residents12.4 36.6 40.6 Median age for White alone residents38.3 43.6 28.5 Median age for Hispanic or Latino residents27.9 32.0
Owner/renter occupied households by race in Upper Sandusky
House owners and renters - White residents 1,822 65.1% Owner occupied977 34.9% Renter occupiedHouse owners and renters - Two or more races residents 95 46.2% Owner occupied110 53.8% Renter occupiedHouse owners and renters - White alone residents 1,782 64.8% Owner occupied967 35.2% Renter occupiedHouse owners and renters - Hispanic or Latino residents 90 48.9% Owner occupied94 51.1% Renter occupied
Language usage in Upper Sandusky
English speakers - Total 95.0% of residents of Upper Sandusky speak English at home.
4.4% of residents speak Spanish at home 176 66.2% Speak English very well90 33.8% Speak English less than very well0.5% of residents speak other language at home 30 100.0% Speak English very well
English speakers - Born in the United States 96.9% of residents of Upper Sandusky speak English at home.
2.9% of residents speak Spanish at home 20 100.0% Speak English very well
All residents speak only English at home
English speakers - Foreign-born 6.2% of residents of Upper Sandusky speak English at home.
76.7% of residents speak Spanish at home 24 21.4% Speak English very well88 78.6% Speak English less than very well20.5% of residents speak other language at home 30 100.0% Speak English very well
White (Caucasian) - Speak only English Native:
99.3% (5,481)Foreign-born:
26.0% (8)
White (Caucasian) - Speak another language Native:
0.8% (43)Foreign-born:
72.9% (24)
Two or more races - Speak another language Native:
42.1% (154)Foreign-born:
100.0% (115)
White alone - Speak only English Native:
99.4% (5,391)Foreign-born:
65.3% (9)
White alone - Speak another language Native:
0.5% (28)Foreign-born:
35.4% (5)
Hispanic or Latino - Speak another language Native:
41.3% (136)Foreign-born:
100.0% (112)
Foreign-born residents in Upper Sandusky 146 residents are foreign born (1.6% Latin America , 0.4% Asia ).
Marital status for residents in Upper Sandusky Marital status - White (Caucasian) population 15 years and over
Males 25.3% Never married52.6% Now married2.5% Separated3.4% Widowed16.3% DivorcedFemales 24.8% Never married40.5% Now married3.1% Separated13.8% Widowed17.8% DivorcedWomen who gave birth in the past 12 months Now married:
34.1% (44)Unmarried:
65.9% (86)
Women who did not give birth in the past 12 months Now married:
49.7% (640)Unmarried:
50.3% (648)
Marital status - Black or African American population 15 years and over
Males 0.0% Never married0.0% Now married100.0% Separated0.0% Widowed0.0% DivorcedFemales 100.0% Never married0.0% Now married0.0% Separated0.0% Widowed0.0% DivorcedMarital status - Two or more races population 15 years and over
Males 34.6% Never married0.0% Now married0.0% Separated0.0% Widowed65.4% DivorcedFemales 53.2% Never married11.9% Now married0.0% Separated34.9% Widowed0.0% DivorcedWomen who did not give birth in the past 12 months Now married:
18.3% (17)Unmarried:
81.7% (77)
Marital status - White alone, not Hispanic / Latino population 15 years and over
Males 24.4% Never married53.2% Now married2.5% Separated3.4% Widowed16.5% DivorcedFemales 24.1% Never married40.4% Now married3.2% Separated14.2% Widowed18.1% DivorcedWomen who gave birth in the past 12 months Now married:
34.1% (45)Unmarried:
65.9% (87)
Women who did not give birth in the past 12 months Now married:
49.8% (611)Unmarried:
50.2% (615)
Marital status - Hispanic or Latino population 15 years and over
Males 44.4% Never married0.0% Now married0.0% Separated0.0% Widowed55.6% DivorcedFemales 58.1% Never married35.5% Now married0.0% Separated0.0% Widowed6.5% DivorcedWomen who did not give birth in the past 12 months Now married:
35.3% (52)Unmarried:
64.7% (95)
Ancestries in Upper Sandusky
1,235 39.5% German376 12.0% American254 8.1% English185 5.9% Irish126 4.0% Scottish110 3.5% Scotch-Irish100 3.2% Italian59 1.9% European20 0.6% Dutch18 0.6% Polish13 0.4% Pennsylvania German13 0.4% Swiss11 0.4% Hungarian11 0.4% Welsh5 0.2% Czech4 0.1% Slovene
Children Nativity (place of birth) in Upper Sandusky
Children under 6 years - Living with two parents Both parents native 267 100.0% NativeOne native, one foreign-born parent 11 100.0% NativeChildren under 6 years - Living with one parent Native parent 185 100.0% NativeChildren 6 to 17 years - Living with two parents Both parents native 534 100.0% NativeChildren 6 to 17 years - Living with one parent Native parent 337 100.0% NativeForeign-born parent 117 50.4% Native116 49.6% Foreign-born
Place of birth for residents in Upper Sandusky 107 Americas107 Latin America107 Central America24 Asia24 Eastern Asia24 China14 Europe9 Northern Europe5 Eastern Europe
Grandparents responsible for own grandchildren in Upper Sandusky
Grandparents (30 to 59 years) White / Caucasian 34 100.0% Not responsible for grandchildrenWhite alone, not Hispanic / Latino 29 100.0% Not responsible for grandchildrenHispanic or Latino 6 100.0% Not responsible for grandchildren
Grandparents (60 years and over) White / Caucasian 27 100.0% Not responsible for grandchildrenWhite alone, not Hispanic / Latino 27 100.0% Not responsible for grandchildren