Races in Upper St. Clair, Pennsylvania (PA) Detailed Stats
Data:
Races - White alone (%)
Races - White alone (% change since 2000)
Races - Black alone (%)
Races - Black alone (% change since 2000)
Races - American Indian alone (%)
Races - American Indian alone (% change since 2000)
Races - Asian alone (%)
Races - Asian alone (% change since 2000)
Races - Hispanic (%)
Races - Hispanic (% change since 2000)
Races - Native Hawaiian and Other Pacific Islander alone (%)
Races - Native Hawaiian and Other Pacific Islander alone (% change since 2000)
Races - Two or more races(%)
Races - Two or more races(% change since 2000)
Races - Other race alone (%)
Races - Other race alone (% change since 2000)
Racial diversity
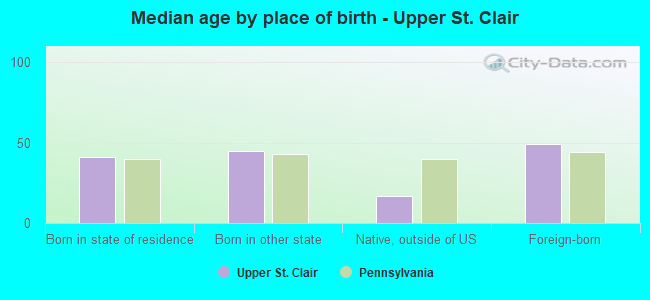
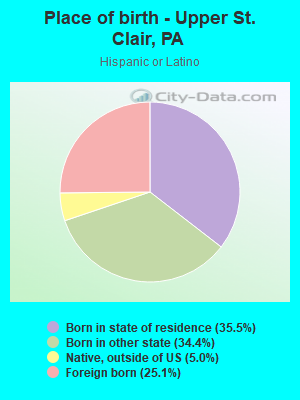
Place of birth - Born in state of residence (%)
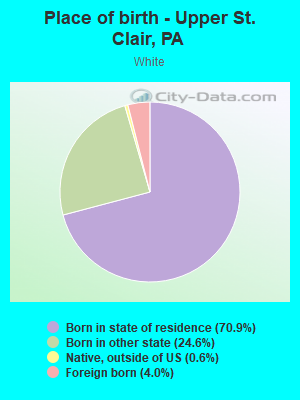
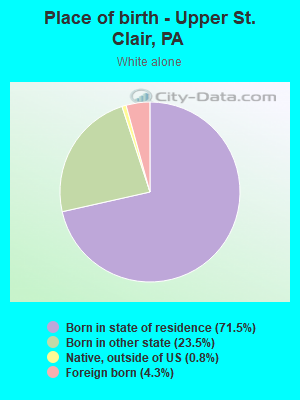
Place of birth - Born in state of residence (%) - White
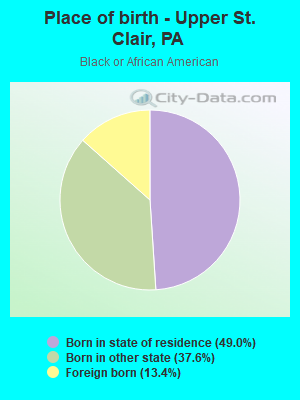
Place of birth - Born in state of residence (%) - Black or African American
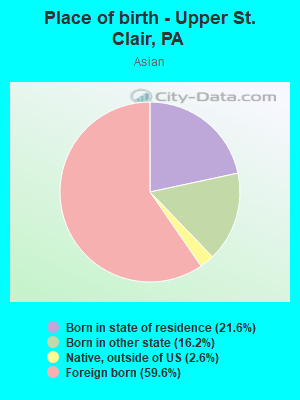
Place of birth - Born in state of residence (%) - Asian
Place of birth - Born in state of residence (%) - Hispanic or Latino
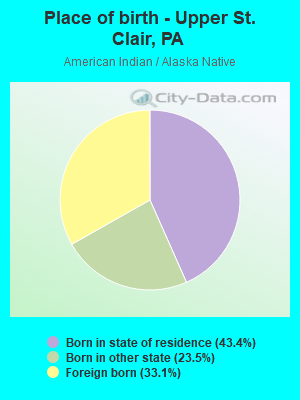
Place of birth - Born in state of residence (%) - American Indian and Alaska Native
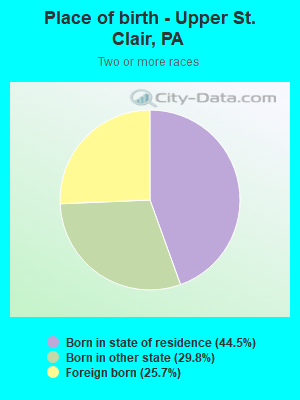
Place of birth - Born in state of residence (%) - Multirace
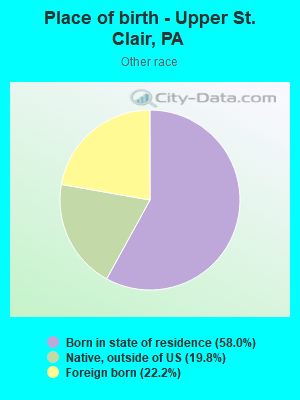
Place of birth - Born in state of residence (%) - Other Race
Place of birth - Born in other state (%)
Place of birth - Born in other state (%) - White
Place of birth - Born in other state (%) - Black or African American
Place of birth - Born in other state (%) - Asian
Place of birth - Born in other state (%) - Hispanic or Latino
Place of birth - Born in other state (%) - American Indian and Alaska Native
Place of birth - Born in other state (%) - Multirace
Place of birth - Born in other state (%) - Other Race
Place of birth - Native, outside of US (%)
Place of birth - Native, outside of US (%) - White
Place of birth - Native, outside of US (%) - Black or African American
Place of birth - Native, outside of US (%) - Asian
Place of birth - Native, outside of US (%) - Hispanic or Latino
Place of birth - Native, outside of US (%) - American Indian and Alaska Native
Place of birth - Native, outside of US (%) - Multirace
Place of birth - Native, outside of US (%) - Other Race
Place of birth - Foreign born (%)
Place of birth - Foreign born (%) - White
Place of birth - Foreign born (%) - Black or African American
Place of birth - Foreign born (%) - Asian
Place of birth - Foreign born (%) - Hispanic or Latino
Place of birth - Foreign born (%) - American Indian and Alaska Native
Place of birth - Foreign born (%) - Multirace
Place of birth - Foreign born (%) - Other Race
Residents speaking English at home (%)
Residents speaking English at home - Born in the United States (%)
Residents speaking English at home - Native, born elsewhere (%)
Residents speaking English at home - Foreign born (%)
Residents speaking Spanish at home (%)
Residents speaking Spanish at home - Born in the United States (%)
Residents speaking Spanish at home - Native, born elsewhere (%)
Residents speaking Spanish at home - Foreign born (%)
Residents speaking other language at home (%)
Residents speaking other language at home - Born in the United States (%)
Residents speaking other language at home - Native, born elsewhere (%)
Residents speaking other language at home - Foreign born (%)
Marital status - Never married (%)
Marital status - Now married (%)
Marital status - Separated (%)
Marital status - Widowed (%)
Marital status - Divorced (%)
Ancestries Reported - Arab (%)
Ancestries Reported - Czech (%)
Ancestries Reported - Danish (%)
Ancestries Reported - Dutch (%)
Ancestries Reported - English (%)
Ancestries Reported - French (%)
Ancestries Reported - French Canadian (%)
Ancestries Reported - German (%)
Ancestries Reported - Greek (%)
Ancestries Reported - Hungarian (%)
Ancestries Reported - Irish (%)
Ancestries Reported - Italian (%)
Ancestries Reported - Lithuanian (%)
Ancestries Reported - Norwegian (%)
Ancestries Reported - Polish (%)
Ancestries Reported - Portuguese (%)
Ancestries Reported - Russian (%)
Ancestries Reported - Scotch-Irish (%)
Ancestries Reported - Scottish (%)
Ancestries Reported - Slovak (%)
Ancestries Reported - Subsaharan African (%)
Ancestries Reported - Swedish (%)
Ancestries Reported - Swiss (%)
Ancestries Reported - Ukrainian (%)
Ancestries Reported - United States (%)
Ancestries Reported - Welsh (%)
Ancestries Reported - West Indian (%)
Ancestries Reported - Other (%)
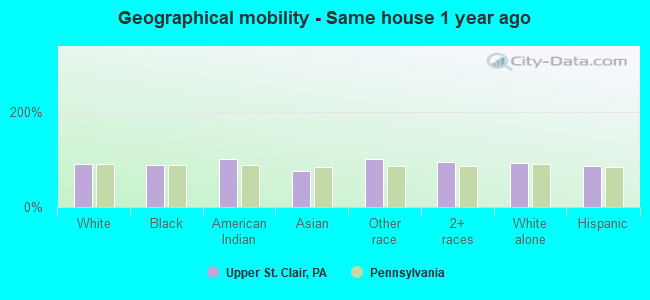
Geographical mobility - Same house 1 year ago (%)
Geographical mobility - Same house 1 year ago (%) - White
Geographical mobility - Same house 1 year ago (%) - Black or African American
Geographical mobility - Same house 1 year ago (%) - Asian
Geographical mobility - Same house 1 year ago (%) - Hispanic or Latino
Geographical mobility - Same house 1 year ago (%) - American Indian and Alaska Native
Geographical mobility - Same house 1 year ago (%) - Multirace
Geographical mobility - Same house 1 year ago (%) - Other Race
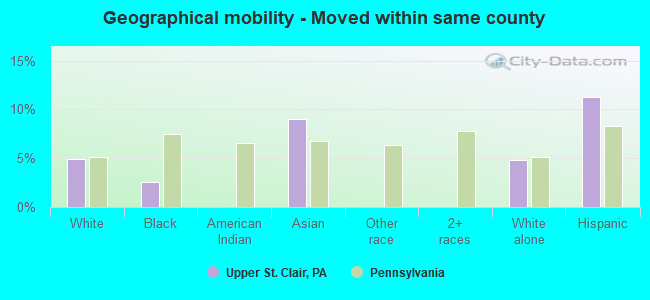
Geographical mobility - Moved within same county (%)
Geographical mobility - Moved within same county (%) - White
Geographical mobility - Moved within same county (%) - Black or African American
Geographical mobility - Moved within same county (%) - Asian
Geographical mobility - Moved within same county (%) - Hispanic or Latino
Geographical mobility - Moved within same county (%) - American Indian and Alaska Native
Geographical mobility - Moved within same county (%) - Multirace
Geographical mobility - Moved within same county (%) - Other Race
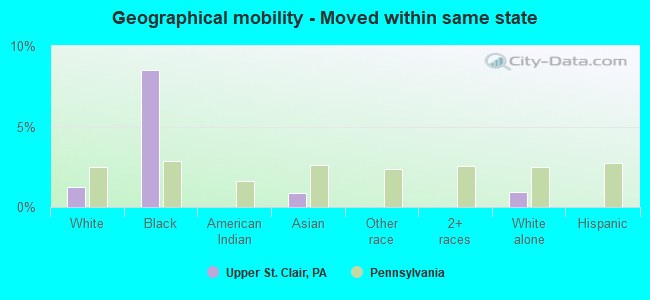
Geographical mobility - Moved from different county within same state (%)
Geographical mobility - Moved from different county within same state (%) - White
Geographical mobility - Moved from different county within same state (%) - Black or African American
Geographical mobility - Moved from different county within same state (%) - Asian
Geographical mobility - Moved from different county within same state (%) - Hispanic or Latino
Geographical mobility - Moved from different county within same state (%) - American Indian and Alaska Native
Geographical mobility - Moved from different county within same state (%) - Multirace
Geographical mobility - Moved from different county within same state (%) - Other Race
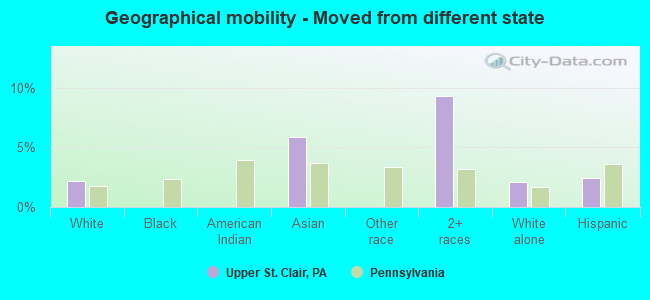
Geographical mobility - Moved from different state (%)
Geographical mobility - Moved from different state (%) - White
Geographical mobility - Moved from different state (%) - Black or African American
Geographical mobility - Moved from different state (%) - Asian
Geographical mobility - Moved from different state (%) - Hispanic or Latino
Geographical mobility - Moved from different state (%) - American Indian and Alaska Native
Geographical mobility - Moved from different state (%) - Multirace
Geographical mobility - Moved from different state (%) - Other Race
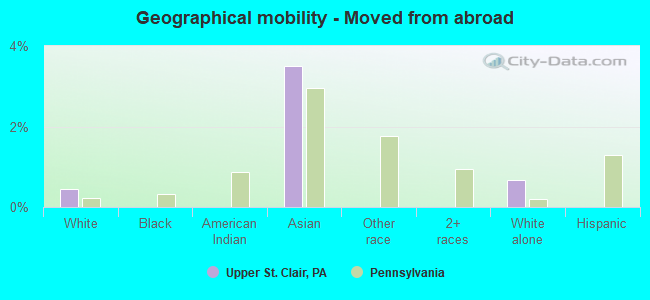
Geographical mobility - Moved from abroad (%)
Geographical mobility - Moved from abroad (%) - White
Geographical mobility - Moved from abroad (%) - Black or African American
Geographical mobility - Moved from abroad (%) - Asian
Geographical mobility - Moved from abroad (%) - Hispanic or Latino
Geographical mobility - Moved from abroad (%) - American Indian and Alaska Native
Geographical mobility - Moved from abroad (%) - Multirace
Geographical mobility - Moved from abroad (%) - Other Race
Place of birth for the foreign-born population - Ireland (%)
Place of birth for the foreign-born population - Denmark (%)
Place of birth for the foreign-born population - Norway (%)
Place of birth for the foreign-born population - Sweden (%)
Place of birth for the foreign-born population - United Kingdom (%)
Place of birth for the foreign-born population - England (%)
Place of birth for the foreign-born population - Scotland (%)
Place of birth for the foreign-born population - Other Northern Europe (%)
Place of birth for the foreign-born population - Austria (%)
Place of birth for the foreign-born population - Belgium (%)
Place of birth for the foreign-born population - France (%)
Place of birth for the foreign-born population - Germany (%)
Place of birth for the foreign-born population - Netherlands (%)
Place of birth for the foreign-born population - Switzerland (%)
Place of birth for the foreign-born population - Other Western Europe (%)
Place of birth for the foreign-born population - Greece (%)
Place of birth for the foreign-born population - Italy (%)
Place of birth for the foreign-born population - Portugal (%)
Place of birth for the foreign-born population - Spain (%)
Place of birth for the foreign-born population - Other Southern Europe (%)
Place of birth for the foreign-born population - Albania (%)
Place of birth for the foreign-born population - Belarus (%)
Place of birth for the foreign-born population - Bosnia and Herzegovina (%)
Place of birth for the foreign-born population - Bulgaria (%)
Place of birth for the foreign-born population - Croatia (%)
Place of birth for the foreign-born population - Czechoslovakia (%)
Place of birth for the foreign-born population - Hungary (%)
Place of birth for the foreign-born population - Latvia (%)
Place of birth for the foreign-born population - Lithuania (%)
Place of birth for the foreign-born population - North Macedonia (Macedonia) (%)
Place of birth for the foreign-born population - Moldova (%)
Place of birth for the foreign-born population - Poland (%)
Place of birth for the foreign-born population - Romania (%)
Place of birth for the foreign-born population - Russia (%)
Place of birth for the foreign-born population - Serbia (%)
Place of birth for the foreign-born population - Ukraine (%)
Place of birth for the foreign-born population - Other Eastern Europe (%)
Place of birth for the foreign-born population - China (%)
Place of birth for the foreign-born population - Hong Kong (%)
Place of birth for the foreign-born population - Taiwan (%)
Place of birth for the foreign-born population - Japan (%)
Place of birth for the foreign-born population - Korea (%)
Place of birth for the foreign-born population - Other Eastern Asia (%)
Place of birth for the foreign-born population - Afghanistan (%)
Place of birth for the foreign-born population - Bangladesh (%)
Place of birth for the foreign-born population - India (%)
Place of birth for the foreign-born population - Iran (%)
Place of birth for the foreign-born population - Kazakhstan (%)
Place of birth for the foreign-born population - Nepal (%)
Place of birth for the foreign-born population - Pakistan (%)
Place of birth for the foreign-born population - Sri Lanka (%)
Place of birth for the foreign-born population - Uzbekistan (%)
Place of birth for the foreign-born population - Other South Central Asia (%)
Place of birth for the foreign-born population - Burma (%)
Place of birth for the foreign-born population - Cambodia (%)
Place of birth for the foreign-born population - Indonesia (%)
Place of birth for the foreign-born population - Laos (%)
Place of birth for the foreign-born population - Malaysia (%)
Place of birth for the foreign-born population - Philippines (%)
Place of birth for the foreign-born population - Singapore (%)
Place of birth for the foreign-born population - Thailand (%)
Place of birth for the foreign-born population - Vietnam (%)
Place of birth for the foreign-born population - Other South Eastern Asia (%)
Place of birth for the foreign-born population - Armenia (%)
Place of birth for the foreign-born population - Iraq (%)
Place of birth for the foreign-born population - Israel (%)
Place of birth for the foreign-born population - Jordan (%)
Place of birth for the foreign-born population - Kuwait (%)
Place of birth for the foreign-born population - Lebanon (%)
Place of birth for the foreign-born population - Saudi Arabia (%)
Place of birth for the foreign-born population - Syria (%)
Place of birth for the foreign-born population - Turkey (%)
Place of birth for the foreign-born population - Yemen (%)
Place of birth for the foreign-born population - Other Western Asia (%)
Place of birth for the foreign-born population - Eritrea (%)
Place of birth for the foreign-born population - Ethiopia (%)
Place of birth for the foreign-born population - Kenya (%)
Place of birth for the foreign-born population - Somalia (%)
Place of birth for the foreign-born population - Uganda (%)
Place of birth for the foreign-born population - Zimbabwe (%)
Place of birth for the foreign-born population - Other Eastern Africa (%)
Place of birth for the foreign-born population - Cameroon (%)
Place of birth for the foreign-born population - Congo (%)
Place of birth for the foreign-born population - Democratic Republic of Congo (Zaire) (%)
Place of birth for the foreign-born population - Other Middle Africa (%)
Place of birth for the foreign-born population - Egypt (%)
Place of birth for the foreign-born population - Morocco (%)
Place of birth for the foreign-born population - Sudan (%)
Place of birth for the foreign-born population - Other Northern Africa (%)
Place of birth for the foreign-born population - South Africa (%)
Place of birth for the foreign-born population - Other Southern Africa (%)
Place of birth for the foreign-born population - Cabo Verde (%)
Place of birth for the foreign-born population - Ghana (%)
Place of birth for the foreign-born population - Liberia (%)
Place of birth for the foreign-born population - Nigeria (%)
Place of birth for the foreign-born population - Senegal (%)
Place of birth for the foreign-born population - Sierra Leone (%)
Place of birth for the foreign-born population - Other Western Africa (%)
Place of birth for the foreign-born population - Australia (%)
Place of birth for the foreign-born population - New Zealand (%)
Place of birth for the foreign-born population - Fiji (%)
Place of birth for the foreign-born population - Micronesia (%)
Place of birth for the foreign-born population - Bahamas (%)
Place of birth for the foreign-born population - Barbados (%)
Place of birth for the foreign-born population - Cuba (%)
Place of birth for the foreign-born population - Dominica (%)
Place of birth for the foreign-born population - Dominican Republic (%)
Place of birth for the foreign-born population - Grenada (%)
Place of birth for the foreign-born population - Haiti (%)
Place of birth for the foreign-born population - Jamaica (%)
Place of birth for the foreign-born population - St. Vincent and the Grenadines (%)
Place of birth for the foreign-born population - Trinidad and Tobago (%)
Place of birth for the foreign-born population - West Indies (%)
Place of birth for the foreign-born population - Other Caribbean (%)
Place of birth for the foreign-born population - Belize (%)
Place of birth for the foreign-born population - Costa Rica (%)
Place of birth for the foreign-born population - El Salvador (%)
Place of birth for the foreign-born population - Guatemala (%)
Place of birth for the foreign-born population - Honduras (%)
Place of birth for the foreign-born population - Mexico (%)
Place of birth for the foreign-born population - Nicaragua (%)
Place of birth for the foreign-born population - Panama (%)
Place of birth for the foreign-born population - Other Central America (%)
Place of birth for the foreign-born population - Argentina (%)
Place of birth for the foreign-born population - Bolivia (%)
Place of birth for the foreign-born population - Brazil (%)
Place of birth for the foreign-born population - Chile (%)
Place of birth for the foreign-born population - Colombia (%)
Place of birth for the foreign-born population - Ecuador (%)
Place of birth for the foreign-born population - Guyana (%)
Place of birth for the foreign-born population - Peru (%)
Place of birth for the foreign-born population - Uruguay (%)
Place of birth for the foreign-born population - Venezuela (%)
Place of birth for the foreign-born population - Other South America (%)
Place of birth for the foreign-born population - Canada (%)
Place of birth for the foreign-born population - Other Northern America (%)
Place of birth for the foreign-born population - Other (%)
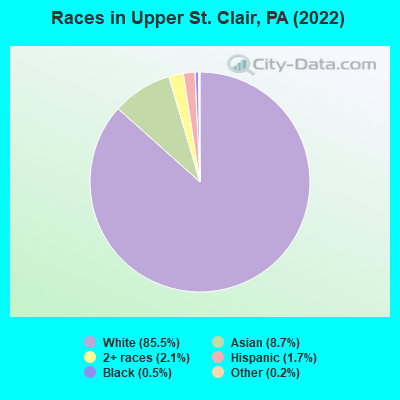
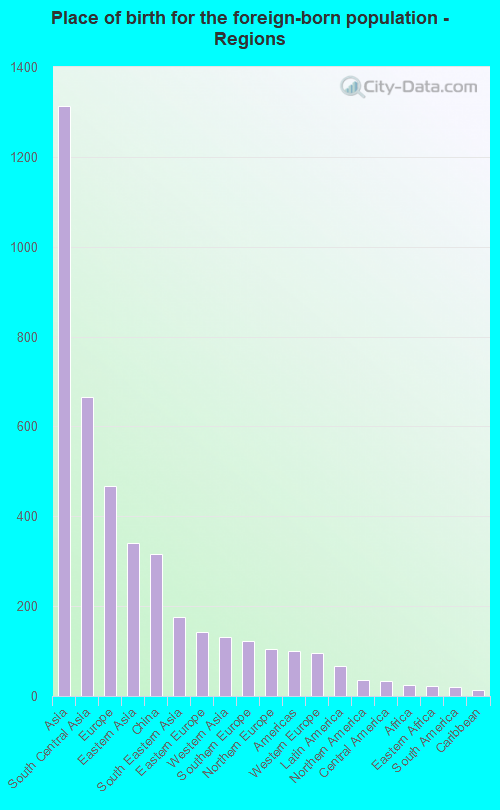
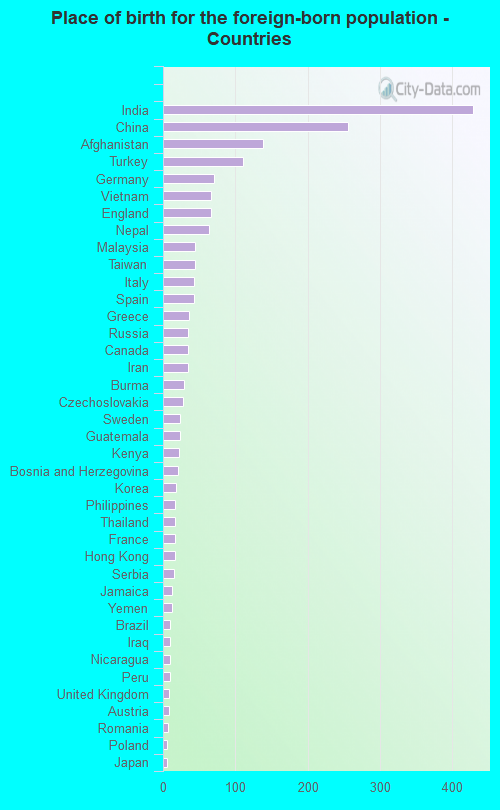
According to 2022 data, the most numerous races in Upper St. Clair, PA are White alone (17,150 residents), Black alone (103 residents), and Hispanic (351 residents). 87.9% of Upper St. Clair residents speak English at home. 9.6% of Upper St. Clair, PA residents are foreign-born (6.3% born in Asia, 2.3% born in Europe), which is 26.9% greater than the foreign-born rate of 7.0% across the entire state of Pennsylvania.
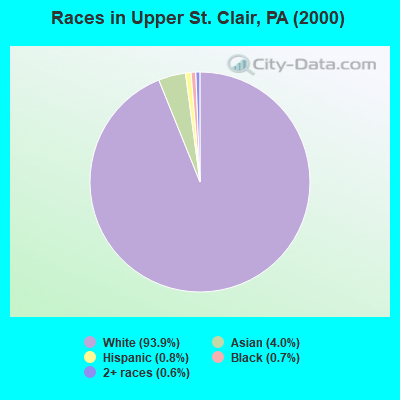
Race distribution in Upper St. Clair
2000 2022
10,322,455 84.1% White alone 1,202,437 9.8% Black alone 394,088 3.2% Hispanic 218,296 1.8% Asian alone 113,097 0.9% Two or more races 13,086 0.1% Other race alone 14,904 0.1% American Indian alone 2,691 0.02% Native Hawaiian and Other
9,487,228 73.1% White alone 1,311,581 10.1% Black alone 1,115,997 8.6% Hispanic 493,942 3.8% Two or more races 487,124 3.8% Asian alone 63,582 0.5% Other race alone 10,130 0.08% American Indian alone 2,424 0.02% Native Hawaiian and Other
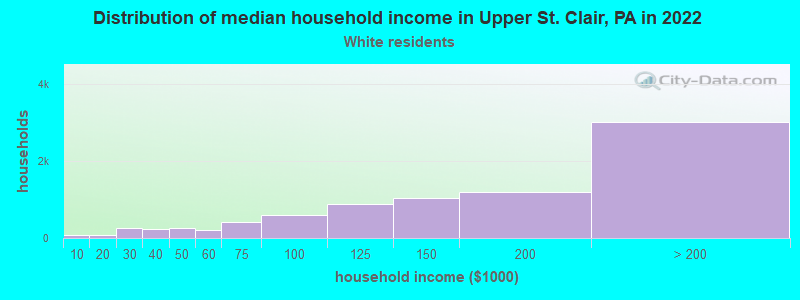
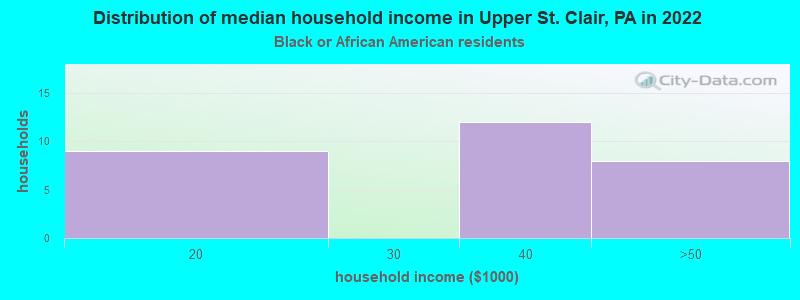
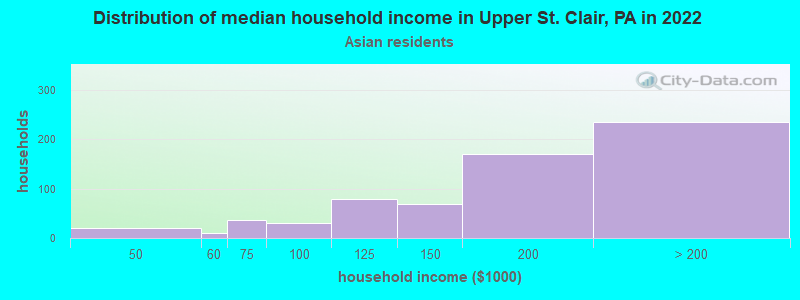
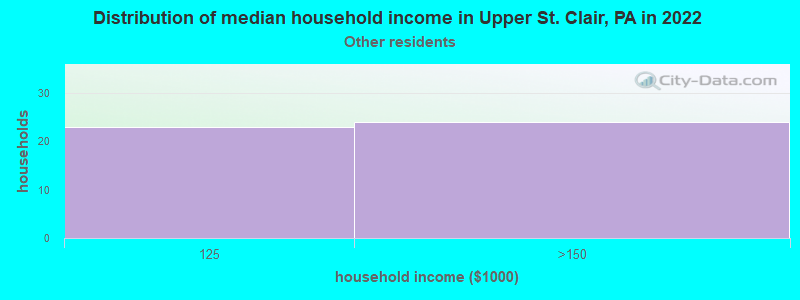
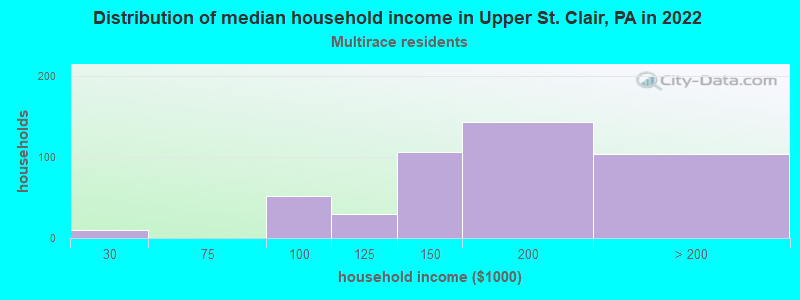
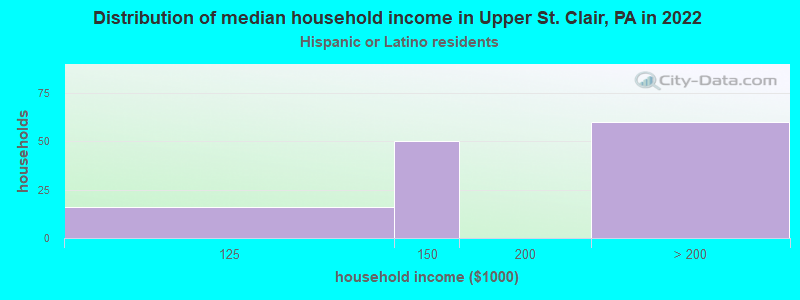
Income and house value in Upper St. Clair Median household income in 2022 $158,525 White non-Hispanic householders$47,762 Black householders$127,137 American Indian and Alaska Native householdersover $200,000 Asian householders$56,398 Some other race householdersover $200,000 Two or more races householdersover $200,000 Hispanic or Latino race householdersMedian 2022 house value $461,454 White Non-Hispanic householders$404,901 Black or African American householders$46,464 American Indian or Alaska Native householders $630,583 Asian householdersover $1,000,000 Some other race householders$344,365 Two or more races householders$572,968 Hispanic or Latino householders
Median age by race in Upper St. Clair
44.8 Median age for White residents44.2 45.3 48.7 Median age for Black or African American residents32.6 49.8 18.8 Median age for American Indian / Alaska Native residents43.4 Median age for Asian residents43.1 43.5 19.8 Median age for Other race residents20.7 18.3 30.8 Median age for Two or more races residents35.9 23.4 44.6 Median age for White alone residents43.8 45.3 28.3 Median age for Hispanic or Latino residents29.6 24.4
Owner/renter occupied households by race in Upper St. Clair
House owners and renters - White residents 5,950 90.0% Owner occupied662 10.0% Renter occupiedHouse owners and renters - Black or African American residents 29 100.0% Owner occupiedHouse owners and renters - Asian residents 535 95.9% Owner occupied23 4.1% Renter occupiedHouse owners and renters - Other race residents 33 100.0% Owner occupiedHouse owners and renters - Two or more races residents 277 100.0% Owner occupiedHouse owners and renters - White alone residents 5,967 89.9% Owner occupied672 10.1% Renter occupiedHouse owners and renters - Hispanic or Latino residents 55 84.6% Owner occupied10 15.4% Renter occupied
Language usage in Upper St. Clair
English speakers - Total 87.9% of residents of Upper St. Clair speak English at home.
0.7% of residents speak Spanish at home 141 100.0% Speak English very well11.1% of residents speak other language at home 1,531 72.5% Speak English very well581 27.5% Speak English less than very well
English speakers - Born in the United States 94.0% of residents of Upper St. Clair speak English at home.
0.4% of residents speak Spanish at home 17 100.0% Speak English very well5.3% of residents speak other language at home 240 100.0% Speak English very well
English speakers - Native, born elsewhere 77.2% of residents of Upper St. Clair speak English at home.
9.4% of residents speak Spanish at home 16 100.0% Speak English very well18.1% of residents speak other language at home 16 51.6% Speak English very well15 48.4% Speak English less than very well
English speakers - Foreign-born 19.3% of residents of Upper St. Clair speak English at home.
2.9% of residents speak Spanish at home 56 100.0% Speak English very well76.8% of residents speak other language at home 937 63.1% Speak English very well549 36.9% Speak English less than very well
White (Caucasian) - Speak only English Native:
98.6% (15,148)Foreign-born:
35.3% (232)
White (Caucasian) - Speak another language Native:
1.8% (284)Foreign-born:
66.0% (433)
Black or African American - Speak only English Native:
100.0% (100)Foreign-born:
57.0% (9)
American Indian / Alaska Native - Speak only English Native:
88.4% (13)Foreign-born:
75.9% (6)
Asian - Speak only English Native:
49.6% (271)Foreign-born:
6.4% (69)
Asian - Speak another language Native:
50.1% (274)Foreign-born:
95.1% (1,030)
Other race - Speak only English Native:
48.7% (48)Foreign-born:
31.5% (10)
Other race - Speak another language Native:
60.1% (60)Foreign-born:
58.3% (19)
Two or more races - Speak another language Native:
13.7% (66)Foreign-born:
100.0% (277)
White alone - Speak only English Native:
97.8% (15,085)Foreign-born:
32.0% (228)
White alone - Speak another language Native:
2.2% (337)Foreign-born:
68.3% (487)
Hispanic or Latino - Speak only English Native:
86.0% (209)Foreign-born:
30.6% (29)
Hispanic or Latino - Speak another language Native:
19.2% (47)Foreign-born:
69.4% (67)
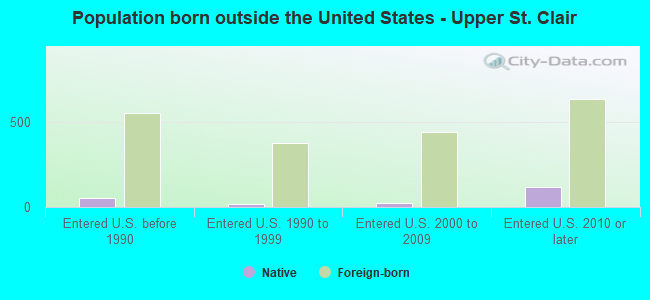
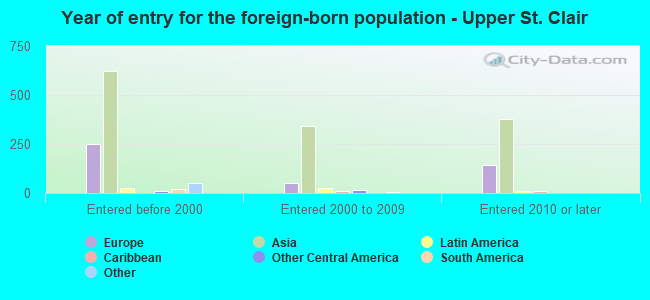
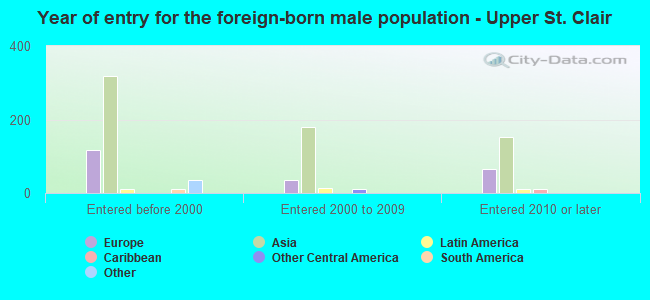
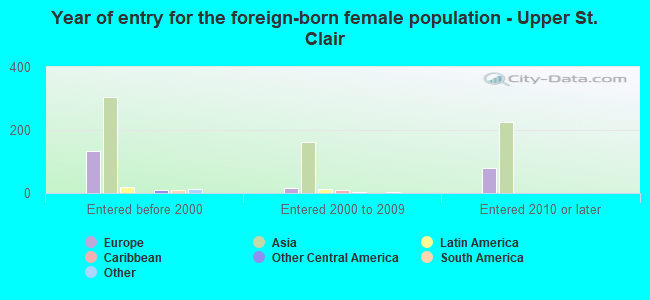
Foreign-born residents in Upper St. Clair 1,910 residents are foreign born (6.3% Asia , 2.3% Europe ).
This city:
9.6%Pennsylvania:
100.0%
Marital status for residents in Upper St. Clair Marital status - White (Caucasian) population 15 years and over
Males 21.8% Never married69.6% Now married0.5% Separated3.4% Widowed4.7% DivorcedFemales 17.7% Never married64.8% Now married0.8% Separated9.7% Widowed7.2% DivorcedWomen who gave birth in the past 12 months Now married:
82.0% (163)Unmarried:
18.0% (36)
Women who did not give birth in the past 12 months Now married:
59.8% (1,894)Unmarried:
40.2% (1,274)
Marital status - Black or African American population 15 years and over
Males 34.9% Never married50.8% Now married0.0% Separated0.0% Widowed14.3% DivorcedFemales 0.0% Never married24.1% Now married37.9% Separated37.9% Widowed0.0% DivorcedWomen who did not give birth in the past 12 months Now married:
100.0% (11)Unmarried:
0.0% (0)
Marital status - American Indian / Alaska Native population 15 years and over
Males 100.0% Never married0.0% Now married0.0% Separated0.0% Widowed0.0% DivorcedFemales 0.0% Never married100.0% Now married0.0% Separated0.0% Widowed0.0% DivorcedWomen who did not give birth in the past 12 months Now married:
100.0% (9)Unmarried:
0.0% (0)
Marital status - Asian population 15 years and over
Males 22.8% Never married77.2% Now married0.0% Separated0.0% Widowed0.0% DivorcedFemales 12.6% Never married80.3% Now married0.0% Separated2.0% Widowed5.1% DivorcedWomen who gave birth in the past 12 months Now married:
100.0% (31)Unmarried:
0.0% (0)
Women who did not give birth in the past 12 months Now married:
70.8% (257)Unmarried:
29.2% (106)
Marital status - Other race population 15 years and over
Males 42.9% Never married57.1% Now married0.0% Separated0.0% Widowed0.0% DivorcedFemales 57.1% Never married42.9% Now married0.0% Separated0.0% Widowed0.0% DivorcedWomen who did not give birth in the past 12 months Now married:
42.9% (16)Unmarried:
57.1% (22)
Marital status - Two or more races population 15 years and over
Males 45.7% Never married54.3% Now married0.0% Separated0.0% Widowed0.0% DivorcedFemales 32.8% Never married67.2% Now married0.0% Separated0.0% Widowed0.0% DivorcedWomen who did not give birth in the past 12 months Now married:
38.1% (21)Unmarried:
61.9% (33)
Marital status - White alone, not Hispanic / Latino population 15 years and over
Males 21.5% Never married69.8% Now married0.5% Separated3.4% Widowed4.8% DivorcedFemales 17.7% Never married64.6% Now married0.8% Separated9.7% Widowed7.2% DivorcedWomen who gave birth in the past 12 months Now married:
82.0% (166)Unmarried:
18.0% (36)
Women who did not give birth in the past 12 months Now married:
59.6% (1,897)Unmarried:
40.4% (1,287)
Marital status - Hispanic or Latino population 15 years and over
Males 44.7% Never married55.3% Now married0.0% Separated0.0% Widowed0.0% DivorcedFemales 22.7% Never married77.3% Now married0.0% Separated0.0% Widowed0.0% DivorcedWomen who did not give birth in the past 12 months Now married:
64.5% (50)Unmarried:
35.5% (28)
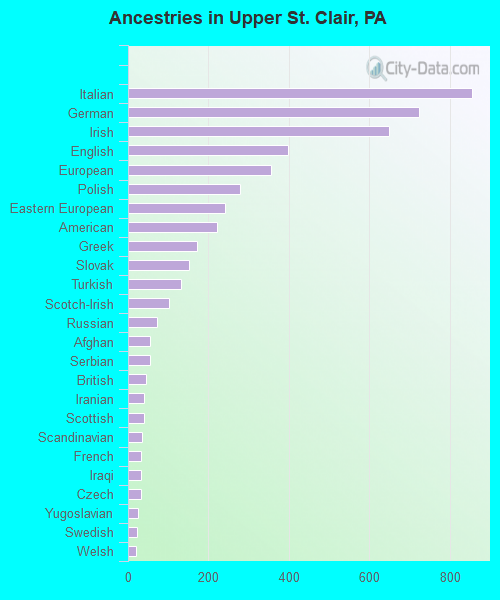
Ancestries in Upper St. Clair
855 12.3% Italian724 10.4% German648 9.3% Irish399 5.7% English355 5.1% European278 4.0% Polish240 3.4% Eastern European222 3.2% American172 2.5% Greek152 2.2% Slovak131 1.9% Turkish101 1.5% Scotch-Irish73 1.0% Russian55 0.8% Afghan55 0.8% Serbian46 0.7% British41 0.6% Iranian39 0.6% Scottish34 0.5% Scandinavian33 0.5% French32 0.5% Iraqi32 0.5% Czech26 0.4% Yugoslavian23 0.3% Swedish21 0.3% Welsh20 0.3% Ukrainian18 0.3% Hungarian16 0.2% Northern European14 0.2% Czechoslovakian14 0.2% Croatian14 0.2% Jamaican12 0.2% Pennsylvania German12 0.2% Basque12 0.2% Austrian11 0.2% Slavic8 0.1% Slovene7 0.1% Danish7 0.1% Celtic7 0.1% Swiss6 0.09% French Canadian6 0.09% Finnish6 0.09% Lithuanian5 0.07% Canadian4 0.06% Guyanese3 0.04% Armenian
Children Nativity (place of birth) in Upper St. Clair
Children under 6 years - Living with two parents Both parents native 1,004 100.0% NativeBoth parents foreign-born 93 86.3% Native15 13.7% Foreign-bornOne native, one foreign-born parent 77 100.0% NativeChildren under 6 years - Living with one parent Native parent 74 100.0% NativeForeign-born parent 27 100.0% NativeChildren 6 to 17 years - Living with two parents Both parents native 2,419 99.9% Native3 0.1% Foreign-bornBoth parents foreign-born 310 70.7% Native128 29.3% Foreign-bornOne native, one foreign-born parent 278 100.0% NativeChildren 6 to 17 years - Living with one parent Native parent 499 100.0% NativeForeign-born parent 114 48.9% Native119 51.1% Foreign-born
Grandparents responsible for own grandchildren in Upper St. Clair
Grandparents (30 to 59 years) White / Caucasian 10 100.0% Responsible for grandchildrenWhite alone, not Hispanic / Latino 10 100.0% Responsible for grandchildrenGrandparents (60 years and over) White / Caucasian 24 14.5% Responsible for grandchildren140 85.5% Not responsible for grandchildrenWhite alone, not Hispanic / Latino 24 14.5% Responsible for grandchildren144 85.5% Not responsible for grandchildren