Races in Valley City, North Dakota (ND) Detailed Stats
Data:
Races - White alone (%)
Races - White alone (% change since 2000)
Races - Black alone (%)
Races - Black alone (% change since 2000)
Races - American Indian alone (%)
Races - American Indian alone (% change since 2000)
Races - Asian alone (%)
Races - Asian alone (% change since 2000)
Races - Hispanic (%)
Races - Hispanic (% change since 2000)
Races - Native Hawaiian and Other Pacific Islander alone (%)
Races - Native Hawaiian and Other Pacific Islander alone (% change since 2000)
Races - Two or more races(%)
Races - Two or more races(% change since 2000)
Races - Other race alone (%)
Races - Other race alone (% change since 2000)
Racial diversity
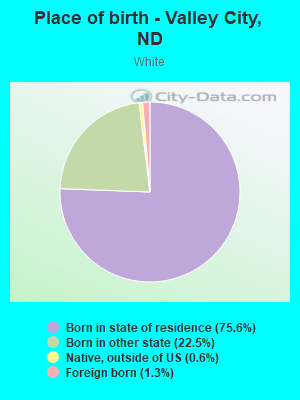
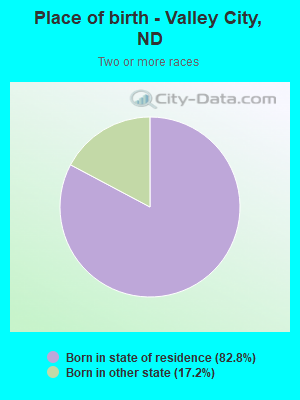
Place of birth - Born in state of residence (%)
Place of birth - Born in state of residence (%) - White
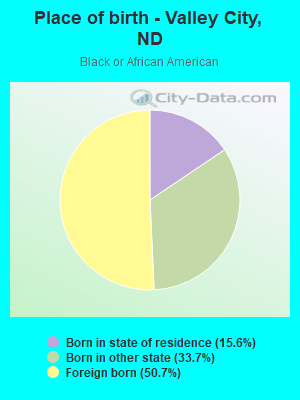
Place of birth - Born in state of residence (%) - Black or African American
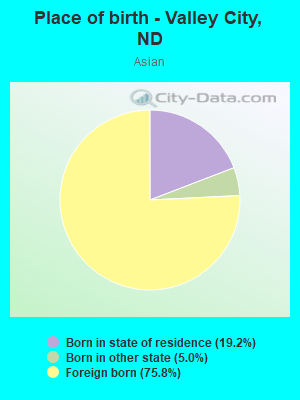
Place of birth - Born in state of residence (%) - Asian
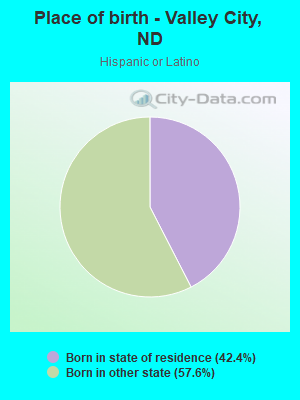
Place of birth - Born in state of residence (%) - Hispanic or Latino
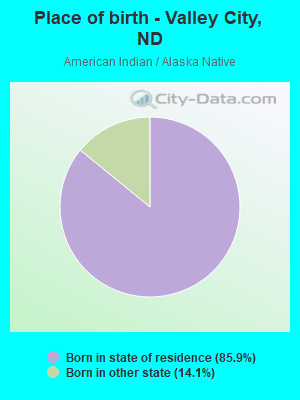
Place of birth - Born in state of residence (%) - American Indian and Alaska Native
Place of birth - Born in state of residence (%) - Multirace
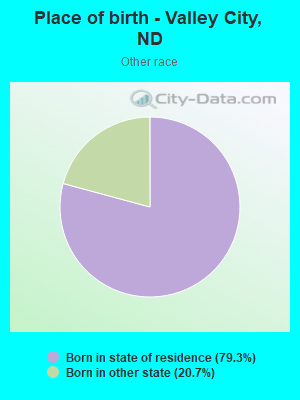
Place of birth - Born in state of residence (%) - Other Race
Place of birth - Born in other state (%)
Place of birth - Born in other state (%) - White
Place of birth - Born in other state (%) - Black or African American
Place of birth - Born in other state (%) - Asian
Place of birth - Born in other state (%) - Hispanic or Latino
Place of birth - Born in other state (%) - American Indian and Alaska Native
Place of birth - Born in other state (%) - Multirace
Place of birth - Born in other state (%) - Other Race
Place of birth - Native, outside of US (%)
Place of birth - Native, outside of US (%) - White
Place of birth - Native, outside of US (%) - Black or African American
Place of birth - Native, outside of US (%) - Asian
Place of birth - Native, outside of US (%) - Hispanic or Latino
Place of birth - Native, outside of US (%) - American Indian and Alaska Native
Place of birth - Native, outside of US (%) - Multirace
Place of birth - Native, outside of US (%) - Other Race
Place of birth - Foreign born (%)
Place of birth - Foreign born (%) - White
Place of birth - Foreign born (%) - Black or African American
Place of birth - Foreign born (%) - Asian
Place of birth - Foreign born (%) - Hispanic or Latino
Place of birth - Foreign born (%) - American Indian and Alaska Native
Place of birth - Foreign born (%) - Multirace
Place of birth - Foreign born (%) - Other Race
Residents speaking English at home (%)
Residents speaking English at home - Born in the United States (%)
Residents speaking English at home - Native, born elsewhere (%)
Residents speaking English at home - Foreign born (%)
Residents speaking Spanish at home (%)
Residents speaking Spanish at home - Born in the United States (%)
Residents speaking Spanish at home - Native, born elsewhere (%)
Residents speaking Spanish at home - Foreign born (%)
Residents speaking other language at home (%)
Residents speaking other language at home - Born in the United States (%)
Residents speaking other language at home - Native, born elsewhere (%)
Residents speaking other language at home - Foreign born (%)
Marital status - Never married (%)
Marital status - Now married (%)
Marital status - Separated (%)
Marital status - Widowed (%)
Marital status - Divorced (%)
Ancestries Reported - Arab (%)
Ancestries Reported - Czech (%)
Ancestries Reported - Danish (%)
Ancestries Reported - Dutch (%)
Ancestries Reported - English (%)
Ancestries Reported - French (%)
Ancestries Reported - French Canadian (%)
Ancestries Reported - German (%)
Ancestries Reported - Greek (%)
Ancestries Reported - Hungarian (%)
Ancestries Reported - Irish (%)
Ancestries Reported - Italian (%)
Ancestries Reported - Lithuanian (%)
Ancestries Reported - Norwegian (%)
Ancestries Reported - Polish (%)
Ancestries Reported - Portuguese (%)
Ancestries Reported - Russian (%)
Ancestries Reported - Scotch-Irish (%)
Ancestries Reported - Scottish (%)
Ancestries Reported - Slovak (%)
Ancestries Reported - Subsaharan African (%)
Ancestries Reported - Swedish (%)
Ancestries Reported - Swiss (%)
Ancestries Reported - Ukrainian (%)
Ancestries Reported - United States (%)
Ancestries Reported - Welsh (%)
Ancestries Reported - West Indian (%)
Ancestries Reported - Other (%)
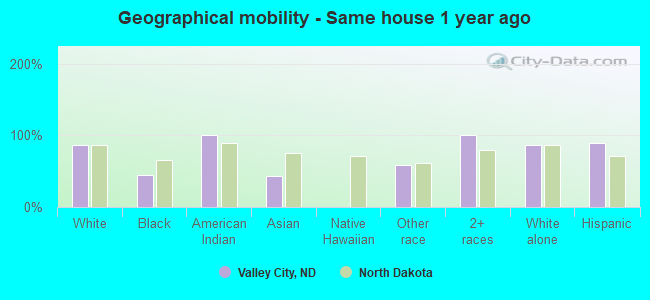
Geographical mobility - Same house 1 year ago (%)
Geographical mobility - Same house 1 year ago (%) - White
Geographical mobility - Same house 1 year ago (%) - Black or African American
Geographical mobility - Same house 1 year ago (%) - Asian
Geographical mobility - Same house 1 year ago (%) - Hispanic or Latino
Geographical mobility - Same house 1 year ago (%) - American Indian and Alaska Native
Geographical mobility - Same house 1 year ago (%) - Multirace
Geographical mobility - Same house 1 year ago (%) - Other Race
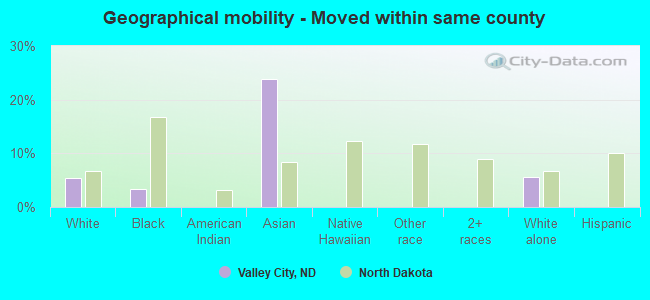
Geographical mobility - Moved within same county (%)
Geographical mobility - Moved within same county (%) - White
Geographical mobility - Moved within same county (%) - Black or African American
Geographical mobility - Moved within same county (%) - Asian
Geographical mobility - Moved within same county (%) - Hispanic or Latino
Geographical mobility - Moved within same county (%) - American Indian and Alaska Native
Geographical mobility - Moved within same county (%) - Multirace
Geographical mobility - Moved within same county (%) - Other Race
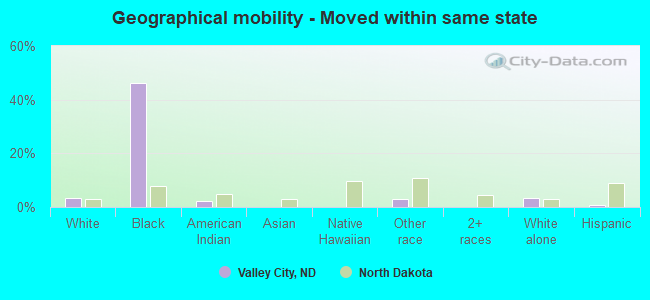
Geographical mobility - Moved from different county within same state (%)
Geographical mobility - Moved from different county within same state (%) - White
Geographical mobility - Moved from different county within same state (%) - Black or African American
Geographical mobility - Moved from different county within same state (%) - Asian
Geographical mobility - Moved from different county within same state (%) - Hispanic or Latino
Geographical mobility - Moved from different county within same state (%) - American Indian and Alaska Native
Geographical mobility - Moved from different county within same state (%) - Multirace
Geographical mobility - Moved from different county within same state (%) - Other Race
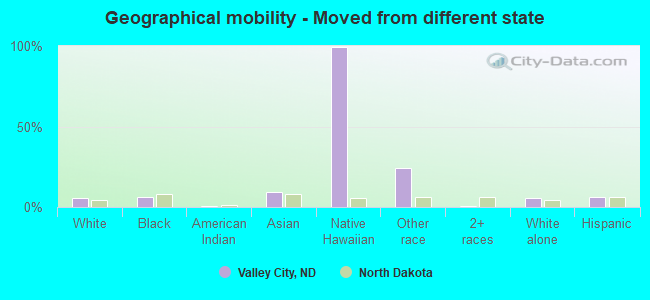
Geographical mobility - Moved from different state (%)
Geographical mobility - Moved from different state (%) - White
Geographical mobility - Moved from different state (%) - Black or African American
Geographical mobility - Moved from different state (%) - Asian
Geographical mobility - Moved from different state (%) - Hispanic or Latino
Geographical mobility - Moved from different state (%) - American Indian and Alaska Native
Geographical mobility - Moved from different state (%) - Multirace
Geographical mobility - Moved from different state (%) - Other Race
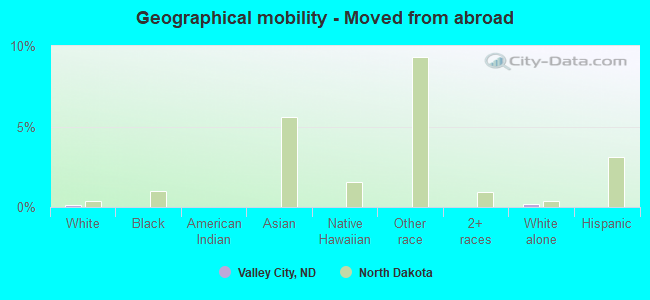
Geographical mobility - Moved from abroad (%)
Geographical mobility - Moved from abroad (%) - White
Geographical mobility - Moved from abroad (%) - Black or African American
Geographical mobility - Moved from abroad (%) - Asian
Geographical mobility - Moved from abroad (%) - Hispanic or Latino
Geographical mobility - Moved from abroad (%) - American Indian and Alaska Native
Geographical mobility - Moved from abroad (%) - Multirace
Geographical mobility - Moved from abroad (%) - Other Race
Place of birth for the foreign-born population - Ireland (%)
Place of birth for the foreign-born population - Denmark (%)
Place of birth for the foreign-born population - Norway (%)
Place of birth for the foreign-born population - Sweden (%)
Place of birth for the foreign-born population - United Kingdom (%)
Place of birth for the foreign-born population - England (%)
Place of birth for the foreign-born population - Scotland (%)
Place of birth for the foreign-born population - Other Northern Europe (%)
Place of birth for the foreign-born population - Austria (%)
Place of birth for the foreign-born population - Belgium (%)
Place of birth for the foreign-born population - France (%)
Place of birth for the foreign-born population - Germany (%)
Place of birth for the foreign-born population - Netherlands (%)
Place of birth for the foreign-born population - Switzerland (%)
Place of birth for the foreign-born population - Other Western Europe (%)
Place of birth for the foreign-born population - Greece (%)
Place of birth for the foreign-born population - Italy (%)
Place of birth for the foreign-born population - Portugal (%)
Place of birth for the foreign-born population - Spain (%)
Place of birth for the foreign-born population - Other Southern Europe (%)
Place of birth for the foreign-born population - Albania (%)
Place of birth for the foreign-born population - Belarus (%)
Place of birth for the foreign-born population - Bosnia and Herzegovina (%)
Place of birth for the foreign-born population - Bulgaria (%)
Place of birth for the foreign-born population - Croatia (%)
Place of birth for the foreign-born population - Czechoslovakia (%)
Place of birth for the foreign-born population - Hungary (%)
Place of birth for the foreign-born population - Latvia (%)
Place of birth for the foreign-born population - Lithuania (%)
Place of birth for the foreign-born population - North Macedonia (Macedonia) (%)
Place of birth for the foreign-born population - Moldova (%)
Place of birth for the foreign-born population - Poland (%)
Place of birth for the foreign-born population - Romania (%)
Place of birth for the foreign-born population - Russia (%)
Place of birth for the foreign-born population - Serbia (%)
Place of birth for the foreign-born population - Ukraine (%)
Place of birth for the foreign-born population - Other Eastern Europe (%)
Place of birth for the foreign-born population - China (%)
Place of birth for the foreign-born population - Hong Kong (%)
Place of birth for the foreign-born population - Taiwan (%)
Place of birth for the foreign-born population - Japan (%)
Place of birth for the foreign-born population - Korea (%)
Place of birth for the foreign-born population - Other Eastern Asia (%)
Place of birth for the foreign-born population - Afghanistan (%)
Place of birth for the foreign-born population - Bangladesh (%)
Place of birth for the foreign-born population - India (%)
Place of birth for the foreign-born population - Iran (%)
Place of birth for the foreign-born population - Kazakhstan (%)
Place of birth for the foreign-born population - Nepal (%)
Place of birth for the foreign-born population - Pakistan (%)
Place of birth for the foreign-born population - Sri Lanka (%)
Place of birth for the foreign-born population - Uzbekistan (%)
Place of birth for the foreign-born population - Other South Central Asia (%)
Place of birth for the foreign-born population - Burma (%)
Place of birth for the foreign-born population - Cambodia (%)
Place of birth for the foreign-born population - Indonesia (%)
Place of birth for the foreign-born population - Laos (%)
Place of birth for the foreign-born population - Malaysia (%)
Place of birth for the foreign-born population - Philippines (%)
Place of birth for the foreign-born population - Singapore (%)
Place of birth for the foreign-born population - Thailand (%)
Place of birth for the foreign-born population - Vietnam (%)
Place of birth for the foreign-born population - Other South Eastern Asia (%)
Place of birth for the foreign-born population - Armenia (%)
Place of birth for the foreign-born population - Iraq (%)
Place of birth for the foreign-born population - Israel (%)
Place of birth for the foreign-born population - Jordan (%)
Place of birth for the foreign-born population - Kuwait (%)
Place of birth for the foreign-born population - Lebanon (%)
Place of birth for the foreign-born population - Saudi Arabia (%)
Place of birth for the foreign-born population - Syria (%)
Place of birth for the foreign-born population - Turkey (%)
Place of birth for the foreign-born population - Yemen (%)
Place of birth for the foreign-born population - Other Western Asia (%)
Place of birth for the foreign-born population - Eritrea (%)
Place of birth for the foreign-born population - Ethiopia (%)
Place of birth for the foreign-born population - Kenya (%)
Place of birth for the foreign-born population - Somalia (%)
Place of birth for the foreign-born population - Uganda (%)
Place of birth for the foreign-born population - Zimbabwe (%)
Place of birth for the foreign-born population - Other Eastern Africa (%)
Place of birth for the foreign-born population - Cameroon (%)
Place of birth for the foreign-born population - Congo (%)
Place of birth for the foreign-born population - Democratic Republic of Congo (Zaire) (%)
Place of birth for the foreign-born population - Other Middle Africa (%)
Place of birth for the foreign-born population - Egypt (%)
Place of birth for the foreign-born population - Morocco (%)
Place of birth for the foreign-born population - Sudan (%)
Place of birth for the foreign-born population - Other Northern Africa (%)
Place of birth for the foreign-born population - South Africa (%)
Place of birth for the foreign-born population - Other Southern Africa (%)
Place of birth for the foreign-born population - Cabo Verde (%)
Place of birth for the foreign-born population - Ghana (%)
Place of birth for the foreign-born population - Liberia (%)
Place of birth for the foreign-born population - Nigeria (%)
Place of birth for the foreign-born population - Senegal (%)
Place of birth for the foreign-born population - Sierra Leone (%)
Place of birth for the foreign-born population - Other Western Africa (%)
Place of birth for the foreign-born population - Australia (%)
Place of birth for the foreign-born population - New Zealand (%)
Place of birth for the foreign-born population - Fiji (%)
Place of birth for the foreign-born population - Micronesia (%)
Place of birth for the foreign-born population - Bahamas (%)
Place of birth for the foreign-born population - Barbados (%)
Place of birth for the foreign-born population - Cuba (%)
Place of birth for the foreign-born population - Dominica (%)
Place of birth for the foreign-born population - Dominican Republic (%)
Place of birth for the foreign-born population - Grenada (%)
Place of birth for the foreign-born population - Haiti (%)
Place of birth for the foreign-born population - Jamaica (%)
Place of birth for the foreign-born population - St. Vincent and the Grenadines (%)
Place of birth for the foreign-born population - Trinidad and Tobago (%)
Place of birth for the foreign-born population - West Indies (%)
Place of birth for the foreign-born population - Other Caribbean (%)
Place of birth for the foreign-born population - Belize (%)
Place of birth for the foreign-born population - Costa Rica (%)
Place of birth for the foreign-born population - El Salvador (%)
Place of birth for the foreign-born population - Guatemala (%)
Place of birth for the foreign-born population - Honduras (%)
Place of birth for the foreign-born population - Mexico (%)
Place of birth for the foreign-born population - Nicaragua (%)
Place of birth for the foreign-born population - Panama (%)
Place of birth for the foreign-born population - Other Central America (%)
Place of birth for the foreign-born population - Argentina (%)
Place of birth for the foreign-born population - Bolivia (%)
Place of birth for the foreign-born population - Brazil (%)
Place of birth for the foreign-born population - Chile (%)
Place of birth for the foreign-born population - Colombia (%)
Place of birth for the foreign-born population - Ecuador (%)
Place of birth for the foreign-born population - Guyana (%)
Place of birth for the foreign-born population - Peru (%)
Place of birth for the foreign-born population - Uruguay (%)
Place of birth for the foreign-born population - Venezuela (%)
Place of birth for the foreign-born population - Other South America (%)
Place of birth for the foreign-born population - Canada (%)
Place of birth for the foreign-born population - Other Northern America (%)
Place of birth for the foreign-born population - Other (%)
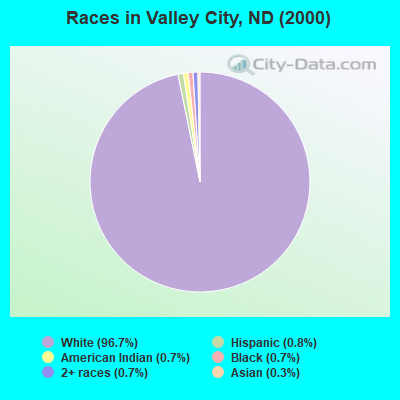
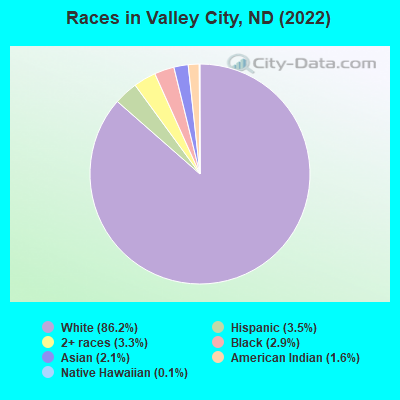
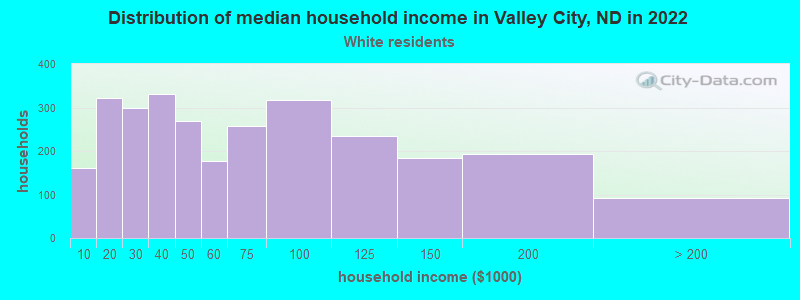
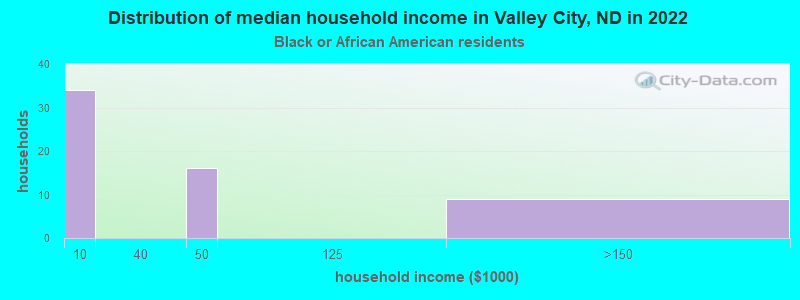
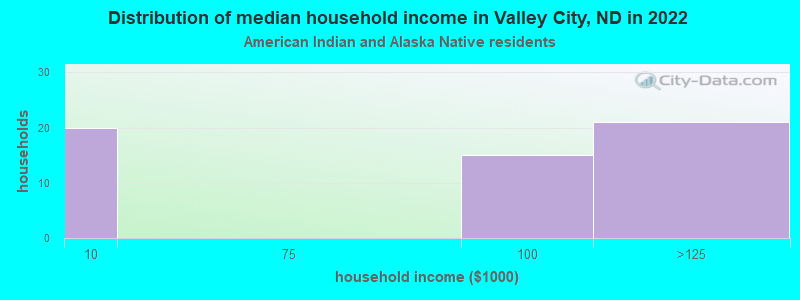
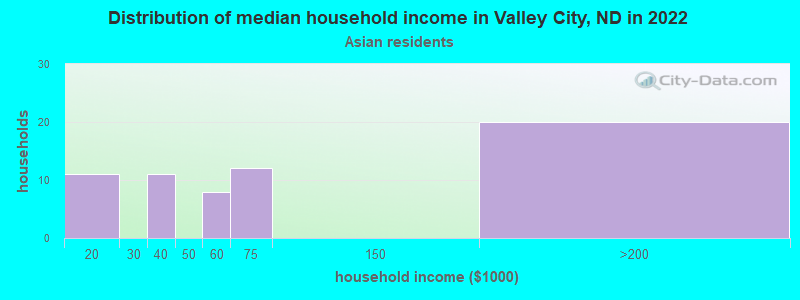
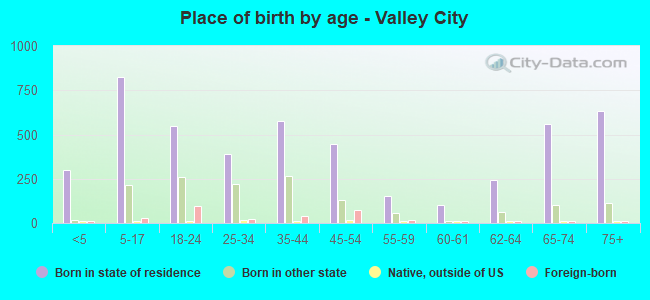
According to 2022 data, the most numerous races in Valley City, ND are White alone (5,668 residents), Hispanic (228 residents), and American Indian alone (107 residents). 94.9% of Valley City residents speak English at home. 4.5% of Valley City, ND residents are foreign-born (1.7% born in Asia, 1.3% born in Africa, 0.7% born in North America), which is 10.8% greater than the foreign-born rate of 4.0% across the entire state of North Dakota.
Race distribution in Valley City
2000 2022
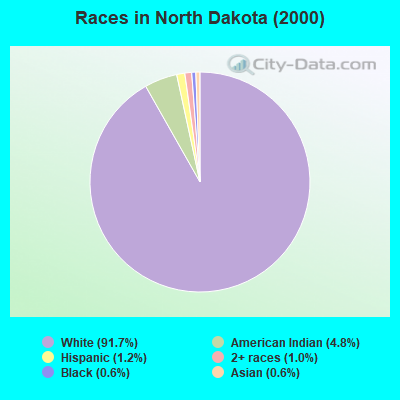
589,149 91.7% White alone 30,772 4.8% American Indian alone 7,786 1.2% Hispanic 6,666 1.0% Two or more races 3,761 0.6% Black alone 3,566 0.6% Asian alone 282 0.04% Other race alone 218 0.03% Native Hawaiian and Other
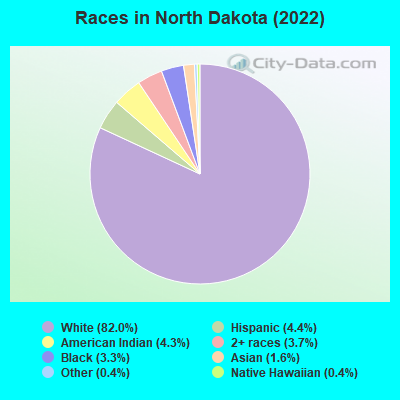
639,297 82.0% White alone 34,233 4.4% Hispanic 33,252 4.3% American Indian alone 28,831 3.7% Two or more races 25,426 3.3% Black alone 12,271 1.6% Asian alone 3,206 0.4% Other race alone 2,745 0.4% Native Hawaiian and Other
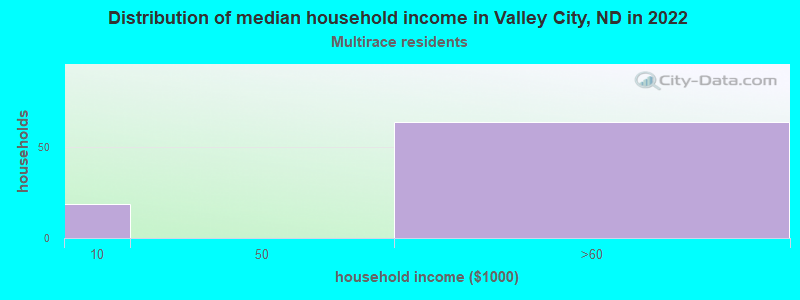
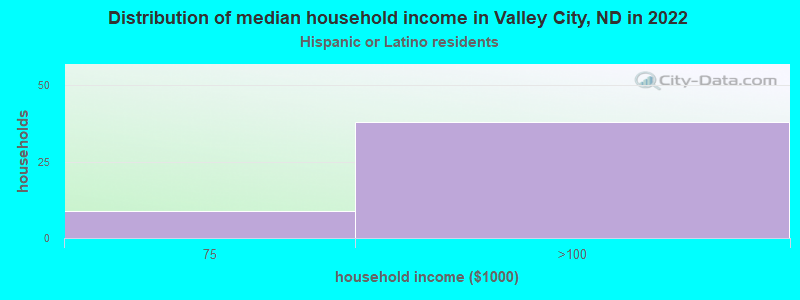
Income and house value in Valley City Median household income in 2022 $50,469 White non-Hispanic householders$2,221 Black householders$78,161 American Indian and Alaska Native householders$54,682 Two or more races householdersMedian 2022 house value $158,766 White Non-Hispanic householders$32,165 American Indian or Alaska Native householders $167,258 Asian householders$96,495 Two or more races householders$418,145 Hispanic or Latino householders
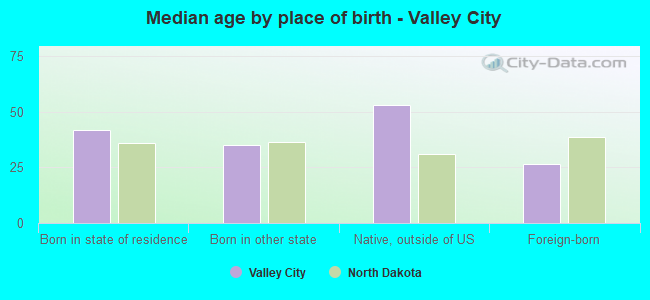
Median age by race in Valley City
42.9 Median age for White residents40.9 43.0 23.4 Median age for Black or African American residents20.9 45.6 17.4 Median age for American Indian / Alaska Native residents16.0 43.5 27.7 Median age for Asian residents52.0 21.6 -730,392,156.1 Median age for Native Hawaiian / Pacific Islander residents-553,672,315.8 -695,847,361.8 48.0 Median age for Other race residents53.0 -645,435,243.5 22.4 Median age for Two or more races residents30.0 5.9 43.3 Median age for White alone residents41.3 43.5 20.8 Median age for Hispanic or Latino residents25.9 19.3
Owner/renter occupied households by race in Valley City
House owners and renters - White residents 1,886 66.6% Owner occupied945 33.4% Renter occupiedHouse owners and renters - Black or African American residents 57 100.0% Renter occupiedHouse owners and renters - American Indian / Alaska Native residents 42 74.0% Owner occupied15 26.0% Renter occupiedHouse owners and renters - Asian residents 43 71.2% Owner occupied18 28.8% Renter occupiedHouse owners and renters - Two or more races residents 93 90.0% Owner occupied10 10.0% Renter occupiedHouse owners and renters - White alone residents 1,891 66.9% Owner occupied936 33.1% Renter occupiedHouse owners and renters - Hispanic or Latino residents 27 77.6% Owner occupied8 22.4% Renter occupied
Language usage in Valley City
English speakers - Total 94.9% of residents of Valley City speak English at home.
0.8% of residents speak Spanish at home 46 90.2% Speak English very well5 9.8% Speak English less than very well4.0% of residents speak other language at home 193 77.8% Speak English very well55 22.2% Speak English less than very well
English speakers - Born in the United States 96.0% of residents of Valley City speak English at home.
0.4% of residents speak Spanish at home 5 100.0% Speak English very well5.1% of residents speak other language at home 10 13.7% Speak English very well63 86.3% Speak English less than very well
English speakers - Native, born elsewhere 80.9% of residents of Valley City speak English at home.
17.0% of residents speak other language at home 8 100.0% Speak English less than very well
English speakers - Foreign-born 63.5% of residents of Valley City speak English at home.
41.9% of residents speak other language at home 130 100.0% Speak English very well
White (Caucasian) - Speak only English Native:
97.5% (5,371)Foreign-born:
100.0% (73)
Black or African American - Speak only English Native:
100.0% (94)Foreign-born:
100.0% (94)
Asian - Speak another language Native:
100.0% (7)Foreign-born:
100.0% (108)
White alone - Speak only English Native:
97.3% (5,249)Foreign-born:
100.0% (77)
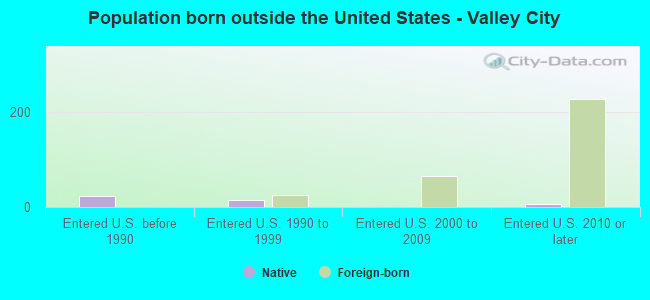
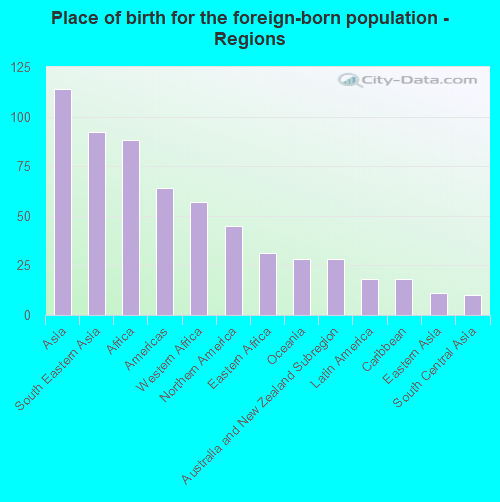
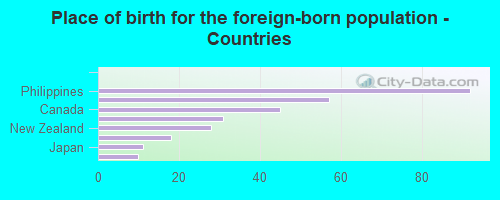
Foreign-born residents in Valley City 295 residents are foreign born (1.7% Asia , 1.3% Africa , 0.7% North America ).
This city:
4.5%North Dakota:
4.6%
Marital status for residents in Valley City Marital status - White (Caucasian) population 15 years and over
Males 47.3% Never married37.5% Now married0.3% Separated4.0% Widowed10.9% DivorcedFemales 26.6% Never married45.8% Now married0.2% Separated15.2% Widowed12.2% DivorcedWomen who gave birth in the past 12 months Now married:
100.0% (6)Unmarried:
0.0% (0)
Women who did not give birth in the past 12 months Now married:
43.6% (528)Unmarried:
56.4% (682)
Marital status - Black or African American population 15 years and over
Males 80.7% Never married19.3% Now married0.0% Separated0.0% Widowed0.0% DivorcedFemales 0.0% Never married72.1% Now married0.0% Separated0.0% Widowed27.9% DivorcedWomen who did not give birth in the past 12 months Now married:
72.1% (42)Unmarried:
27.9% (16)
Marital status - American Indian / Alaska Native population 15 years and over
Males 63.0% Never married35.2% Now married1.9% Separated0.0% Widowed0.0% DivorcedFemales 26.2% Never married42.9% Now married0.0% Separated0.0% Widowed31.0% DivorcedWomen who did not give birth in the past 12 months Now married:
56.3% (19)Unmarried:
43.8% (15)
Marital status - Asian population 15 years and over
Males 49.2% Never married50.8% Now married0.0% Separated0.0% Widowed0.0% DivorcedFemales 49.2% Never married50.8% Now married0.0% Separated0.0% Widowed0.0% DivorcedWomen who gave birth in the past 12 months Now married:
100.0% (13)Unmarried:
0.0% (0)
Women who did not give birth in the past 12 months Now married:
40.0% (23)Unmarried:
60.0% (35)
Marital status - Other race population 15 years and over
Males 91.4% Never married0.0% Now married0.0% Separated0.0% Widowed8.6% DivorcedFemales 33.3% Never married66.7% Now married0.0% Separated0.0% Widowed0.0% DivorcedWomen who did not give birth in the past 12 months Now married:
66.7% (8)Unmarried:
33.3% (4)
Marital status - Two or more races population 15 years and over
Males 72.4% Never married27.6% Now married0.0% Separated0.0% Widowed0.0% DivorcedFemales 9.0% Never married16.9% Now married0.0% Separated74.2% Widowed0.0% DivorcedWomen who did not give birth in the past 12 months Now married:
20.0% (17)Unmarried:
80.0% (68)
Marital status - White alone, not Hispanic / Latino population 15 years and over
Males 47.0% Never married37.7% Now married0.3% Separated4.1% Widowed10.9% DivorcedFemales 26.6% Never married45.7% Now married0.2% Separated15.5% Widowed12.0% DivorcedWomen who gave birth in the past 12 months Now married:
100.0% (6)Unmarried:
0.0% (0)
Women who did not give birth in the past 12 months Now married:
43.4% (513)Unmarried:
56.6% (668)
Marital status - Hispanic or Latino population 15 years and over
Males 74.1% Never married22.2% Now married0.0% Separated0.0% Widowed3.7% DivorcedFemales 41.5% Never married45.3% Now married0.0% Separated0.0% Widowed13.2% DivorcedWomen who did not give birth in the past 12 months Now married:
45.3% (26)Unmarried:
54.7% (31)
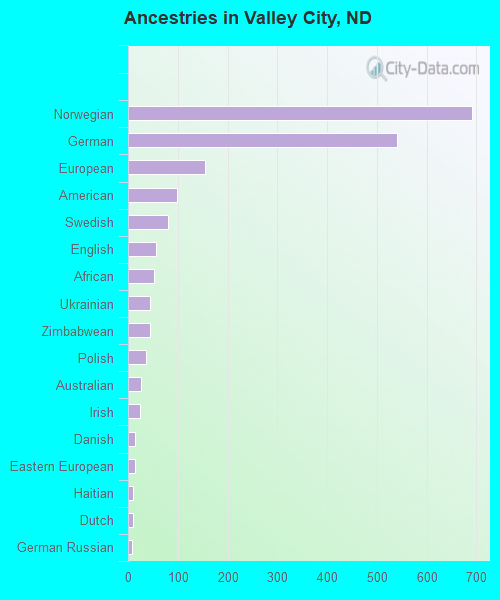
Ancestries in Valley City
691 28.6% Norwegian540 22.4% German155 6.4% European99 4.1% American80 3.3% Swedish56 2.3% English52 2.2% African45 1.9% Ukrainian44 1.8% Zimbabwean36 1.5% Polish27 1.1% Australian25 1.0% Irish14 0.6% Danish14 0.6% Eastern European11 0.5% Haitian10 0.4% Dutch9 0.4% German Russian6 0.2% Czechoslovakian6 0.2% Greek5 0.2% French3 0.1% Italian
Children Nativity (place of birth) in Valley City
Children under 6 years - Living with two parents Both parents native 278 100.0% NativeBoth parents foreign-born 21 100.0% NativeChildren under 6 years - Living with one parent Native parent 109 100.0% NativeChildren 6 to 17 years - Living with two parents Both parents native 641 100.0% NativeBoth parents foreign-born 15 100.0% NativeChildren 6 to 17 years - Living with one parent Native parent 106 93.9% Native7 6.1% Foreign-bornForeign-born parent 47 69.1% Native21 30.9% Foreign-born
Grandparents responsible for own grandchildren in Valley City
Grandparents (30 to 59 years) White / Caucasian 6 100.0% Not responsible for grandchildrenWhite alone, not Hispanic / Latino 7 100.0% Not responsible for grandchildren
Grandparents (60 years and over) White / Caucasian 9 100.0% Not responsible for grandchildrenWhite alone, not Hispanic / Latino 9 100.0% Not responsible for grandchildren