Races in Veradale, Washington (WA) Detailed Stats
Ancestries, Foreign-born residents, place of birth

Recent posts about races in Veradale, Washington on our local forum with over 2,400,000 registered users:
 | Working in Spokane Valley - good place nearby to live w/kids? (4 replies) |
| Living in Mead, Colbert, way north Spokane? (1 reply) |
| Spokane -- how bad is "rush hour" traffic? (3 replies) |
3.2% of Veradale, WA residents are foreign-born (1.4% born in Asia, 0.9% born in Europe, 0.5% born in Latin America, 0.4% born in North America), which is 369.4% less than the foreign-born rate of 15.0% across the entire state of Washington.
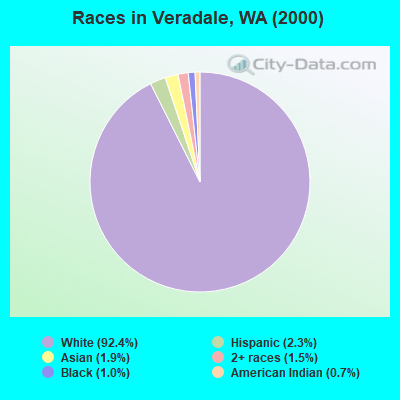
Race distribution in Veradale

- 8,67192.4%White alone
- 2182.3%Hispanic
- 1761.9%Asian alone
- 1441.5%Two or more races
- 951.0%Black alone
- 690.7%American Indian alone
- 90.10%Other race alone
- 50.05%Native Hawaiian and Other
Pacific Islander alone
2000
2022
-
- 4,652,49078.9%White alone
- 441,5097.5%Hispanic
- 319,4015.4%Asian alone
- 184,6313.1%Black alone
- 175,9263.0%Two or more races
- 85,3961.4%American Indian alone
- 22,7790.4%Native Hawaiian and Other
Pacific Islander alone - 11,9890.2%Other race alone

-
- 4,941,45663.5%White alone
- 1,093,31314.0%Hispanic
- 755,8329.7%Asian alone
- 523,4486.7%Two or more races
- 299,5373.8%Black alone
- 69,0240.9%American Indian alone
- 52,2310.7%Native Hawaiian and Other
Pacific Islander alone - 50,9450.7%Other race alone

Income and house value in Veradale
- Median household income in 2022
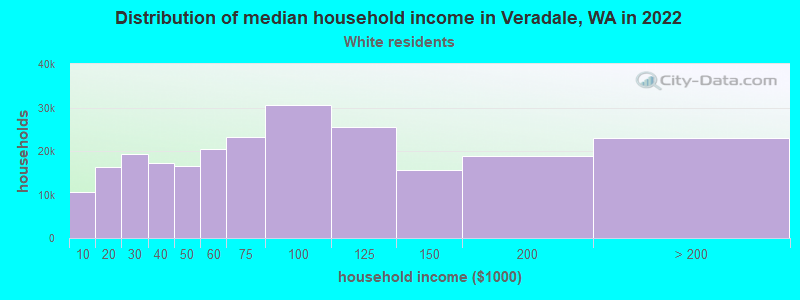
- $86,992White non-Hispanic householders
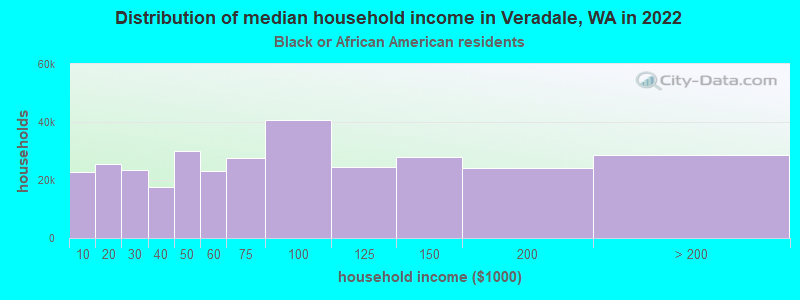
- $161,952Black householders
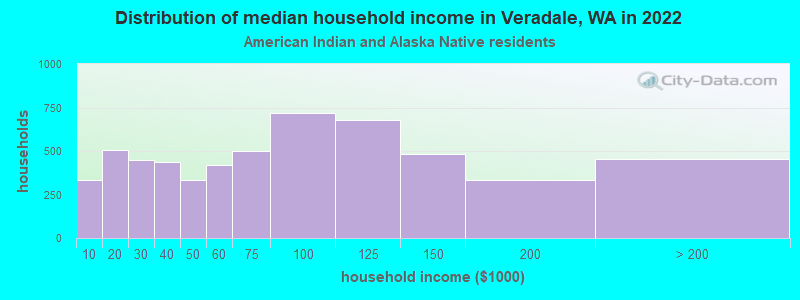
- $27,547American Indian and Alaska Native householders
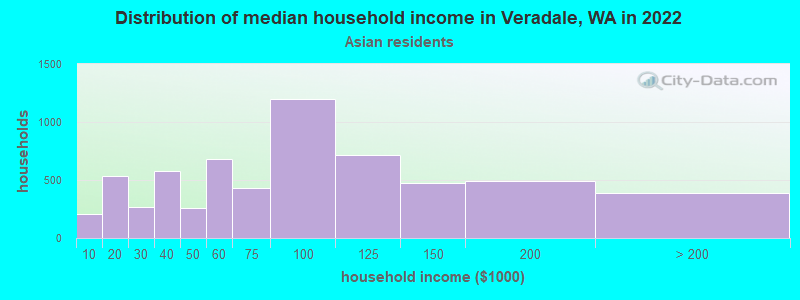
- $131,884Asian householders
- $89,019Some other race householders
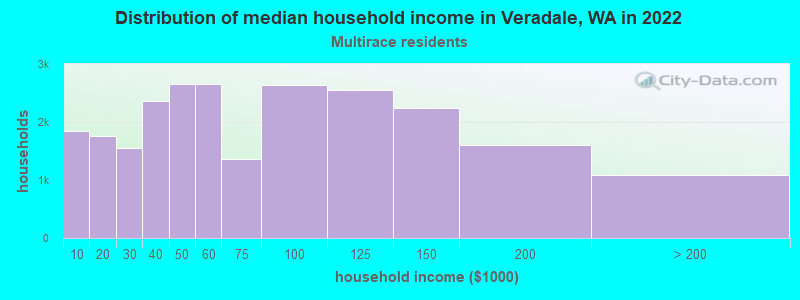
- $106,253Two or more races householders
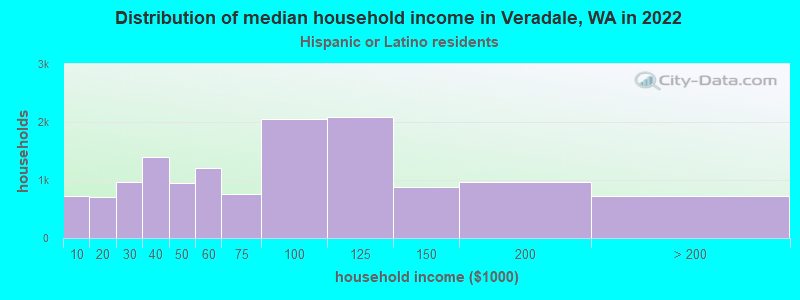
- $99,996Hispanic or Latino race householders
- Median 2022 house value
- $451,370White Non-Hispanic householders
- $420,357Black or African American householders
- $242,873American Indian or Alaska Native householders
- $389,344Asian householders
- $420,357Two or more races householders
- $242,873Hispanic or Latino householders
Household income for White non-Hispanic householders
Household income for Black householders
Household income for American Indian and Alaska Native householders
Household income for Asian householders
Household income for Two or more races householders
Household income for Hispanic or Latino race householders
Foreign-born residents in Veradale
300 residents are foreign born (1.4% Asia, 0.9% Europe, 0.5% Latin America, 0.4% North America).
| This city: | 3.2% |
| Washington: | 10.4% |
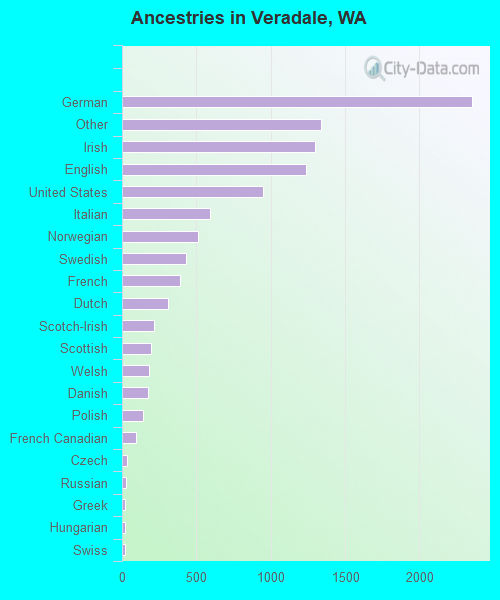
Ancestries in Veradale

- 2,35122.2%German
- 1,33612.6%Other
- 1,30012.3%Irish
- 1,23811.7%English
- 9509.0%United States
- 5935.6%Italian
- 5084.8%Norwegian
- 4314.1%Swedish
- 3933.7%French
- 3072.9%Dutch
- 2162.0%Scotch-Irish
- 1921.8%Scottish
- 1791.7%Welsh
- 1771.7%Danish
- 1391.3%Polish
- 930.9%French Canadian
- 310.3%Czech
- 300.3%Russian
- 230.2%Greek
- 220.2%Hungarian
- 220.2%Swiss
- 160.2%Ukrainian
- 100.09%Arab
- 80.08%Portuguese
- 40.04%Subsaharan African
Zip codes: 99037.