Races in Verdi-Mogul, Nevada (NV) Detailed Stats
Ancestries, Foreign-born residents, place of birth

Recent posts about races in Verdi-Mogul, Nevada on our local forum with over 2,400,000 registered users:
 | Moving to Nevada, eventually, need help deciding (6 replies) |
0.7% of Verdi-Mogul, NV residents are foreign-born , which is 2554.1% less than the foreign-born rate of 18.0% across the entire state of Nevada.
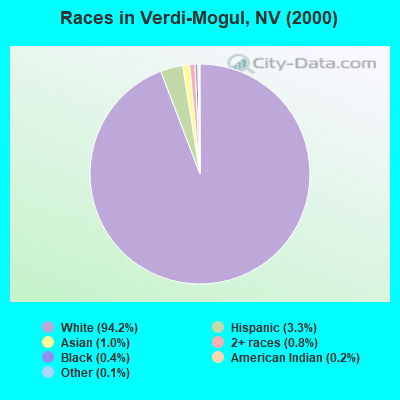
Race distribution in Verdi-Mogul

- 2,77794.2%White alone
- 973.3%Hispanic
- 301.0%Asian alone
- 240.8%Two or more races
- 130.4%Black alone
- 50.2%American Indian alone
- 30.1%Other race alone
2000
2022
-
- 1,303,00165.2%White alone
- 393,97019.7%Hispanic
- 131,5096.6%Black alone
- 88,5934.4%Asian alone
- 49,2312.5%Two or more races
- 21,3971.1%American Indian alone
- 7,7690.4%Native Hawaiian and Other
Pacific Islander alone - 2,7870.1%Other race alone

-
- 1,410,14544.4%White alone
- 961,35730.3%Hispanic
- 286,4719.0%Black alone
- 281,1498.8%Asian alone
- 182,1515.7%Two or more races
- 20,1020.6%Native Hawaiian and Other
Pacific Islander alone - 18,7810.6%Other race alone
- 17,6160.6%American Indian alone

Income and house value in Verdi-Mogul
- Median household income in 2022
- $116,641White non-Hispanic householders
- $4,397Asian householders
- $42,593Native Hawaiian and other Pacific Islander householders
- $182,467Two or more races householders
- $144,867Hispanic or Latino race householders
- Median 2022 house value
- $821,676White Non-Hispanic householders
- over $1,000,000Asian householders
- over $1,000,000Two or more races householders
- $798,260Hispanic or Latino householders
Household income for White non-Hispanic householders

Household income for Asian householders

Household income for Native Hawaiian and other Pacific Islander householders

Household income for Two or more races householders

Household income for Hispanic or Latino race householders

Foreign-born residents in Verdi-Mogul
20 residents are foreign born
| This city: | 0.7% |
| Nevada: | 15.8% |
Ancestries in Verdi-Mogul

- 81923.4%German
- 58416.7%English
- 47013.4%Irish
- 36510.4%Other
- 2166.2%Italian
- 1474.2%United States
- 1313.7%French
- 1083.1%Danish
- 962.7%Scottish
- 952.7%Dutch
- 812.3%Scotch-Irish
- 782.2%Swedish
- 772.2%Norwegian
- 531.5%Welsh
- 381.1%Polish
- 381.1%Russian
- 250.7%Portuguese
- 250.7%Swiss
- 200.6%Czech
- 150.4%French Canadian
- 150.4%Lithuanian

Zip codes: 89439.