Races in Vernal, Utah (UT) Detailed Stats
Data:
Races - White alone (%)
Races - White alone (% change since 2000)
Races - Black alone (%)
Races - Black alone (% change since 2000)
Races - American Indian alone (%)
Races - American Indian alone (% change since 2000)
Races - Asian alone (%)
Races - Asian alone (% change since 2000)
Races - Hispanic (%)
Races - Hispanic (% change since 2000)
Races - Native Hawaiian and Other Pacific Islander alone (%)
Races - Native Hawaiian and Other Pacific Islander alone (% change since 2000)
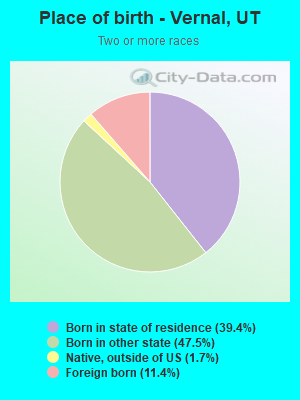
Races - Two or more races(%)
Races - Two or more races(% change since 2000)
Races - Other race alone (%)
Races - Other race alone (% change since 2000)
Racial diversity
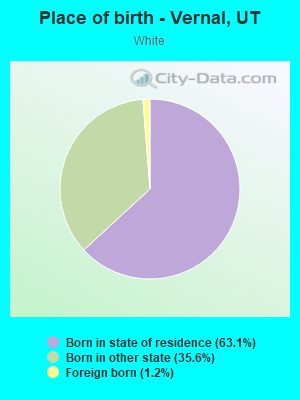
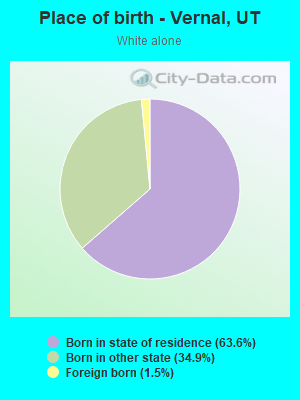
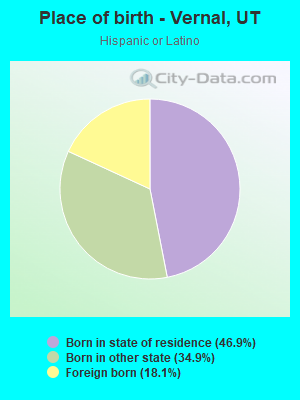
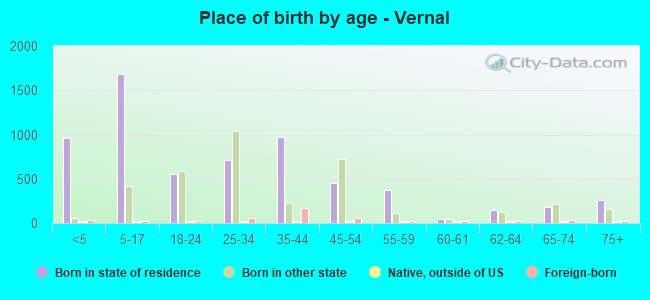
Place of birth - Born in state of residence (%)
Place of birth - Born in state of residence (%) - White
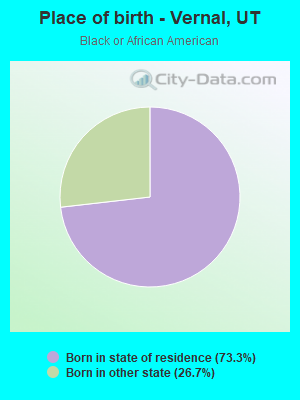
Place of birth - Born in state of residence (%) - Black or African American
Place of birth - Born in state of residence (%) - Asian
Place of birth - Born in state of residence (%) - Hispanic or Latino
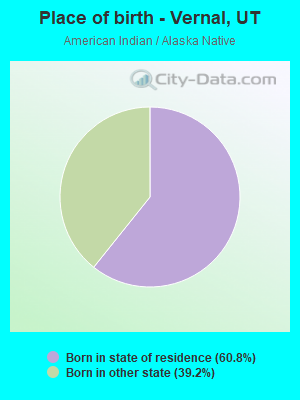
Place of birth - Born in state of residence (%) - American Indian and Alaska Native
Place of birth - Born in state of residence (%) - Multirace
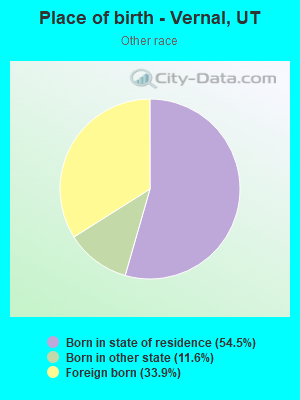
Place of birth - Born in state of residence (%) - Other Race
Place of birth - Born in other state (%)
Place of birth - Born in other state (%) - White
Place of birth - Born in other state (%) - Black or African American
Place of birth - Born in other state (%) - Asian
Place of birth - Born in other state (%) - Hispanic or Latino
Place of birth - Born in other state (%) - American Indian and Alaska Native
Place of birth - Born in other state (%) - Multirace
Place of birth - Born in other state (%) - Other Race
Place of birth - Native, outside of US (%)
Place of birth - Native, outside of US (%) - White
Place of birth - Native, outside of US (%) - Black or African American
Place of birth - Native, outside of US (%) - Asian
Place of birth - Native, outside of US (%) - Hispanic or Latino
Place of birth - Native, outside of US (%) - American Indian and Alaska Native
Place of birth - Native, outside of US (%) - Multirace
Place of birth - Native, outside of US (%) - Other Race
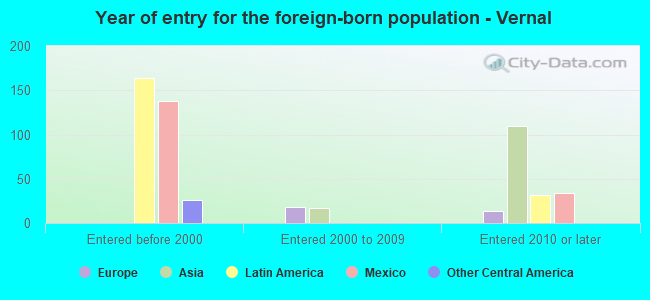
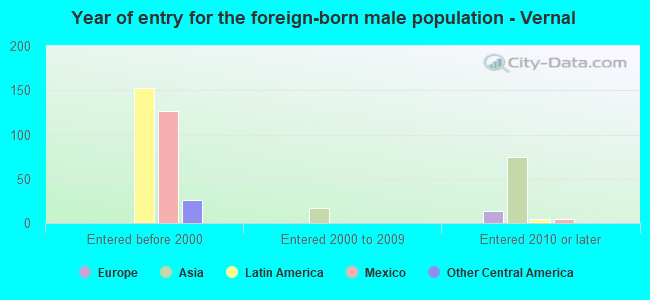
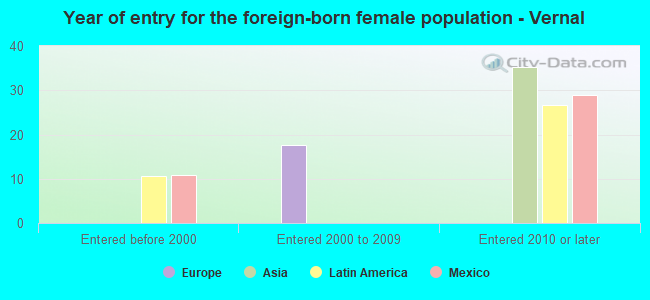
Place of birth - Foreign born (%)
Place of birth - Foreign born (%) - White
Place of birth - Foreign born (%) - Black or African American
Place of birth - Foreign born (%) - Asian
Place of birth - Foreign born (%) - Hispanic or Latino
Place of birth - Foreign born (%) - American Indian and Alaska Native
Place of birth - Foreign born (%) - Multirace
Place of birth - Foreign born (%) - Other Race
Residents speaking English at home (%)
Residents speaking English at home - Born in the United States (%)
Residents speaking English at home - Native, born elsewhere (%)
Residents speaking English at home - Foreign born (%)
Residents speaking Spanish at home (%)
Residents speaking Spanish at home - Born in the United States (%)
Residents speaking Spanish at home - Native, born elsewhere (%)
Residents speaking Spanish at home - Foreign born (%)
Residents speaking other language at home (%)
Residents speaking other language at home - Born in the United States (%)
Residents speaking other language at home - Native, born elsewhere (%)
Residents speaking other language at home - Foreign born (%)
Marital status - Never married (%)
Marital status - Now married (%)
Marital status - Separated (%)
Marital status - Widowed (%)
Marital status - Divorced (%)
Ancestries Reported - Arab (%)
Ancestries Reported - Czech (%)
Ancestries Reported - Danish (%)
Ancestries Reported - Dutch (%)
Ancestries Reported - English (%)
Ancestries Reported - French (%)
Ancestries Reported - French Canadian (%)
Ancestries Reported - German (%)
Ancestries Reported - Greek (%)
Ancestries Reported - Hungarian (%)
Ancestries Reported - Irish (%)
Ancestries Reported - Italian (%)
Ancestries Reported - Lithuanian (%)
Ancestries Reported - Norwegian (%)
Ancestries Reported - Polish (%)
Ancestries Reported - Portuguese (%)
Ancestries Reported - Russian (%)
Ancestries Reported - Scotch-Irish (%)
Ancestries Reported - Scottish (%)
Ancestries Reported - Slovak (%)
Ancestries Reported - Subsaharan African (%)
Ancestries Reported - Swedish (%)
Ancestries Reported - Swiss (%)
Ancestries Reported - Ukrainian (%)
Ancestries Reported - United States (%)
Ancestries Reported - Welsh (%)
Ancestries Reported - West Indian (%)
Ancestries Reported - Other (%)
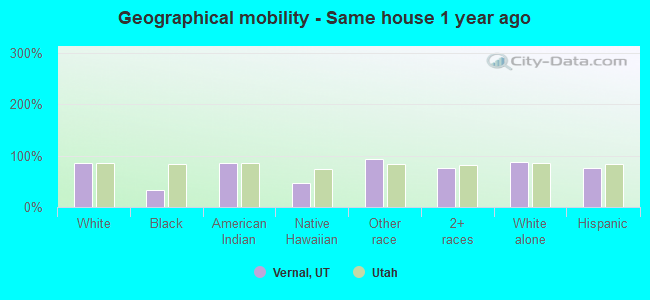
Geographical mobility - Same house 1 year ago (%)
Geographical mobility - Same house 1 year ago (%) - White
Geographical mobility - Same house 1 year ago (%) - Black or African American
Geographical mobility - Same house 1 year ago (%) - Asian
Geographical mobility - Same house 1 year ago (%) - Hispanic or Latino
Geographical mobility - Same house 1 year ago (%) - American Indian and Alaska Native
Geographical mobility - Same house 1 year ago (%) - Multirace
Geographical mobility - Same house 1 year ago (%) - Other Race
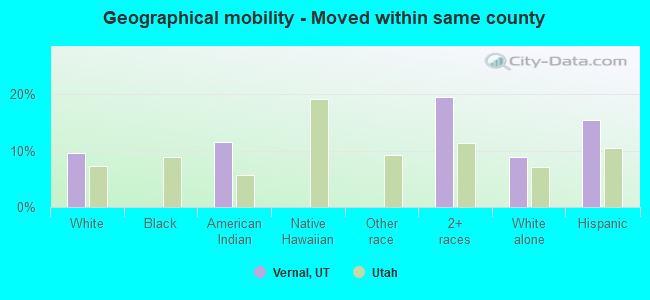
Geographical mobility - Moved within same county (%)
Geographical mobility - Moved within same county (%) - White
Geographical mobility - Moved within same county (%) - Black or African American
Geographical mobility - Moved within same county (%) - Asian
Geographical mobility - Moved within same county (%) - Hispanic or Latino
Geographical mobility - Moved within same county (%) - American Indian and Alaska Native
Geographical mobility - Moved within same county (%) - Multirace
Geographical mobility - Moved within same county (%) - Other Race
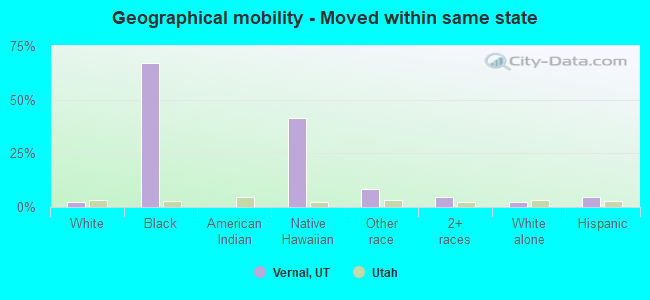
Geographical mobility - Moved from different county within same state (%)
Geographical mobility - Moved from different county within same state (%) - White
Geographical mobility - Moved from different county within same state (%) - Black or African American
Geographical mobility - Moved from different county within same state (%) - Asian
Geographical mobility - Moved from different county within same state (%) - Hispanic or Latino
Geographical mobility - Moved from different county within same state (%) - American Indian and Alaska Native
Geographical mobility - Moved from different county within same state (%) - Multirace
Geographical mobility - Moved from different county within same state (%) - Other Race
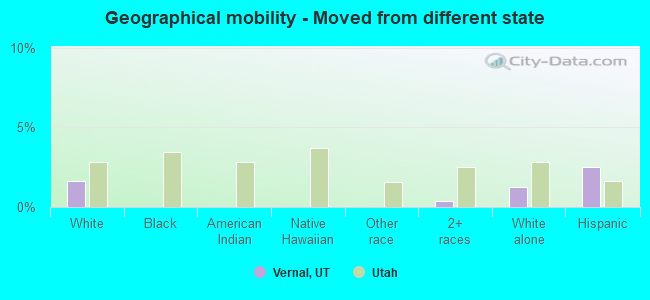
Geographical mobility - Moved from different state (%)
Geographical mobility - Moved from different state (%) - White
Geographical mobility - Moved from different state (%) - Black or African American
Geographical mobility - Moved from different state (%) - Asian
Geographical mobility - Moved from different state (%) - Hispanic or Latino
Geographical mobility - Moved from different state (%) - American Indian and Alaska Native
Geographical mobility - Moved from different state (%) - Multirace
Geographical mobility - Moved from different state (%) - Other Race
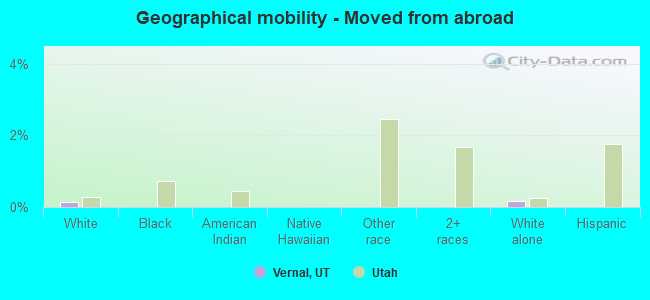
Geographical mobility - Moved from abroad (%)
Geographical mobility - Moved from abroad (%) - White
Geographical mobility - Moved from abroad (%) - Black or African American
Geographical mobility - Moved from abroad (%) - Asian
Geographical mobility - Moved from abroad (%) - Hispanic or Latino
Geographical mobility - Moved from abroad (%) - American Indian and Alaska Native
Geographical mobility - Moved from abroad (%) - Multirace
Geographical mobility - Moved from abroad (%) - Other Race
Place of birth for the foreign-born population - Ireland (%)
Place of birth for the foreign-born population - Denmark (%)
Place of birth for the foreign-born population - Norway (%)
Place of birth for the foreign-born population - Sweden (%)
Place of birth for the foreign-born population - United Kingdom (%)
Place of birth for the foreign-born population - England (%)
Place of birth for the foreign-born population - Scotland (%)
Place of birth for the foreign-born population - Other Northern Europe (%)
Place of birth for the foreign-born population - Austria (%)
Place of birth for the foreign-born population - Belgium (%)
Place of birth for the foreign-born population - France (%)
Place of birth for the foreign-born population - Germany (%)
Place of birth for the foreign-born population - Netherlands (%)
Place of birth for the foreign-born population - Switzerland (%)
Place of birth for the foreign-born population - Other Western Europe (%)
Place of birth for the foreign-born population - Greece (%)
Place of birth for the foreign-born population - Italy (%)
Place of birth for the foreign-born population - Portugal (%)
Place of birth for the foreign-born population - Spain (%)
Place of birth for the foreign-born population - Other Southern Europe (%)
Place of birth for the foreign-born population - Albania (%)
Place of birth for the foreign-born population - Belarus (%)
Place of birth for the foreign-born population - Bosnia and Herzegovina (%)
Place of birth for the foreign-born population - Bulgaria (%)
Place of birth for the foreign-born population - Croatia (%)
Place of birth for the foreign-born population - Czechoslovakia (%)
Place of birth for the foreign-born population - Hungary (%)
Place of birth for the foreign-born population - Latvia (%)
Place of birth for the foreign-born population - Lithuania (%)
Place of birth for the foreign-born population - North Macedonia (Macedonia) (%)
Place of birth for the foreign-born population - Moldova (%)
Place of birth for the foreign-born population - Poland (%)
Place of birth for the foreign-born population - Romania (%)
Place of birth for the foreign-born population - Russia (%)
Place of birth for the foreign-born population - Serbia (%)
Place of birth for the foreign-born population - Ukraine (%)
Place of birth for the foreign-born population - Other Eastern Europe (%)
Place of birth for the foreign-born population - China (%)
Place of birth for the foreign-born population - Hong Kong (%)
Place of birth for the foreign-born population - Taiwan (%)
Place of birth for the foreign-born population - Japan (%)
Place of birth for the foreign-born population - Korea (%)
Place of birth for the foreign-born population - Other Eastern Asia (%)
Place of birth for the foreign-born population - Afghanistan (%)
Place of birth for the foreign-born population - Bangladesh (%)
Place of birth for the foreign-born population - India (%)
Place of birth for the foreign-born population - Iran (%)
Place of birth for the foreign-born population - Kazakhstan (%)
Place of birth for the foreign-born population - Nepal (%)
Place of birth for the foreign-born population - Pakistan (%)
Place of birth for the foreign-born population - Sri Lanka (%)
Place of birth for the foreign-born population - Uzbekistan (%)
Place of birth for the foreign-born population - Other South Central Asia (%)
Place of birth for the foreign-born population - Burma (%)
Place of birth for the foreign-born population - Cambodia (%)
Place of birth for the foreign-born population - Indonesia (%)
Place of birth for the foreign-born population - Laos (%)
Place of birth for the foreign-born population - Malaysia (%)
Place of birth for the foreign-born population - Philippines (%)
Place of birth for the foreign-born population - Singapore (%)
Place of birth for the foreign-born population - Thailand (%)
Place of birth for the foreign-born population - Vietnam (%)
Place of birth for the foreign-born population - Other South Eastern Asia (%)
Place of birth for the foreign-born population - Armenia (%)
Place of birth for the foreign-born population - Iraq (%)
Place of birth for the foreign-born population - Israel (%)
Place of birth for the foreign-born population - Jordan (%)
Place of birth for the foreign-born population - Kuwait (%)
Place of birth for the foreign-born population - Lebanon (%)
Place of birth for the foreign-born population - Saudi Arabia (%)
Place of birth for the foreign-born population - Syria (%)
Place of birth for the foreign-born population - Turkey (%)
Place of birth for the foreign-born population - Yemen (%)
Place of birth for the foreign-born population - Other Western Asia (%)
Place of birth for the foreign-born population - Eritrea (%)
Place of birth for the foreign-born population - Ethiopia (%)
Place of birth for the foreign-born population - Kenya (%)
Place of birth for the foreign-born population - Somalia (%)
Place of birth for the foreign-born population - Uganda (%)
Place of birth for the foreign-born population - Zimbabwe (%)
Place of birth for the foreign-born population - Other Eastern Africa (%)
Place of birth for the foreign-born population - Cameroon (%)
Place of birth for the foreign-born population - Congo (%)
Place of birth for the foreign-born population - Democratic Republic of Congo (Zaire) (%)
Place of birth for the foreign-born population - Other Middle Africa (%)
Place of birth for the foreign-born population - Egypt (%)
Place of birth for the foreign-born population - Morocco (%)
Place of birth for the foreign-born population - Sudan (%)
Place of birth for the foreign-born population - Other Northern Africa (%)
Place of birth for the foreign-born population - South Africa (%)
Place of birth for the foreign-born population - Other Southern Africa (%)
Place of birth for the foreign-born population - Cabo Verde (%)
Place of birth for the foreign-born population - Ghana (%)
Place of birth for the foreign-born population - Liberia (%)
Place of birth for the foreign-born population - Nigeria (%)
Place of birth for the foreign-born population - Senegal (%)
Place of birth for the foreign-born population - Sierra Leone (%)
Place of birth for the foreign-born population - Other Western Africa (%)
Place of birth for the foreign-born population - Australia (%)
Place of birth for the foreign-born population - New Zealand (%)
Place of birth for the foreign-born population - Fiji (%)
Place of birth for the foreign-born population - Micronesia (%)
Place of birth for the foreign-born population - Bahamas (%)
Place of birth for the foreign-born population - Barbados (%)
Place of birth for the foreign-born population - Cuba (%)
Place of birth for the foreign-born population - Dominica (%)
Place of birth for the foreign-born population - Dominican Republic (%)
Place of birth for the foreign-born population - Grenada (%)
Place of birth for the foreign-born population - Haiti (%)
Place of birth for the foreign-born population - Jamaica (%)
Place of birth for the foreign-born population - St. Vincent and the Grenadines (%)
Place of birth for the foreign-born population - Trinidad and Tobago (%)
Place of birth for the foreign-born population - West Indies (%)
Place of birth for the foreign-born population - Other Caribbean (%)
Place of birth for the foreign-born population - Belize (%)
Place of birth for the foreign-born population - Costa Rica (%)
Place of birth for the foreign-born population - El Salvador (%)
Place of birth for the foreign-born population - Guatemala (%)
Place of birth for the foreign-born population - Honduras (%)
Place of birth for the foreign-born population - Mexico (%)
Place of birth for the foreign-born population - Nicaragua (%)
Place of birth for the foreign-born population - Panama (%)
Place of birth for the foreign-born population - Other Central America (%)
Place of birth for the foreign-born population - Argentina (%)
Place of birth for the foreign-born population - Bolivia (%)
Place of birth for the foreign-born population - Brazil (%)
Place of birth for the foreign-born population - Chile (%)
Place of birth for the foreign-born population - Colombia (%)
Place of birth for the foreign-born population - Ecuador (%)
Place of birth for the foreign-born population - Guyana (%)
Place of birth for the foreign-born population - Peru (%)
Place of birth for the foreign-born population - Uruguay (%)
Place of birth for the foreign-born population - Venezuela (%)
Place of birth for the foreign-born population - Other South America (%)
Place of birth for the foreign-born population - Canada (%)
Place of birth for the foreign-born population - Other Northern America (%)
Place of birth for the foreign-born population - Other (%)
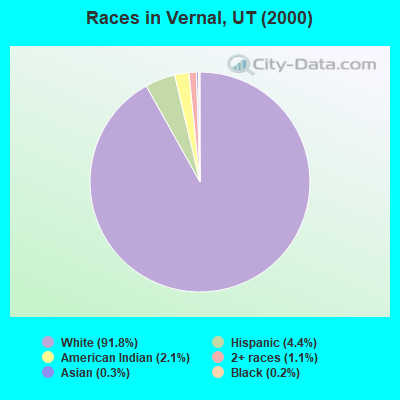
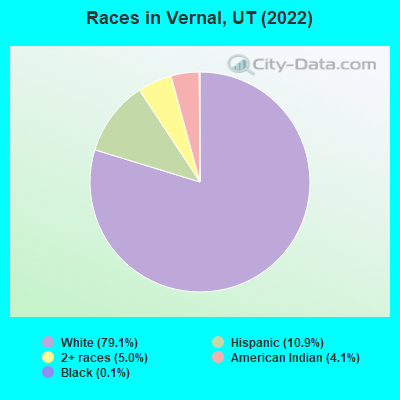
According to 2022 data, the most numerous races in Vernal, UT are White alone (8,253 residents), Hispanic (1,136 residents), and Two or more races (524 residents). 95.0% of Vernal residents speak English at home. 3.4% of Vernal, UT residents are foreign-born (1.9% born in Latin America, 1.1% born in Asia), which is 134.0% less than the foreign-born rate of 8.0% across the entire state of Utah.
Race distribution in Vernal
2000 2022
1,904,265 85.3% White alone 201,559 9.0% Hispanic 36,483 1.6% Asian alone 31,308 1.4% Two or more races 26,663 1.2% American Indian alone 14,806 0.7% Native Hawaiian and Other 16,137 0.7% Black alone 1,948 0.09% Other race alone
2,557,466 75.6% White alone 512,086 15.1% Hispanic 119,308 3.5% Two or more races 82,388 2.4% Asian alone 36,978 1.1% Native Hawaiian and Other 34,873 1.0% Black alone 22,803 0.7% American Indian alone 14,898 0.4% Other race alone
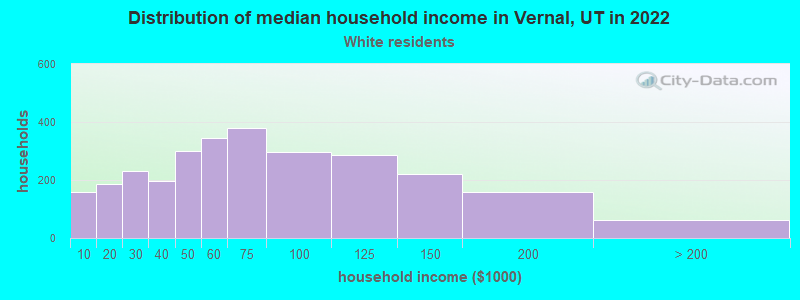
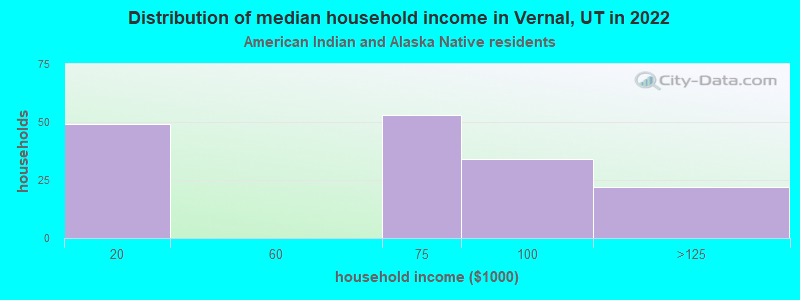
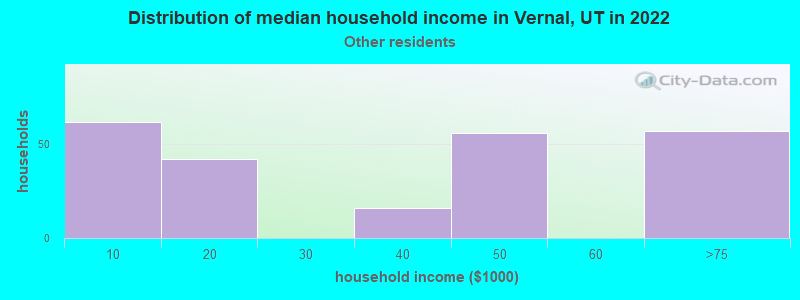
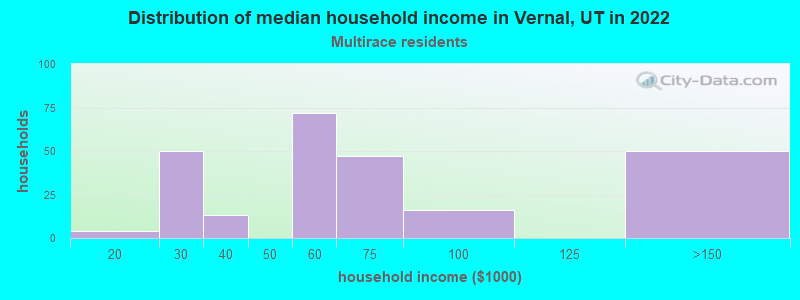
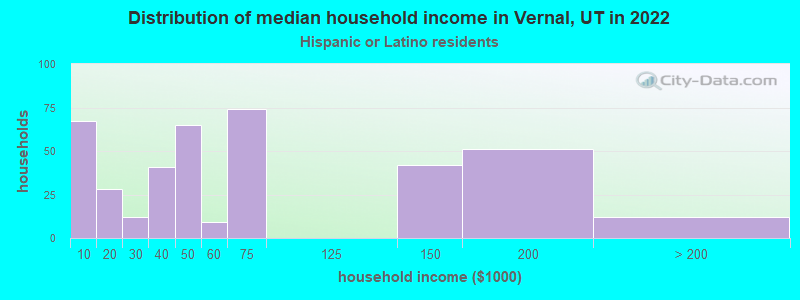
Income and house value in Vernal Median household income in 2022 $60,781 White non-Hispanic householders$66,994 American Indian and Alaska Native householders$47,104 Some other race householders$58,257 Two or more races householders$48,374 Hispanic or Latino race householdersMedian 2022 house value $270,627 White Non-Hispanic householders$216,635 American Indian or Alaska Native householders $283,292 Asian householders$316,620 Some other race householders$225,967 Two or more races householders$258,295 Hispanic or Latino householders
Median age by race in Vernal
30.3 Median age for White residents30.4 30.3 33.2 Median age for Black or African American residents32.1 -686,357,242.6 36.2 Median age for American Indian / Alaska Native residents16.2 35.8 -682,306,939.7 Median age for Asian residents-685,128,204.4 -679,775,280.2 -664,268,584.5 Median age for Native Hawaiian / Pacific Islander residents-659,420,289.2 -664,285,713.6 38.2 Median age for Other race residents39.8 35.7 32.3 Median age for Two or more races residents47.5 11.6 30.6 Median age for White alone residents30.9 30.0 29.2 Median age for Hispanic or Latino residents24.5 32.3
Owner/renter occupied households by race in Vernal
House owners and renters - White residents 1,573 54.9% Owner occupied1,292 45.1% Renter occupiedHouse owners and renters - American Indian / Alaska Native residents 50 29.1% Owner occupied123 70.9% Renter occupiedHouse owners and renters - Other race residents 86 36.9% Owner occupied147 63.1% Renter occupiedHouse owners and renters - Two or more races residents 127 54.5% Owner occupied106 45.5% Renter occupiedHouse owners and renters - White alone residents 1,540 54.9% Owner occupied1,267 45.1% Renter occupiedHouse owners and renters - Hispanic or Latino residents 203 50.8% Owner occupied197 49.2% Renter occupied
Language usage in Vernal
English speakers - Total 95.0% of residents of Vernal speak English at home.
3.0% of residents speak Spanish at home 189 66.5% Speak English very well95 33.5% Speak English less than very well1.6% of residents speak other language at home 104 67.5% Speak English very well50 32.5% Speak English less than very well
English speakers - Born in the United States 95.9% of residents of Vernal speak English at home.
3.0% of residents speak Spanish at home 96 87.3% Speak English very well14 12.7% Speak English less than very well1.1% of residents speak other language at home 39 100.0% Speak English very well
English speakers - Native, born elsewhere 90.0% of residents of Vernal speak English at home.
English speakers - Foreign-born 36.3% of residents of Vernal speak English at home.
30.8% of residents speak Spanish at home 47 47.0% Speak English very well53 53.0% Speak English less than very well32.3% of residents speak other language at home 56 53.3% Speak English very well49 46.7% Speak English less than very well
White (Caucasian) - Speak another language Native:
1.6% (125)Foreign-born:
86.9% (76)
Native Hawaiian / Pacific Islander - Speak another language Native:
100.0% (5)Foreign-born:
100.0% (5)
Other race - Speak only English Native:
59.9% (124)Foreign-born:
67.0% (98)
Other race - Speak another language Native:
36.4% (75)Foreign-born:
51.7% (76)
Two or more races - Speak only English Native:
97.9% (628)Foreign-born:
65.8% (59)
White alone - Speak another language Native:
0.6% (46)Foreign-born:
95.6% (91)
Hispanic or Latino - Speak only English Native:
77.9% (578)Foreign-born:
52.9% (108)
Hispanic or Latino - Speak another language Native:
22.9% (170)Foreign-born:
50.7% (104)
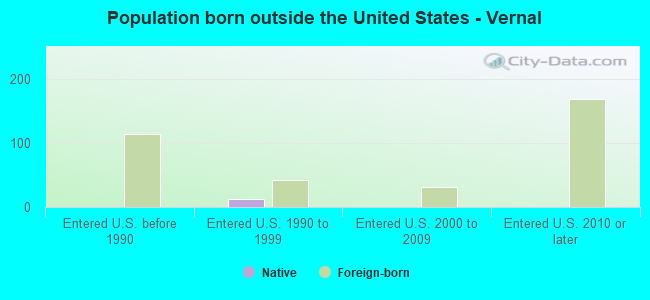
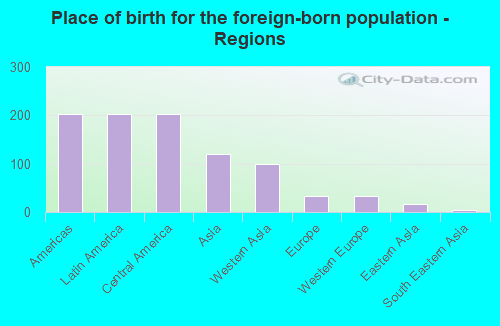
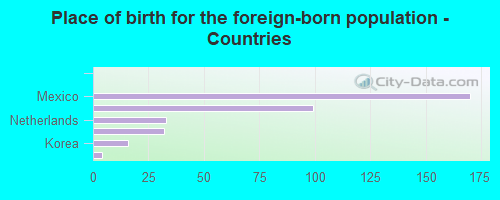
Foreign-born residents in Vernal 357 residents are foreign born (1.9% Latin America , 1.1% Asia ).
Marital status for residents in Vernal Marital status - White (Caucasian) population 15 years and over
Males 38.9% Never married46.8% Now married0.2% Separated1.1% Widowed13.0% DivorcedFemales 29.5% Never married46.7% Now married0.0% Separated6.4% Widowed17.5% DivorcedWomen who gave birth in the past 12 months Now married:
81.6% (231)Unmarried:
18.4% (52)
Women who did not give birth in the past 12 months Now married:
37.8% (801)Unmarried:
62.2% (1,317)
Marital status - American Indian / Alaska Native population 15 years and over
Males 30.3% Never married36.4% Now married0.0% Separated0.0% Widowed33.3% DivorcedFemales 14.7% Never married26.1% Now married0.0% Separated0.0% Widowed59.2% DivorcedWomen who did not give birth in the past 12 months Now married:
37.2% (52)Unmarried:
62.8% (87)
Marital status - Other race population 15 years and over
Males 16.0% Never married37.4% Now married4.3% Separated0.0% Widowed42.3% DivorcedFemales 42.2% Never married21.7% Now married0.0% Separated14.5% Widowed21.7% DivorcedWomen who did not give birth in the past 12 months Now married:
47.4% (21)Unmarried:
52.6% (23)
Marital status - Two or more races population 15 years and over
Males 31.8% Never married39.5% Now married16.5% Separated0.0% Widowed12.3% DivorcedFemales 19.6% Never married80.4% Now married0.0% Separated0.0% Widowed0.0% DivorcedWomen who gave birth in the past 12 months Now married:
100.0% (13)Unmarried:
0.0% (0)
Women who did not give birth in the past 12 months Now married:
100.0% (72)Unmarried:
0.0% (0)
Marital status - White alone, not Hispanic / Latino population 15 years and over
Males 40.5% Never married47.0% Now married0.2% Separated1.2% Widowed11.1% DivorcedFemales 28.5% Never married48.2% Now married0.0% Separated6.7% Widowed16.6% DivorcedWomen who gave birth in the past 12 months Now married:
84.9% (236)Unmarried:
15.1% (42)
Women who did not give birth in the past 12 months Now married:
39.3% (796)Unmarried:
60.7% (1,228)
Marital status - Hispanic or Latino population 15 years and over
Males 22.0% Never married39.6% Now married2.6% Separated0.0% Widowed35.8% DivorcedFemales 40.8% Never married28.4% Now married0.0% Separated4.3% Widowed26.6% DivorcedWomen who gave birth in the past 12 months Now married:
0.0% (0)Unmarried:
100.0% (12)
Women who did not give birth in the past 12 months Now married:
29.9% (61)Unmarried:
70.1% (144)
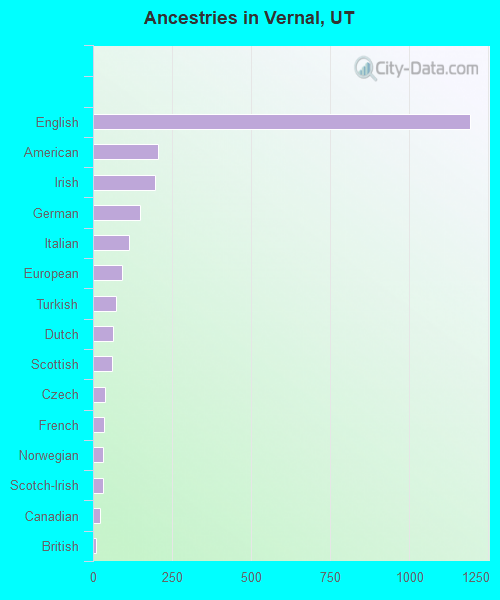
Ancestries in Vernal
1,193 27.5% English205 4.7% American195 4.5% Irish148 3.4% German115 2.6% Italian91 2.1% European72 1.7% Turkish62 1.4% Dutch60 1.4% Scottish37 0.9% Czech35 0.8% French33 0.8% Norwegian33 0.8% Scotch-Irish22 0.5% Canadian11 0.3% British10 0.2% Scandinavian4 0.09% Danish
Children Nativity (place of birth) in Vernal
Children under 6 years - Living with two parents Both parents native 841 99.8% Native1 0.2% Foreign-bornBoth parents foreign-born 57 72.8% Native21 27.2% Foreign-bornChildren under 6 years - Living with one parent Native parent 275 100.0% Native
Children 6 to 17 years - Living with two parents Both parents native 1,471 100.0% NativeBoth parents foreign-born 22 100.0% NativeChildren 6 to 17 years - Living with one parent Native parent 304 100.0% Native
Grandparents responsible for own grandchildren in Vernal
Grandparents (30 to 59 years) White / Caucasian 25 60.9% Responsible for grandchildren16 39.1% Not responsible for grandchildrenWhite alone, not Hispanic / Latino 9 34.4% Responsible for grandchildren17 65.6% Not responsible for grandchildrenHispanic or Latino 11 100.0% Responsible for grandchildrenGrandparents (60 years and over) White / Caucasian 30 64.4% Responsible for grandchildren17 35.6% Not responsible for grandchildrenWhite alone, not Hispanic / Latino 30 79.7% Responsible for grandchildren8 20.3% Not responsible for grandchildrenHispanic or Latino 11 100.0% Not responsible for grandchildren