Races in Verona, New York (NY) Detailed Stats
Ancestries, Foreign-born residents, place of birth

Data:
1.4% of Verona, NY residents are foreign-born , which is 1436.4% less than the foreign-born rate of 22.0% across the entire state of New York.
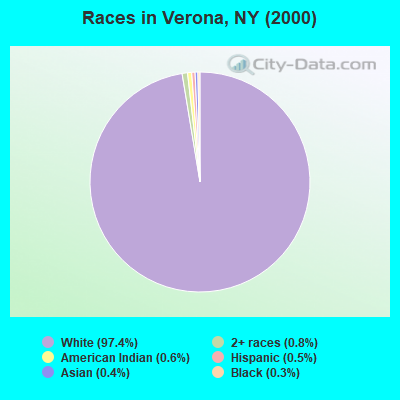
Race distribution in Verona

- 6,25597.4%White alone
- 530.8%Two or more races
- 400.6%American Indian alone
- 300.5%Hispanic
- 240.4%Asian alone
- 210.3%Black alone
- 10.02%Other race alone
- 10.02%Native Hawaiian and Other
Pacific Islander alone
2000
2022
-
- 11,760,98162.0%White alone
- 2,867,58315.1%Hispanic
- 2,812,62314.8%Black alone
- 1,035,9265.5%Asian alone
- 366,1161.9%Two or more races
- 75,4990.4%Other race alone
- 52,4990.3%American Indian alone
- 5,2300.03%Native Hawaiian and Other
Pacific Islander alone
-
- 10,408,93352.9%White alone
- 3,867,29919.7%Hispanic
- 2,633,84013.4%Black alone
- 1,776,2869.0%Asian alone
- 732,6703.7%Two or more races
- 216,1101.1%Other race alone
- 35,0820.2%American Indian alone
- 6,9310.04%Native Hawaiian and Other
Pacific Islander alone
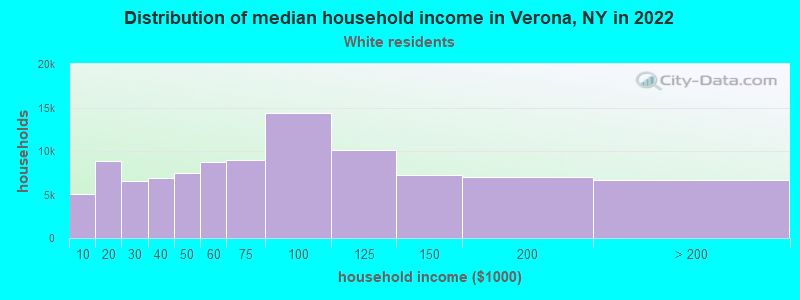
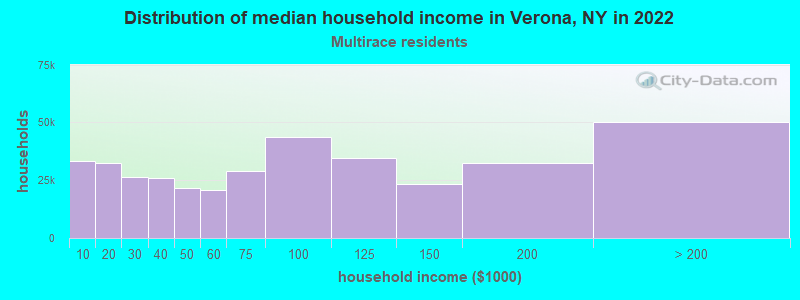
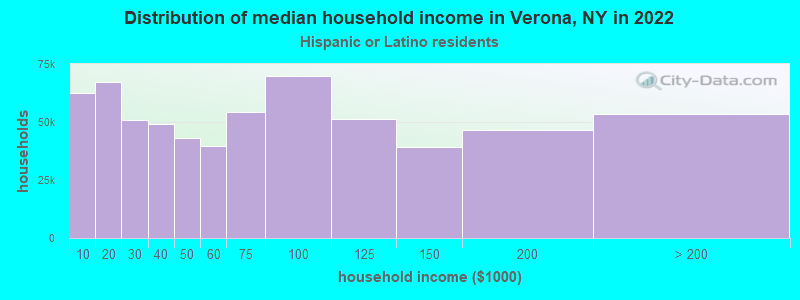
Income and house value in Verona
- Median household income in 2022
- $78,403White non-Hispanic householders
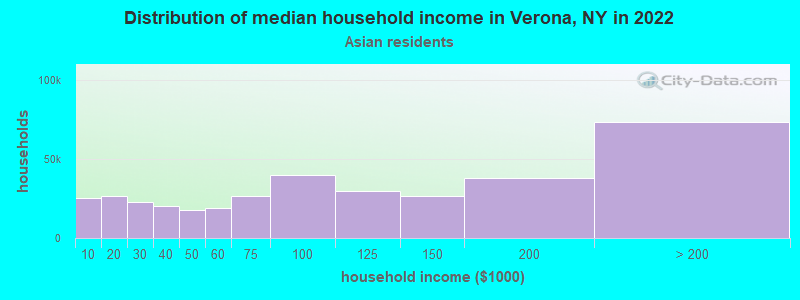
- $88,250Asian householders
- $119,238Two or more races householders
- $94,338Hispanic or Latino race householders
- Median 2022 house value
- $172,716White Non-Hispanic householders
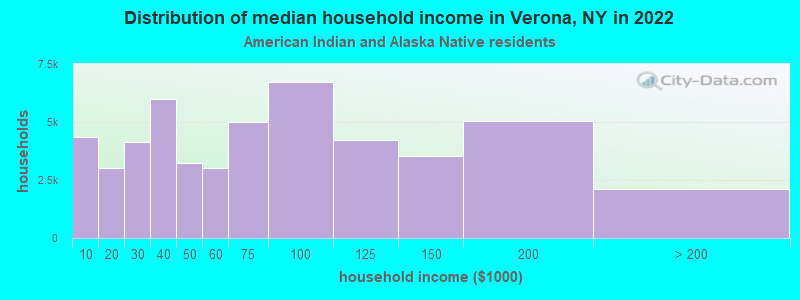
- $258,043American Indian or Alaska Native householders
- $172,028Asian householders
- $149,091Hispanic or Latino householders
Foreign-born residents in Verona
92 residents are foreign born
| This city: | 1.4% |
| New York: | 20.4% |
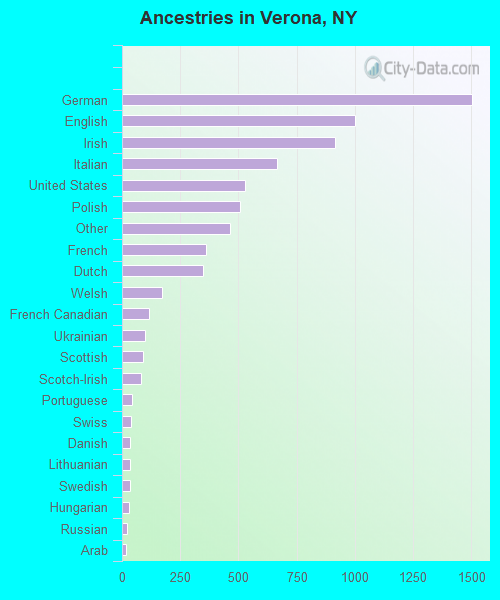
Ancestries in Verona

- 1,50221.0%German
- 1,00214.0%English
- 91612.8%Irish
- 6689.4%Italian
- 5297.4%United States
- 5087.1%Polish
- 4626.5%Other
- 3615.1%French
- 3504.9%Dutch
- 1702.4%Welsh
- 1181.7%French Canadian
- 981.4%Ukrainian
- 901.3%Scottish
- 821.1%Scotch-Irish
- 440.6%Portuguese
- 380.5%Swiss
- 360.5%Danish
- 360.5%Lithuanian
- 350.5%Swedish
- 290.4%Hungarian
- 220.3%Russian
- 180.3%Arab
- 90.1%Czech
- 90.1%Slovak
- 70.10%Greek