Races in Victory Gardens, New Jersey (NJ) Detailed Stats
Data:
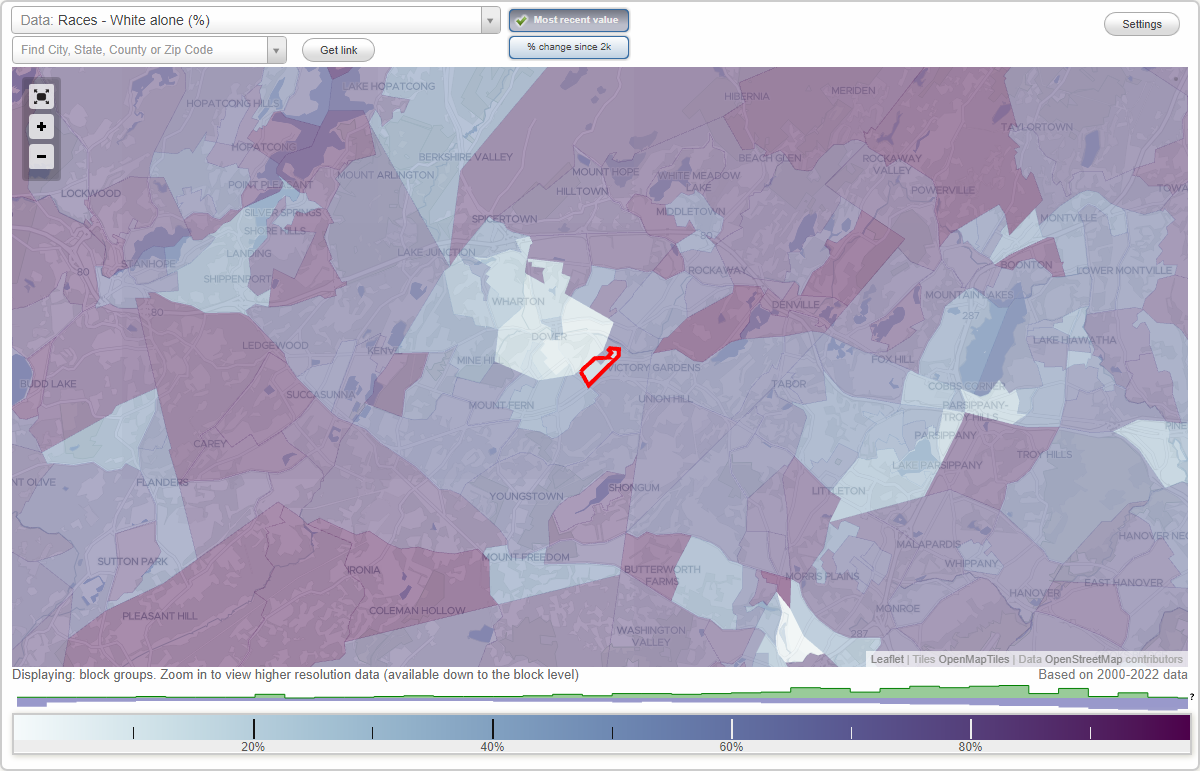
Races - White alone (%)
Races - White alone (% change since 2000)
Races - Black alone (%)
Races - Black alone (% change since 2000)
Races - American Indian alone (%)
Races - American Indian alone (% change since 2000)
Races - Asian alone (%)
Races - Asian alone (% change since 2000)
Races - Hispanic (%)
Races - Hispanic (% change since 2000)
Races - Native Hawaiian and Other Pacific Islander alone (%)
Races - Native Hawaiian and Other Pacific Islander alone (% change since 2000)
Races - Two or more races(%)
Races - Two or more races(% change since 2000)
Races - Other race alone (%)
Races - Other race alone (% change since 2000)
Racial diversity
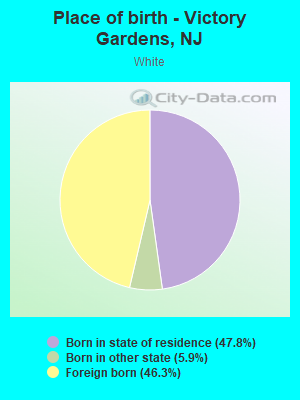
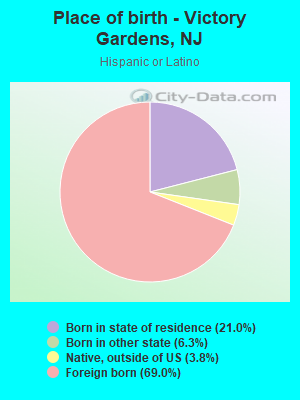
Place of birth - Born in state of residence (%)
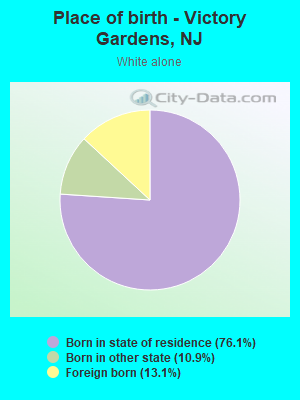
Place of birth - Born in state of residence (%) - White
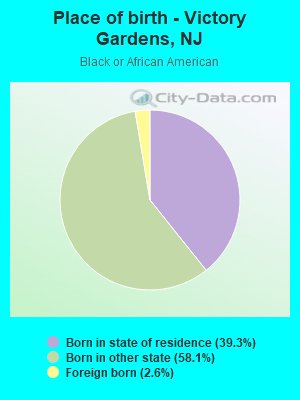
Place of birth - Born in state of residence (%) - Black or African American
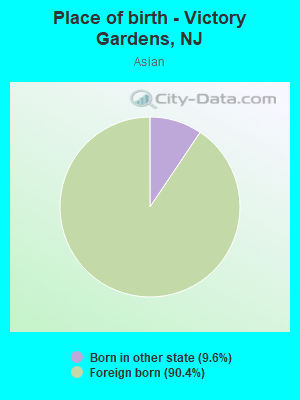
Place of birth - Born in state of residence (%) - Asian
Place of birth - Born in state of residence (%) - Hispanic or Latino
Place of birth - Born in state of residence (%) - American Indian and Alaska Native
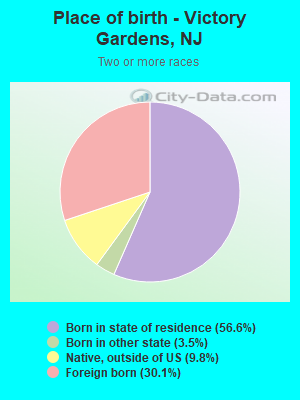
Place of birth - Born in state of residence (%) - Multirace
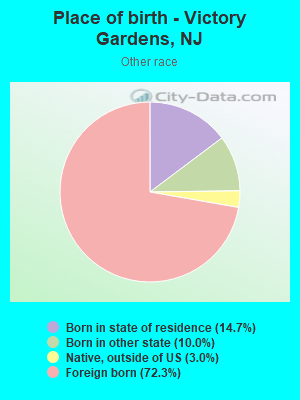
Place of birth - Born in state of residence (%) - Other Race
Place of birth - Born in other state (%)
Place of birth - Born in other state (%) - White
Place of birth - Born in other state (%) - Black or African American
Place of birth - Born in other state (%) - Asian
Place of birth - Born in other state (%) - Hispanic or Latino
Place of birth - Born in other state (%) - American Indian and Alaska Native
Place of birth - Born in other state (%) - Multirace
Place of birth - Born in other state (%) - Other Race
Place of birth - Native, outside of US (%)
Place of birth - Native, outside of US (%) - White
Place of birth - Native, outside of US (%) - Black or African American
Place of birth - Native, outside of US (%) - Asian
Place of birth - Native, outside of US (%) - Hispanic or Latino
Place of birth - Native, outside of US (%) - American Indian and Alaska Native
Place of birth - Native, outside of US (%) - Multirace
Place of birth - Native, outside of US (%) - Other Race
Place of birth - Foreign born (%)
Place of birth - Foreign born (%) - White
Place of birth - Foreign born (%) - Black or African American
Place of birth - Foreign born (%) - Asian
Place of birth - Foreign born (%) - Hispanic or Latino
Place of birth - Foreign born (%) - American Indian and Alaska Native
Place of birth - Foreign born (%) - Multirace
Place of birth - Foreign born (%) - Other Race
Residents speaking English at home (%)
Residents speaking English at home - Born in the United States (%)
Residents speaking English at home - Native, born elsewhere (%)
Residents speaking English at home - Foreign born (%)
Residents speaking Spanish at home (%)
Residents speaking Spanish at home - Born in the United States (%)
Residents speaking Spanish at home - Native, born elsewhere (%)
Residents speaking Spanish at home - Foreign born (%)
Residents speaking other language at home (%)
Residents speaking other language at home - Born in the United States (%)
Residents speaking other language at home - Native, born elsewhere (%)
Residents speaking other language at home - Foreign born (%)
Marital status - Never married (%)
Marital status - Now married (%)
Marital status - Separated (%)
Marital status - Widowed (%)
Marital status - Divorced (%)
Ancestries Reported - Arab (%)
Ancestries Reported - Czech (%)
Ancestries Reported - Danish (%)
Ancestries Reported - Dutch (%)
Ancestries Reported - English (%)
Ancestries Reported - French (%)
Ancestries Reported - French Canadian (%)
Ancestries Reported - German (%)
Ancestries Reported - Greek (%)
Ancestries Reported - Hungarian (%)
Ancestries Reported - Irish (%)
Ancestries Reported - Italian (%)
Ancestries Reported - Lithuanian (%)
Ancestries Reported - Norwegian (%)
Ancestries Reported - Polish (%)
Ancestries Reported - Portuguese (%)
Ancestries Reported - Russian (%)
Ancestries Reported - Scotch-Irish (%)
Ancestries Reported - Scottish (%)
Ancestries Reported - Slovak (%)
Ancestries Reported - Subsaharan African (%)
Ancestries Reported - Swedish (%)
Ancestries Reported - Swiss (%)
Ancestries Reported - Ukrainian (%)
Ancestries Reported - United States (%)
Ancestries Reported - Welsh (%)
Ancestries Reported - West Indian (%)
Ancestries Reported - Other (%)
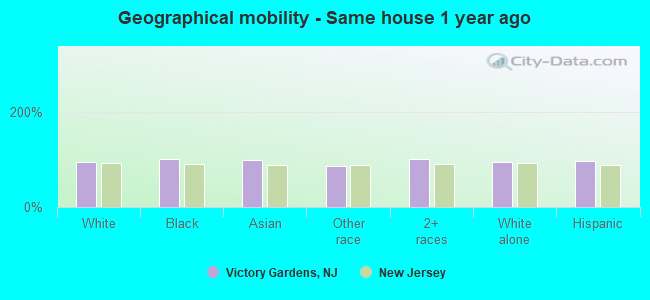
Geographical mobility - Same house 1 year ago (%)
Geographical mobility - Same house 1 year ago (%) - White
Geographical mobility - Same house 1 year ago (%) - Black or African American
Geographical mobility - Same house 1 year ago (%) - Asian
Geographical mobility - Same house 1 year ago (%) - Hispanic or Latino
Geographical mobility - Same house 1 year ago (%) - American Indian and Alaska Native
Geographical mobility - Same house 1 year ago (%) - Multirace
Geographical mobility - Same house 1 year ago (%) - Other Race
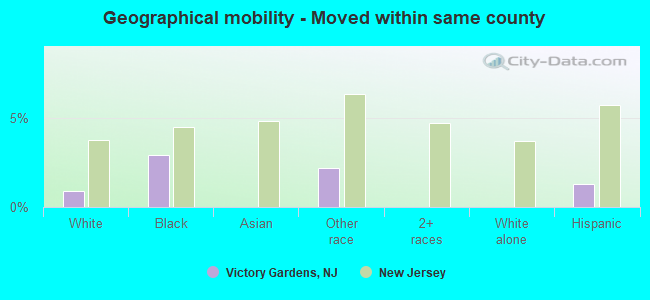
Geographical mobility - Moved within same county (%)
Geographical mobility - Moved within same county (%) - White
Geographical mobility - Moved within same county (%) - Black or African American
Geographical mobility - Moved within same county (%) - Asian
Geographical mobility - Moved within same county (%) - Hispanic or Latino
Geographical mobility - Moved within same county (%) - American Indian and Alaska Native
Geographical mobility - Moved within same county (%) - Multirace
Geographical mobility - Moved within same county (%) - Other Race
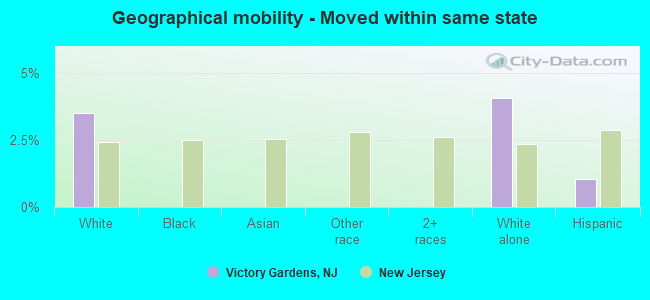
Geographical mobility - Moved from different county within same state (%)
Geographical mobility - Moved from different county within same state (%) - White
Geographical mobility - Moved from different county within same state (%) - Black or African American
Geographical mobility - Moved from different county within same state (%) - Asian
Geographical mobility - Moved from different county within same state (%) - Hispanic or Latino
Geographical mobility - Moved from different county within same state (%) - American Indian and Alaska Native
Geographical mobility - Moved from different county within same state (%) - Multirace
Geographical mobility - Moved from different county within same state (%) - Other Race
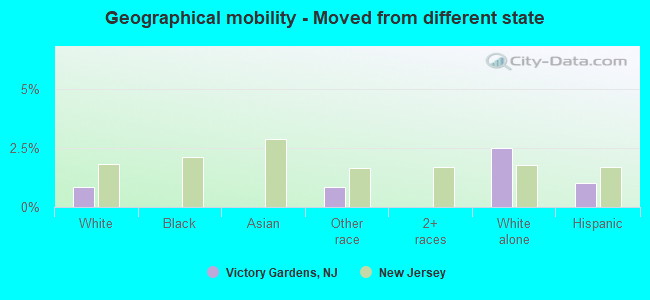
Geographical mobility - Moved from different state (%)
Geographical mobility - Moved from different state (%) - White
Geographical mobility - Moved from different state (%) - Black or African American
Geographical mobility - Moved from different state (%) - Asian
Geographical mobility - Moved from different state (%) - Hispanic or Latino
Geographical mobility - Moved from different state (%) - American Indian and Alaska Native
Geographical mobility - Moved from different state (%) - Multirace
Geographical mobility - Moved from different state (%) - Other Race
Geographical mobility - Moved from abroad (%)
Geographical mobility - Moved from abroad (%) - White
Geographical mobility - Moved from abroad (%) - Black or African American
Geographical mobility - Moved from abroad (%) - Asian
Geographical mobility - Moved from abroad (%) - Hispanic or Latino
Geographical mobility - Moved from abroad (%) - American Indian and Alaska Native
Geographical mobility - Moved from abroad (%) - Multirace
Geographical mobility - Moved from abroad (%) - Other Race
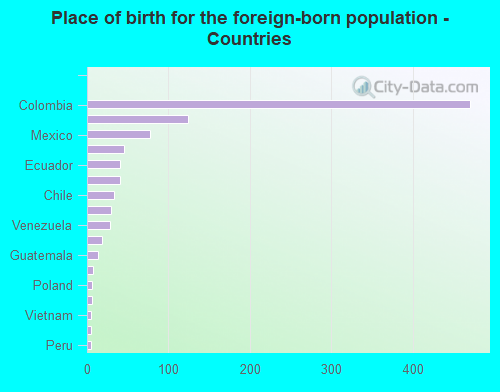
Place of birth for the foreign-born population - Ireland (%)
Place of birth for the foreign-born population - Denmark (%)
Place of birth for the foreign-born population - Norway (%)
Place of birth for the foreign-born population - Sweden (%)
Place of birth for the foreign-born population - United Kingdom (%)
Place of birth for the foreign-born population - England (%)
Place of birth for the foreign-born population - Scotland (%)
Place of birth for the foreign-born population - Other Northern Europe (%)
Place of birth for the foreign-born population - Austria (%)
Place of birth for the foreign-born population - Belgium (%)
Place of birth for the foreign-born population - France (%)
Place of birth for the foreign-born population - Germany (%)
Place of birth for the foreign-born population - Netherlands (%)
Place of birth for the foreign-born population - Switzerland (%)
Place of birth for the foreign-born population - Other Western Europe (%)
Place of birth for the foreign-born population - Greece (%)
Place of birth for the foreign-born population - Italy (%)
Place of birth for the foreign-born population - Portugal (%)
Place of birth for the foreign-born population - Spain (%)
Place of birth for the foreign-born population - Other Southern Europe (%)
Place of birth for the foreign-born population - Albania (%)
Place of birth for the foreign-born population - Belarus (%)
Place of birth for the foreign-born population - Bosnia and Herzegovina (%)
Place of birth for the foreign-born population - Bulgaria (%)
Place of birth for the foreign-born population - Croatia (%)
Place of birth for the foreign-born population - Czechoslovakia (%)
Place of birth for the foreign-born population - Hungary (%)
Place of birth for the foreign-born population - Latvia (%)
Place of birth for the foreign-born population - Lithuania (%)
Place of birth for the foreign-born population - North Macedonia (Macedonia) (%)
Place of birth for the foreign-born population - Moldova (%)
Place of birth for the foreign-born population - Poland (%)
Place of birth for the foreign-born population - Romania (%)
Place of birth for the foreign-born population - Russia (%)
Place of birth for the foreign-born population - Serbia (%)
Place of birth for the foreign-born population - Ukraine (%)
Place of birth for the foreign-born population - Other Eastern Europe (%)
Place of birth for the foreign-born population - China (%)
Place of birth for the foreign-born population - Hong Kong (%)
Place of birth for the foreign-born population - Taiwan (%)
Place of birth for the foreign-born population - Japan (%)
Place of birth for the foreign-born population - Korea (%)
Place of birth for the foreign-born population - Other Eastern Asia (%)
Place of birth for the foreign-born population - Afghanistan (%)
Place of birth for the foreign-born population - Bangladesh (%)
Place of birth for the foreign-born population - India (%)
Place of birth for the foreign-born population - Iran (%)
Place of birth for the foreign-born population - Kazakhstan (%)
Place of birth for the foreign-born population - Nepal (%)
Place of birth for the foreign-born population - Pakistan (%)
Place of birth for the foreign-born population - Sri Lanka (%)
Place of birth for the foreign-born population - Uzbekistan (%)
Place of birth for the foreign-born population - Other South Central Asia (%)
Place of birth for the foreign-born population - Burma (%)
Place of birth for the foreign-born population - Cambodia (%)
Place of birth for the foreign-born population - Indonesia (%)
Place of birth for the foreign-born population - Laos (%)
Place of birth for the foreign-born population - Malaysia (%)
Place of birth for the foreign-born population - Philippines (%)
Place of birth for the foreign-born population - Singapore (%)
Place of birth for the foreign-born population - Thailand (%)
Place of birth for the foreign-born population - Vietnam (%)
Place of birth for the foreign-born population - Other South Eastern Asia (%)
Place of birth for the foreign-born population - Armenia (%)
Place of birth for the foreign-born population - Iraq (%)
Place of birth for the foreign-born population - Israel (%)
Place of birth for the foreign-born population - Jordan (%)
Place of birth for the foreign-born population - Kuwait (%)
Place of birth for the foreign-born population - Lebanon (%)
Place of birth for the foreign-born population - Saudi Arabia (%)
Place of birth for the foreign-born population - Syria (%)
Place of birth for the foreign-born population - Turkey (%)
Place of birth for the foreign-born population - Yemen (%)
Place of birth for the foreign-born population - Other Western Asia (%)
Place of birth for the foreign-born population - Eritrea (%)
Place of birth for the foreign-born population - Ethiopia (%)
Place of birth for the foreign-born population - Kenya (%)
Place of birth for the foreign-born population - Somalia (%)
Place of birth for the foreign-born population - Uganda (%)
Place of birth for the foreign-born population - Zimbabwe (%)
Place of birth for the foreign-born population - Other Eastern Africa (%)
Place of birth for the foreign-born population - Cameroon (%)
Place of birth for the foreign-born population - Congo (%)
Place of birth for the foreign-born population - Democratic Republic of Congo (Zaire) (%)
Place of birth for the foreign-born population - Other Middle Africa (%)
Place of birth for the foreign-born population - Egypt (%)
Place of birth for the foreign-born population - Morocco (%)
Place of birth for the foreign-born population - Sudan (%)
Place of birth for the foreign-born population - Other Northern Africa (%)
Place of birth for the foreign-born population - South Africa (%)
Place of birth for the foreign-born population - Other Southern Africa (%)
Place of birth for the foreign-born population - Cabo Verde (%)
Place of birth for the foreign-born population - Ghana (%)
Place of birth for the foreign-born population - Liberia (%)
Place of birth for the foreign-born population - Nigeria (%)
Place of birth for the foreign-born population - Senegal (%)
Place of birth for the foreign-born population - Sierra Leone (%)
Place of birth for the foreign-born population - Other Western Africa (%)
Place of birth for the foreign-born population - Australia (%)
Place of birth for the foreign-born population - New Zealand (%)
Place of birth for the foreign-born population - Fiji (%)
Place of birth for the foreign-born population - Micronesia (%)
Place of birth for the foreign-born population - Bahamas (%)
Place of birth for the foreign-born population - Barbados (%)
Place of birth for the foreign-born population - Cuba (%)
Place of birth for the foreign-born population - Dominica (%)
Place of birth for the foreign-born population - Dominican Republic (%)
Place of birth for the foreign-born population - Grenada (%)
Place of birth for the foreign-born population - Haiti (%)
Place of birth for the foreign-born population - Jamaica (%)
Place of birth for the foreign-born population - St. Vincent and the Grenadines (%)
Place of birth for the foreign-born population - Trinidad and Tobago (%)
Place of birth for the foreign-born population - West Indies (%)
Place of birth for the foreign-born population - Other Caribbean (%)
Place of birth for the foreign-born population - Belize (%)
Place of birth for the foreign-born population - Costa Rica (%)
Place of birth for the foreign-born population - El Salvador (%)
Place of birth for the foreign-born population - Guatemala (%)
Place of birth for the foreign-born population - Honduras (%)
Place of birth for the foreign-born population - Mexico (%)
Place of birth for the foreign-born population - Nicaragua (%)
Place of birth for the foreign-born population - Panama (%)
Place of birth for the foreign-born population - Other Central America (%)
Place of birth for the foreign-born population - Argentina (%)
Place of birth for the foreign-born population - Bolivia (%)
Place of birth for the foreign-born population - Brazil (%)
Place of birth for the foreign-born population - Chile (%)
Place of birth for the foreign-born population - Colombia (%)
Place of birth for the foreign-born population - Ecuador (%)
Place of birth for the foreign-born population - Guyana (%)
Place of birth for the foreign-born population - Peru (%)
Place of birth for the foreign-born population - Uruguay (%)
Place of birth for the foreign-born population - Venezuela (%)
Place of birth for the foreign-born population - Other South America (%)
Place of birth for the foreign-born population - Canada (%)
Place of birth for the foreign-born population - Other Northern America (%)
Place of birth for the foreign-born population - Other (%)
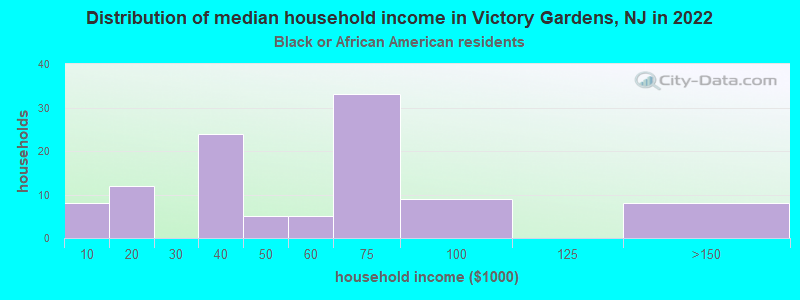
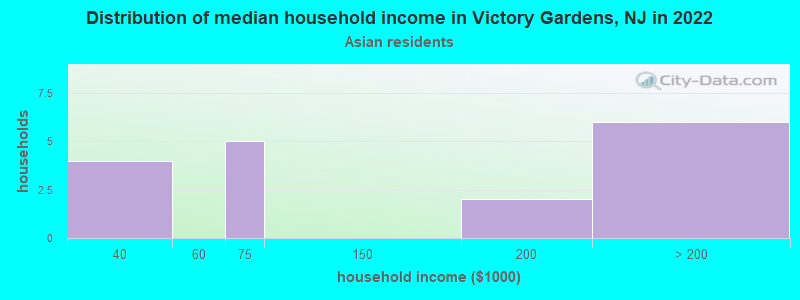
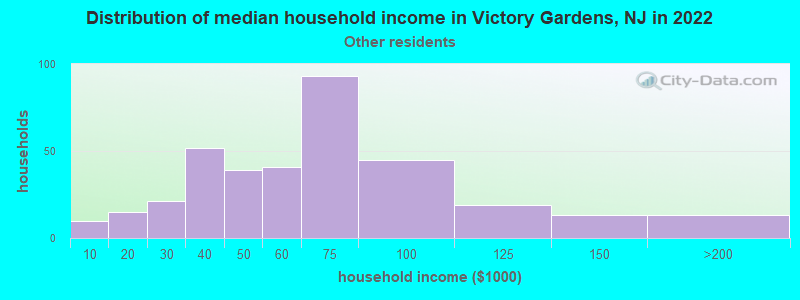
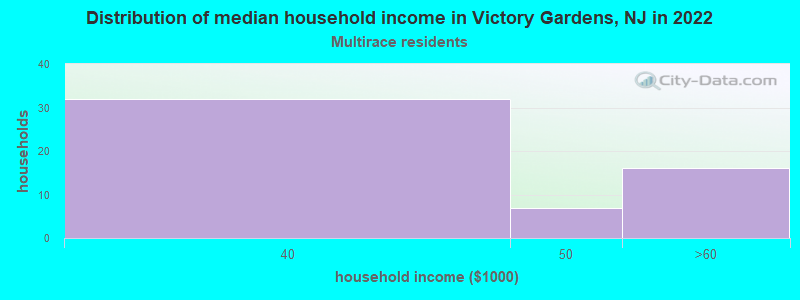
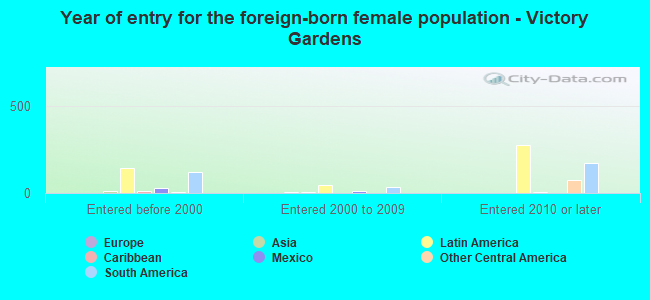
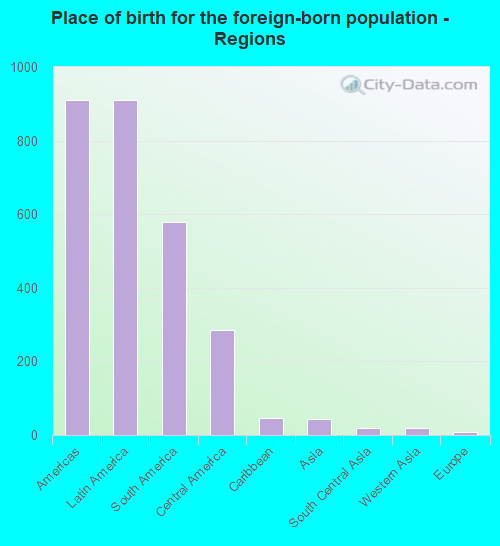
According to 2022 data, the most numerous races in Victory Gardens, NJ are White alone (195 residents), Hispanic (1,377 residents), and Black alone (161 residents). 23.3% of Victory Gardens residents speak English at home. 54.9% of Victory Gardens, NJ residents are foreign-born (50.9% born in Latin America), which is 58.1% greater than the foreign-born rate of 23.0% across the entire state of New Jersey.
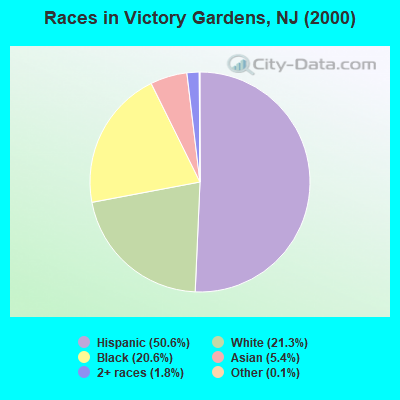
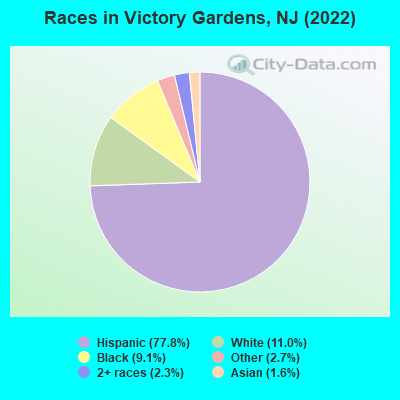
Race distribution in Victory Gardens
2000 2022
5,557,209 66.0% White alone 1,117,191 13.3% Hispanic 1,096,171 13.0% Black alone 477,012 5.7% Asian alone 133,689 1.6% Two or more races 19,565 0.2% Other race alone 11,338 0.1% American Indian alone 2,175 0.03% Native Hawaiian and Other
4,766,476 51.5% White alone 2,028,470 21.9% Hispanic 1,111,632 12.0% Black alone 923,546 10.0% Asian alone 332,237 3.6% Two or more races 89,847 1.0% Other race alone 8,557 0.09% American Indian alone 934 0.01% Native Hawaiian and Other
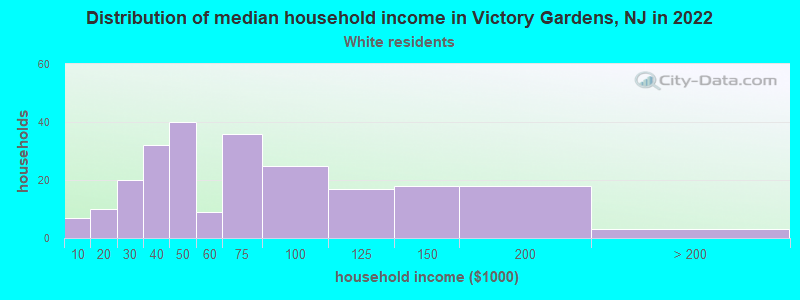
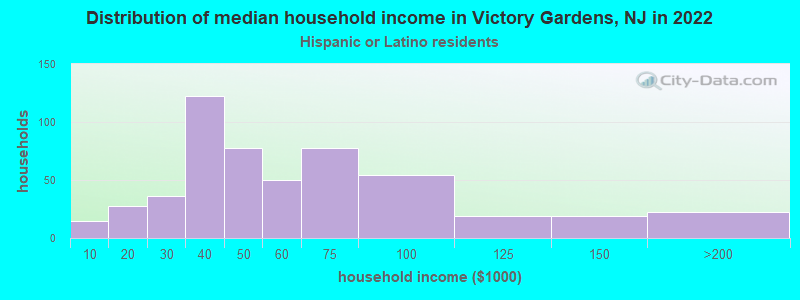
Income and house value in Victory Gardens Median household income in 2022 $60,872 White non-Hispanic householders$86,273 Black householders$175,354 Asian householders$56,986 Some other race householders$38,351 Two or more races householders$53,104 Hispanic or Latino race householdersMedian 2022 house value $211,421 White Non-Hispanic householders$247,341 Black or African American householders $268,424 Asian householders$211,421 Some other race householders$235,823 Two or more races householders$223,524 Hispanic or Latino householders
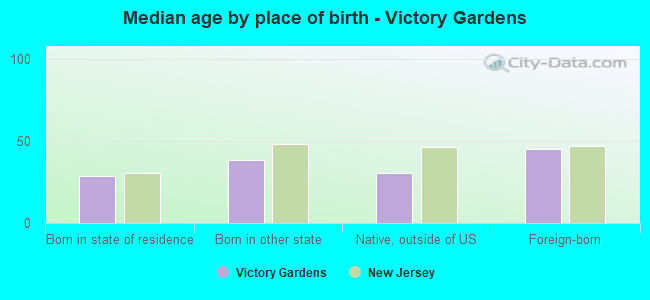
Median age by race in Victory Gardens
38.6 Median age for White residents32.1 42.0 44.8 Median age for Black or African American residents61.6 41.8 -847,710,329.3 Median age for American Indian / Alaska Native residents-707,246,376.1 -671,264,367.1 47.5 Median age for Asian residents50.2 44.8 -804,177,544.9 Median age for Native Hawaiian / Pacific Islander residents-666,666,666.0 -713,070,378.3 36.8 Median age for Other race residents39.5 34.7 49.2 Median age for Two or more races residents30.7 52.0 41.5 Median age for White alone residents39.3 46.9 39.0 Median age for Hispanic or Latino residents37.5 39.9
Owner/renter occupied households by race in Victory Gardens
House owners and renters - White residents 105 43.5% Owner occupied136 56.5% Renter occupiedHouse owners and renters - Black or African American residents 66 61.2% Owner occupied42 38.8% Renter occupiedHouse owners and renters - Asian residents 14 90.0% Owner occupied2 10.0% Renter occupiedHouse owners and renters - Other race residents 61 16.2% Owner occupied313 83.8% Renter occupiedHouse owners and renters - Two or more races residents 20 36.0% Owner occupied35 64.0% Renter occupiedHouse owners and renters - White alone residents 67 63.4% Owner occupied39 36.6% Renter occupiedHouse owners and renters - Hispanic or Latino residents 112 24.6% Owner occupied341 75.4% Renter occupied
Language usage in Victory Gardens
English speakers - Total 23.3% of residents of Victory Gardens speak English at home.
71.1% of residents speak Spanish at home 514 43.6% Speak English very well666 56.4% Speak English less than very well3.4% of residents speak other language at home 32 57.1% Speak English very well24 42.9% Speak English less than very well
English speakers - Born in the United States 74.5% of residents of Victory Gardens speak English at home.
27.6% of residents speak Spanish at home 40 100.0% Speak English very well1.4% of residents speak other language at home 2 100.0% Speak English very well
English speakers - Native, born elsewhere 0.0% of residents of Victory Gardens speak English at home.
97.7% of residents speak Spanish at home 29 67.4% Speak English very well14 32.6% Speak English less than very well
English speakers - Foreign-born 2.7% of residents of Victory Gardens speak English at home.
93.4% of residents speak Spanish at home 249 28.4% Speak English very well628 71.6% Speak English less than very well5.4% of residents speak other language at home 27 52.9% Speak English very well24 47.1% Speak English less than very well
White (Caucasian) - Speak only English Native:
60.3% (130)Foreign-born:
1.1% (3)
White (Caucasian) - Speak another language Native:
32.6% (70)Foreign-born:
90.9% (200)
Black or African American - Speak only English Native:
90.9% (203)Foreign-born:
37.2% (2)
Black or African American - Speak another language Native:
9.0% (20)Foreign-born:
56.1% (3)
Asian - Speak another language Native:
96.0% (2)Foreign-born:
100.0% (25)
Other race - Speak only English Native:
5.5% (11)Foreign-born:
4.2% (31)
Other race - Speak another language Native:
98.8% (189)Foreign-born:
95.6% (705)
Two or more races - Speak another language Native:
71.6% (130)Foreign-born:
97.9% (74)
White alone - Speak only English Native:
77.3% (127)Foreign-born:
10.2% (3)
White alone - Speak another language Native:
23.2% (38)Foreign-born:
92.7% (24)
Hispanic or Latino - Speak only English Native:
21.9% (83)Foreign-born:
3.3% (31)
Hispanic or Latino - Speak another language Native:
75.8% (287)Foreign-born:
95.1% (895)
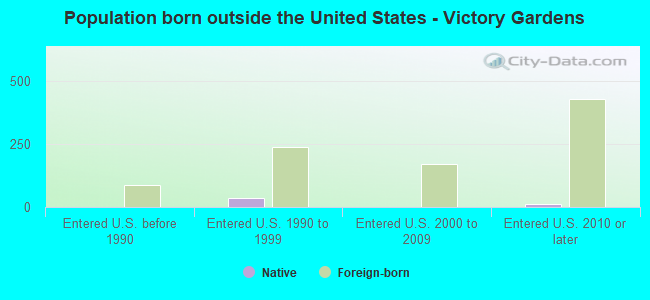
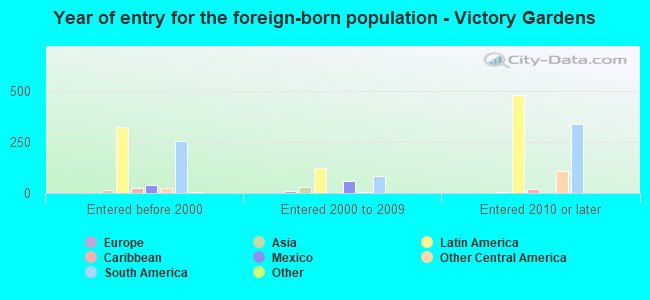
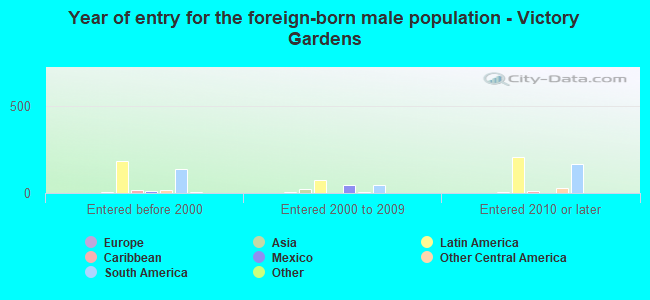
Foreign-born residents in Victory Gardens 971 residents are foreign born (50.9% Latin America ).
This city:
54.9%New Jersey:
23.2%
Marital status for residents in Victory Gardens Marital status - White (Caucasian) population 15 years and over
Males 40.3% Never married46.4% Now married0.0% Separated0.0% Widowed13.3% DivorcedFemales 41.6% Never married35.6% Now married2.1% Separated3.4% Widowed17.2% DivorcedWomen who gave birth in the past 12 months Now married:
0.0% (0)Unmarried:
100.0% (13)
Women who did not give birth in the past 12 months Now married:
46.7% (57)Unmarried:
53.3% (65)
Marital status - Black or African American population 15 years and over
Males 31.9% Never married31.9% Now married0.0% Separated19.1% Widowed17.0% DivorcedFemales 63.0% Never married2.6% Now married0.0% Separated11.7% Widowed22.7% DivorcedWomen who did not give birth in the past 12 months Now married:
0.0% (0)Unmarried:
100.0% (80)
Marital status - Asian population 15 years and over
Males 43.8% Never married56.2% Now married0.0% Separated0.0% Widowed0.0% DivorcedFemales 41.7% Never married58.3% Now married0.0% Separated0.0% Widowed0.0% DivorcedWomen who did not give birth in the past 12 months Now married:
71.4% (5)Unmarried:
28.6% (2)
Marital status - Other race population 15 years and over
Males 38.7% Never married50.8% Now married0.0% Separated4.8% Widowed5.6% DivorcedFemales 27.9% Never married53.3% Now married4.0% Separated10.9% Widowed4.0% DivorcedWomen who did not give birth in the past 12 months Now married:
47.2% (111)Unmarried:
52.8% (125)
Marital status - Two or more races population 15 years and over
Males 41.2% Never married58.8% Now married0.0% Separated0.0% Widowed0.0% DivorcedFemales 44.7% Never married49.4% Now married0.0% Separated5.9% Widowed0.0% DivorcedWomen who did not give birth in the past 12 months Now married:
47.1% (33)Unmarried:
52.9% (37)
Marital status - White alone, not Hispanic / Latino population 15 years and over
Males 63.4% Never married24.4% Now married0.0% Separated0.0% Widowed12.2% DivorcedFemales 40.0% Never married24.2% Now married0.0% Separated8.4% Widowed27.4% DivorcedWomen who gave birth in the past 12 months Now married:
0.0% (0)Unmarried:
100.0% (14)
Women who did not give birth in the past 12 months Now married:
48.4% (14)Unmarried:
51.6% (15)
Marital status - Hispanic or Latino population 15 years and over
Males 36.0% Never married53.5% Now married0.0% Separated2.9% Widowed7.6% DivorcedFemales 39.0% Never married47.4% Now married3.0% Separated5.7% Widowed4.8% DivorcedWomen who did not give birth in the past 12 months Now married:
42.4% (162)Unmarried:
57.6% (221)
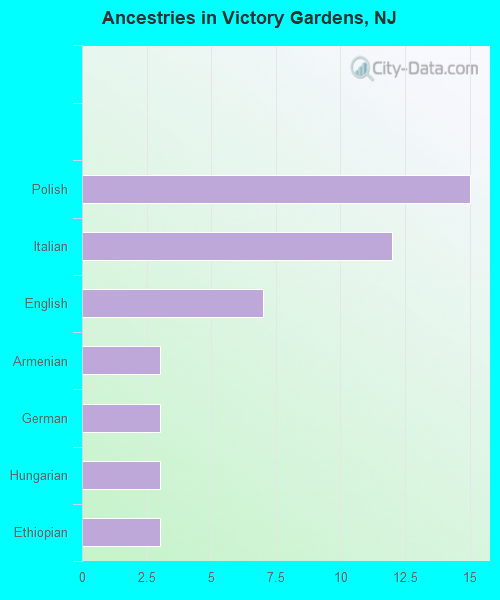
Ancestries in Victory Gardens
15 1.2% Polish12 0.9% Italian7 0.5% English3 0.2% Armenian3 0.2% German3 0.2% Hungarian3 0.2% Ethiopian
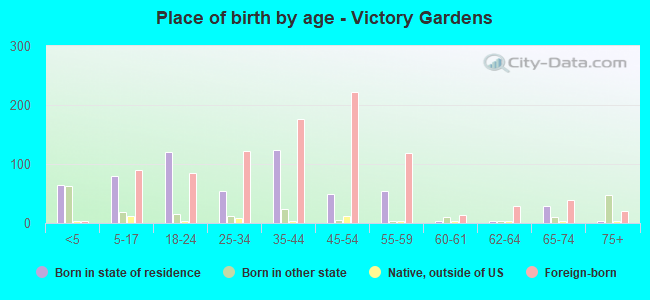
Children Nativity (place of birth) in Victory Gardens
Children under 6 years - Living with two parents Both parents native 6 100.0% NativeBoth parents foreign-born 65 100.0% NativeChildren under 6 years - Living with one parent Native parent 33 100.0% NativeForeign-born parent 9 48.0% Native10 52.0% Foreign-bornChildren 6 to 17 years - Living with two parents Both parents native 13 100.0% NativeBoth parents foreign-born 52 52.8% Native47 47.2% Foreign-bornChildren 6 to 17 years - Living with one parent Native parent 34 100.0% Foreign-bornForeign-born parent 51 84.6% Native9 15.4% Foreign-born
Grandparents responsible for own grandchildren in Victory Gardens
Grandparents (30 to 59 years) Other race 13 59.6% Responsible for grandchildren9 40.4% Not responsible for grandchildrenHispanic or Latino 11 61.8% Responsible for grandchildren7 38.2% Not responsible for grandchildren
Grandparents (60 years and over) Other race 6 100.0% Not responsible for grandchildrenHispanic or Latino 5 100.0% Not responsible for grandchildren