Races in Villa Rica, Georgia (GA) Detailed Stats
Data:
Races - White alone (%)
Races - White alone (% change since 2000)
Races - Black alone (%)
Races - Black alone (% change since 2000)
Races - American Indian alone (%)
Races - American Indian alone (% change since 2000)
Races - Asian alone (%)
Races - Asian alone (% change since 2000)
Races - Hispanic (%)
Races - Hispanic (% change since 2000)
Races - Native Hawaiian and Other Pacific Islander alone (%)
Races - Native Hawaiian and Other Pacific Islander alone (% change since 2000)
Races - Two or more races(%)
Races - Two or more races(% change since 2000)
Races - Other race alone (%)
Races - Other race alone (% change since 2000)
Racial diversity
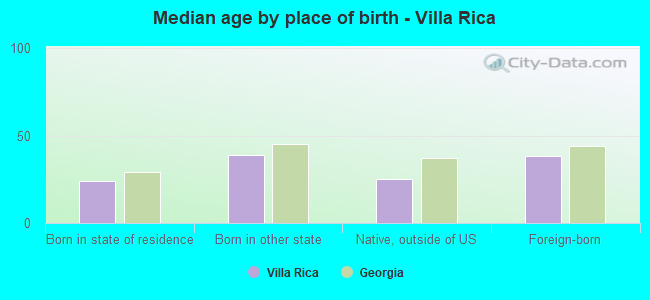
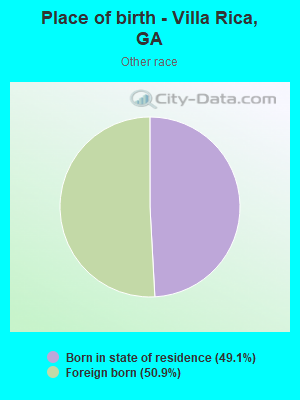
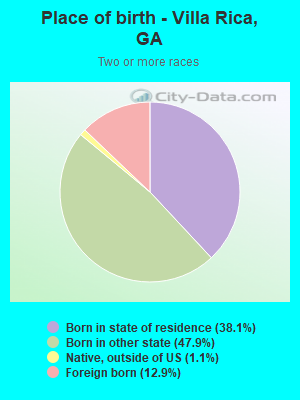
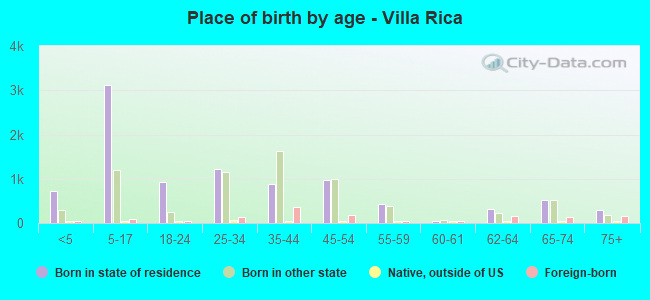
Place of birth - Born in state of residence (%)
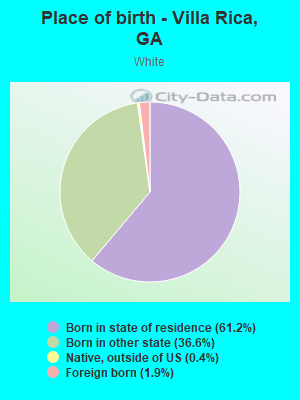
Place of birth - Born in state of residence (%) - White
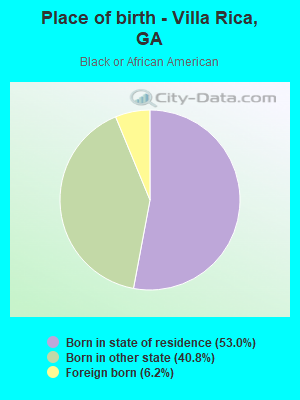
Place of birth - Born in state of residence (%) - Black or African American
Place of birth - Born in state of residence (%) - Asian
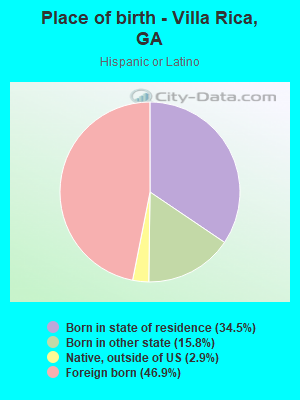
Place of birth - Born in state of residence (%) - Hispanic or Latino
Place of birth - Born in state of residence (%) - American Indian and Alaska Native
Place of birth - Born in state of residence (%) - Multirace
Place of birth - Born in state of residence (%) - Other Race
Place of birth - Born in other state (%)
Place of birth - Born in other state (%) - White
Place of birth - Born in other state (%) - Black or African American
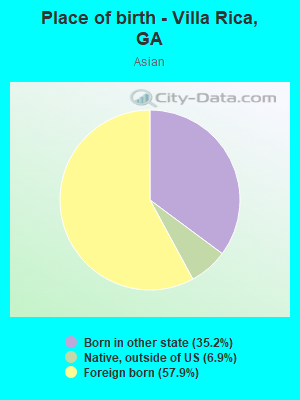
Place of birth - Born in other state (%) - Asian
Place of birth - Born in other state (%) - Hispanic or Latino
Place of birth - Born in other state (%) - American Indian and Alaska Native
Place of birth - Born in other state (%) - Multirace
Place of birth - Born in other state (%) - Other Race
Place of birth - Native, outside of US (%)
Place of birth - Native, outside of US (%) - White
Place of birth - Native, outside of US (%) - Black or African American
Place of birth - Native, outside of US (%) - Asian
Place of birth - Native, outside of US (%) - Hispanic or Latino
Place of birth - Native, outside of US (%) - American Indian and Alaska Native
Place of birth - Native, outside of US (%) - Multirace
Place of birth - Native, outside of US (%) - Other Race
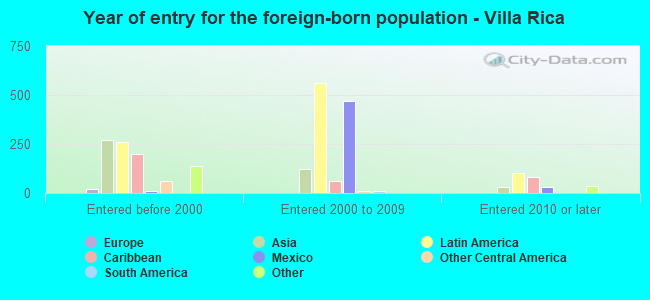
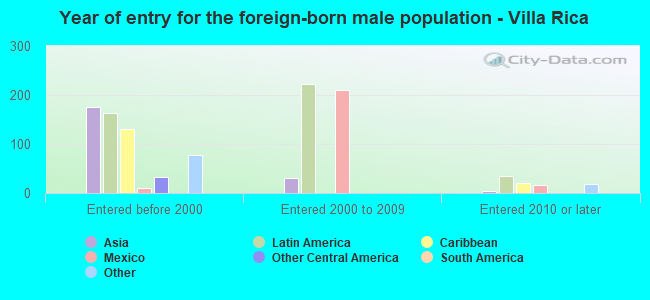
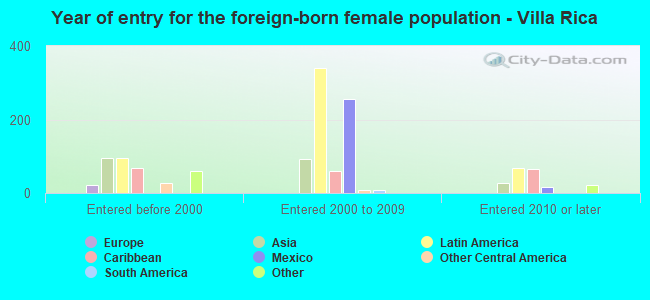
Place of birth - Foreign born (%)
Place of birth - Foreign born (%) - White
Place of birth - Foreign born (%) - Black or African American
Place of birth - Foreign born (%) - Asian
Place of birth - Foreign born (%) - Hispanic or Latino
Place of birth - Foreign born (%) - American Indian and Alaska Native
Place of birth - Foreign born (%) - Multirace
Place of birth - Foreign born (%) - Other Race
Residents speaking English at home (%)
Residents speaking English at home - Born in the United States (%)
Residents speaking English at home - Native, born elsewhere (%)
Residents speaking English at home - Foreign born (%)
Residents speaking Spanish at home (%)
Residents speaking Spanish at home - Born in the United States (%)
Residents speaking Spanish at home - Native, born elsewhere (%)
Residents speaking Spanish at home - Foreign born (%)
Residents speaking other language at home (%)
Residents speaking other language at home - Born in the United States (%)
Residents speaking other language at home - Native, born elsewhere (%)
Residents speaking other language at home - Foreign born (%)
Marital status - Never married (%)
Marital status - Now married (%)
Marital status - Separated (%)
Marital status - Widowed (%)
Marital status - Divorced (%)
Ancestries Reported - Arab (%)
Ancestries Reported - Czech (%)
Ancestries Reported - Danish (%)
Ancestries Reported - Dutch (%)
Ancestries Reported - English (%)
Ancestries Reported - French (%)
Ancestries Reported - French Canadian (%)
Ancestries Reported - German (%)
Ancestries Reported - Greek (%)
Ancestries Reported - Hungarian (%)
Ancestries Reported - Irish (%)
Ancestries Reported - Italian (%)
Ancestries Reported - Lithuanian (%)
Ancestries Reported - Norwegian (%)
Ancestries Reported - Polish (%)
Ancestries Reported - Portuguese (%)
Ancestries Reported - Russian (%)
Ancestries Reported - Scotch-Irish (%)
Ancestries Reported - Scottish (%)
Ancestries Reported - Slovak (%)
Ancestries Reported - Subsaharan African (%)
Ancestries Reported - Swedish (%)
Ancestries Reported - Swiss (%)
Ancestries Reported - Ukrainian (%)
Ancestries Reported - United States (%)
Ancestries Reported - Welsh (%)
Ancestries Reported - West Indian (%)
Ancestries Reported - Other (%)
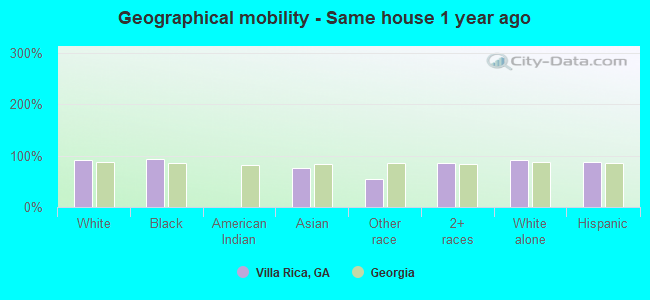
Geographical mobility - Same house 1 year ago (%)
Geographical mobility - Same house 1 year ago (%) - White
Geographical mobility - Same house 1 year ago (%) - Black or African American
Geographical mobility - Same house 1 year ago (%) - Asian
Geographical mobility - Same house 1 year ago (%) - Hispanic or Latino
Geographical mobility - Same house 1 year ago (%) - American Indian and Alaska Native
Geographical mobility - Same house 1 year ago (%) - Multirace
Geographical mobility - Same house 1 year ago (%) - Other Race
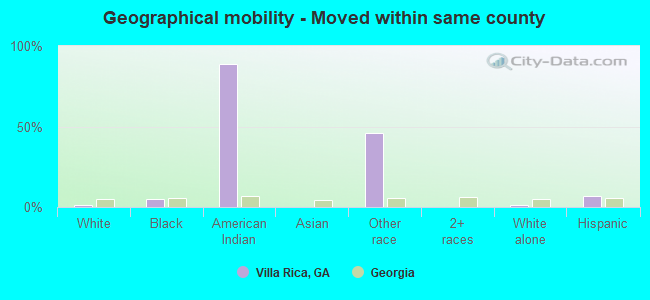
Geographical mobility - Moved within same county (%)
Geographical mobility - Moved within same county (%) - White
Geographical mobility - Moved within same county (%) - Black or African American
Geographical mobility - Moved within same county (%) - Asian
Geographical mobility - Moved within same county (%) - Hispanic or Latino
Geographical mobility - Moved within same county (%) - American Indian and Alaska Native
Geographical mobility - Moved within same county (%) - Multirace
Geographical mobility - Moved within same county (%) - Other Race
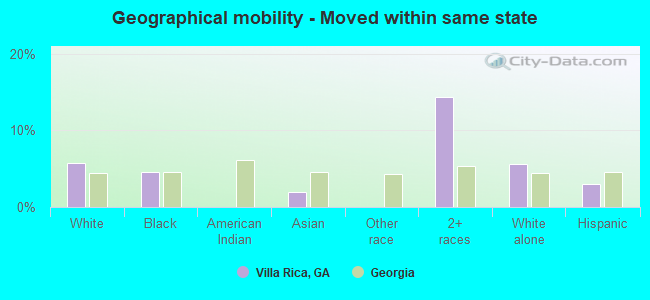
Geographical mobility - Moved from different county within same state (%)
Geographical mobility - Moved from different county within same state (%) - White
Geographical mobility - Moved from different county within same state (%) - Black or African American
Geographical mobility - Moved from different county within same state (%) - Asian
Geographical mobility - Moved from different county within same state (%) - Hispanic or Latino
Geographical mobility - Moved from different county within same state (%) - American Indian and Alaska Native
Geographical mobility - Moved from different county within same state (%) - Multirace
Geographical mobility - Moved from different county within same state (%) - Other Race
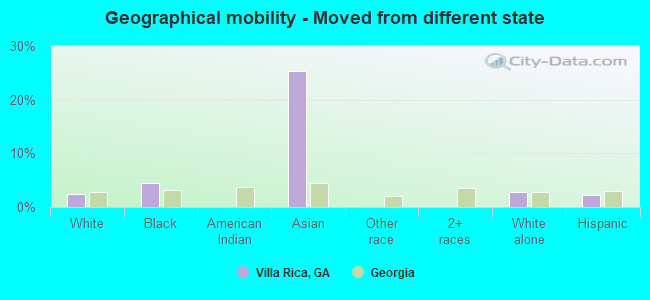
Geographical mobility - Moved from different state (%)
Geographical mobility - Moved from different state (%) - White
Geographical mobility - Moved from different state (%) - Black or African American
Geographical mobility - Moved from different state (%) - Asian
Geographical mobility - Moved from different state (%) - Hispanic or Latino
Geographical mobility - Moved from different state (%) - American Indian and Alaska Native
Geographical mobility - Moved from different state (%) - Multirace
Geographical mobility - Moved from different state (%) - Other Race
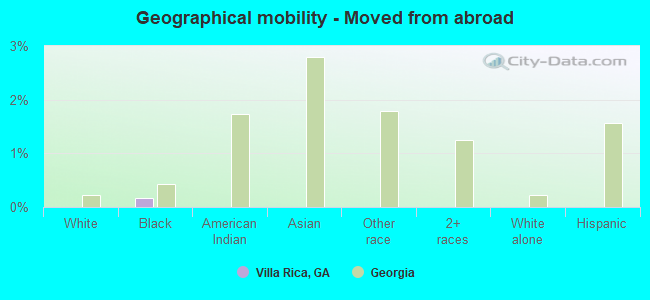
Geographical mobility - Moved from abroad (%)
Geographical mobility - Moved from abroad (%) - White
Geographical mobility - Moved from abroad (%) - Black or African American
Geographical mobility - Moved from abroad (%) - Asian
Geographical mobility - Moved from abroad (%) - Hispanic or Latino
Geographical mobility - Moved from abroad (%) - American Indian and Alaska Native
Geographical mobility - Moved from abroad (%) - Multirace
Geographical mobility - Moved from abroad (%) - Other Race
Place of birth for the foreign-born population - Ireland (%)
Place of birth for the foreign-born population - Denmark (%)
Place of birth for the foreign-born population - Norway (%)
Place of birth for the foreign-born population - Sweden (%)
Place of birth for the foreign-born population - United Kingdom (%)
Place of birth for the foreign-born population - England (%)
Place of birth for the foreign-born population - Scotland (%)
Place of birth for the foreign-born population - Other Northern Europe (%)
Place of birth for the foreign-born population - Austria (%)
Place of birth for the foreign-born population - Belgium (%)
Place of birth for the foreign-born population - France (%)
Place of birth for the foreign-born population - Germany (%)
Place of birth for the foreign-born population - Netherlands (%)
Place of birth for the foreign-born population - Switzerland (%)
Place of birth for the foreign-born population - Other Western Europe (%)
Place of birth for the foreign-born population - Greece (%)
Place of birth for the foreign-born population - Italy (%)
Place of birth for the foreign-born population - Portugal (%)
Place of birth for the foreign-born population - Spain (%)
Place of birth for the foreign-born population - Other Southern Europe (%)
Place of birth for the foreign-born population - Albania (%)
Place of birth for the foreign-born population - Belarus (%)
Place of birth for the foreign-born population - Bosnia and Herzegovina (%)
Place of birth for the foreign-born population - Bulgaria (%)
Place of birth for the foreign-born population - Croatia (%)
Place of birth for the foreign-born population - Czechoslovakia (%)
Place of birth for the foreign-born population - Hungary (%)
Place of birth for the foreign-born population - Latvia (%)
Place of birth for the foreign-born population - Lithuania (%)
Place of birth for the foreign-born population - North Macedonia (Macedonia) (%)
Place of birth for the foreign-born population - Moldova (%)
Place of birth for the foreign-born population - Poland (%)
Place of birth for the foreign-born population - Romania (%)
Place of birth for the foreign-born population - Russia (%)
Place of birth for the foreign-born population - Serbia (%)
Place of birth for the foreign-born population - Ukraine (%)
Place of birth for the foreign-born population - Other Eastern Europe (%)
Place of birth for the foreign-born population - China (%)
Place of birth for the foreign-born population - Hong Kong (%)
Place of birth for the foreign-born population - Taiwan (%)
Place of birth for the foreign-born population - Japan (%)
Place of birth for the foreign-born population - Korea (%)
Place of birth for the foreign-born population - Other Eastern Asia (%)
Place of birth for the foreign-born population - Afghanistan (%)
Place of birth for the foreign-born population - Bangladesh (%)
Place of birth for the foreign-born population - India (%)
Place of birth for the foreign-born population - Iran (%)
Place of birth for the foreign-born population - Kazakhstan (%)
Place of birth for the foreign-born population - Nepal (%)
Place of birth for the foreign-born population - Pakistan (%)
Place of birth for the foreign-born population - Sri Lanka (%)
Place of birth for the foreign-born population - Uzbekistan (%)
Place of birth for the foreign-born population - Other South Central Asia (%)
Place of birth for the foreign-born population - Burma (%)
Place of birth for the foreign-born population - Cambodia (%)
Place of birth for the foreign-born population - Indonesia (%)
Place of birth for the foreign-born population - Laos (%)
Place of birth for the foreign-born population - Malaysia (%)
Place of birth for the foreign-born population - Philippines (%)
Place of birth for the foreign-born population - Singapore (%)
Place of birth for the foreign-born population - Thailand (%)
Place of birth for the foreign-born population - Vietnam (%)
Place of birth for the foreign-born population - Other South Eastern Asia (%)
Place of birth for the foreign-born population - Armenia (%)
Place of birth for the foreign-born population - Iraq (%)
Place of birth for the foreign-born population - Israel (%)
Place of birth for the foreign-born population - Jordan (%)
Place of birth for the foreign-born population - Kuwait (%)
Place of birth for the foreign-born population - Lebanon (%)
Place of birth for the foreign-born population - Saudi Arabia (%)
Place of birth for the foreign-born population - Syria (%)
Place of birth for the foreign-born population - Turkey (%)
Place of birth for the foreign-born population - Yemen (%)
Place of birth for the foreign-born population - Other Western Asia (%)
Place of birth for the foreign-born population - Eritrea (%)
Place of birth for the foreign-born population - Ethiopia (%)
Place of birth for the foreign-born population - Kenya (%)
Place of birth for the foreign-born population - Somalia (%)
Place of birth for the foreign-born population - Uganda (%)
Place of birth for the foreign-born population - Zimbabwe (%)
Place of birth for the foreign-born population - Other Eastern Africa (%)
Place of birth for the foreign-born population - Cameroon (%)
Place of birth for the foreign-born population - Congo (%)
Place of birth for the foreign-born population - Democratic Republic of Congo (Zaire) (%)
Place of birth for the foreign-born population - Other Middle Africa (%)
Place of birth for the foreign-born population - Egypt (%)
Place of birth for the foreign-born population - Morocco (%)
Place of birth for the foreign-born population - Sudan (%)
Place of birth for the foreign-born population - Other Northern Africa (%)
Place of birth for the foreign-born population - South Africa (%)
Place of birth for the foreign-born population - Other Southern Africa (%)
Place of birth for the foreign-born population - Cabo Verde (%)
Place of birth for the foreign-born population - Ghana (%)
Place of birth for the foreign-born population - Liberia (%)
Place of birth for the foreign-born population - Nigeria (%)
Place of birth for the foreign-born population - Senegal (%)
Place of birth for the foreign-born population - Sierra Leone (%)
Place of birth for the foreign-born population - Other Western Africa (%)
Place of birth for the foreign-born population - Australia (%)
Place of birth for the foreign-born population - New Zealand (%)
Place of birth for the foreign-born population - Fiji (%)
Place of birth for the foreign-born population - Micronesia (%)
Place of birth for the foreign-born population - Bahamas (%)
Place of birth for the foreign-born population - Barbados (%)
Place of birth for the foreign-born population - Cuba (%)
Place of birth for the foreign-born population - Dominica (%)
Place of birth for the foreign-born population - Dominican Republic (%)
Place of birth for the foreign-born population - Grenada (%)
Place of birth for the foreign-born population - Haiti (%)
Place of birth for the foreign-born population - Jamaica (%)
Place of birth for the foreign-born population - St. Vincent and the Grenadines (%)
Place of birth for the foreign-born population - Trinidad and Tobago (%)
Place of birth for the foreign-born population - West Indies (%)
Place of birth for the foreign-born population - Other Caribbean (%)
Place of birth for the foreign-born population - Belize (%)
Place of birth for the foreign-born population - Costa Rica (%)
Place of birth for the foreign-born population - El Salvador (%)
Place of birth for the foreign-born population - Guatemala (%)
Place of birth for the foreign-born population - Honduras (%)
Place of birth for the foreign-born population - Mexico (%)
Place of birth for the foreign-born population - Nicaragua (%)
Place of birth for the foreign-born population - Panama (%)
Place of birth for the foreign-born population - Other Central America (%)
Place of birth for the foreign-born population - Argentina (%)
Place of birth for the foreign-born population - Bolivia (%)
Place of birth for the foreign-born population - Brazil (%)
Place of birth for the foreign-born population - Chile (%)
Place of birth for the foreign-born population - Colombia (%)
Place of birth for the foreign-born population - Ecuador (%)
Place of birth for the foreign-born population - Guyana (%)
Place of birth for the foreign-born population - Peru (%)
Place of birth for the foreign-born population - Uruguay (%)
Place of birth for the foreign-born population - Venezuela (%)
Place of birth for the foreign-born population - Other South America (%)
Place of birth for the foreign-born population - Canada (%)
Place of birth for the foreign-born population - Other Northern America (%)
Place of birth for the foreign-born population - Other (%)
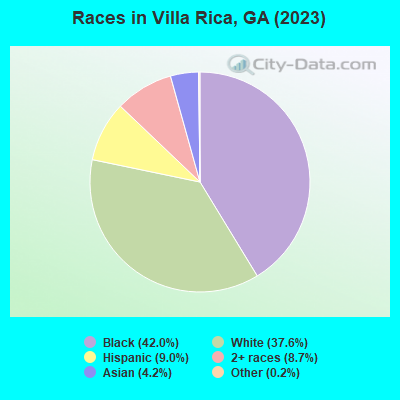
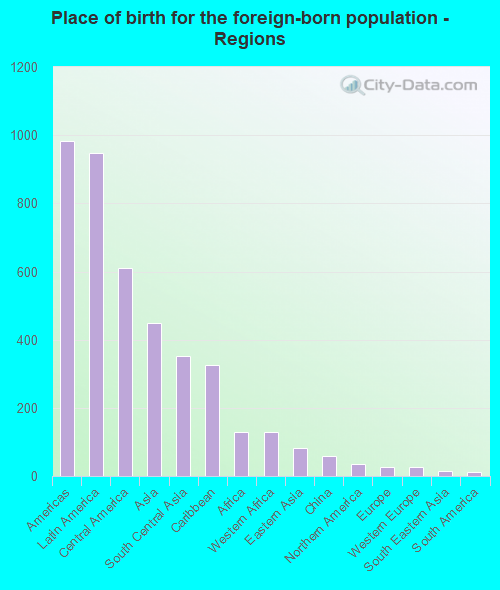
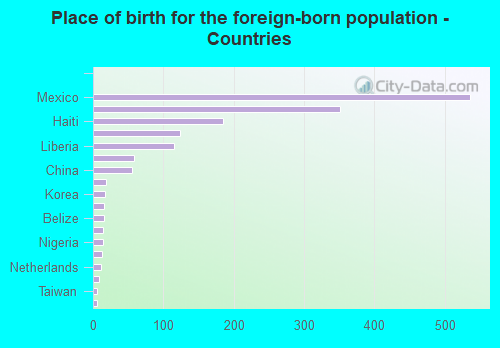
According to 2022 data, the most numerous races in Villa Rica, GA are White alone (7,132 residents), Black alone (7,630 residents), and Hispanic (1,593 residents). 89.5% of Villa Rica residents speak English at home. 8.8% of Villa Rica, GA residents are foreign-born (5.2% born in Latin America, 2.5% born in Asia), which is 13.3% less than the foreign-born rate of 10.0% across the entire state of Georgia.
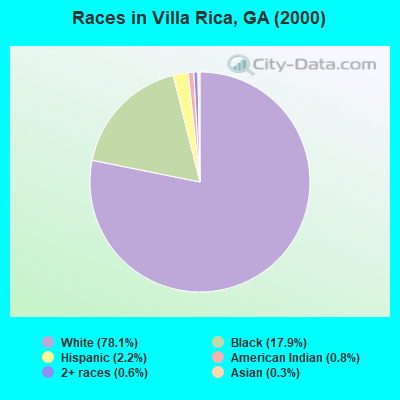
Race distribution in Villa Rica
2000 2022
5,128,661 62.6% White alone 2,331,465 28.5% Black alone 435,227 5.3% Hispanic 171,513 2.1% Asian alone 87,364 1.1% Two or more races 17,670 0.2% American Indian alone 11,275 0.1% Other race alone 3,278 0.04% Native Hawaiian and Other
5,415,657 49.6% White alone 3,349,240 30.7% Black alone 1,132,604 10.4% Hispanic 479,156 4.4% Asian alone 462,923 4.2% Two or more races 54,416 0.5% Other race alone 11,923 0.1% American Indian alone 6,957 0.06% Native Hawaiian and Other
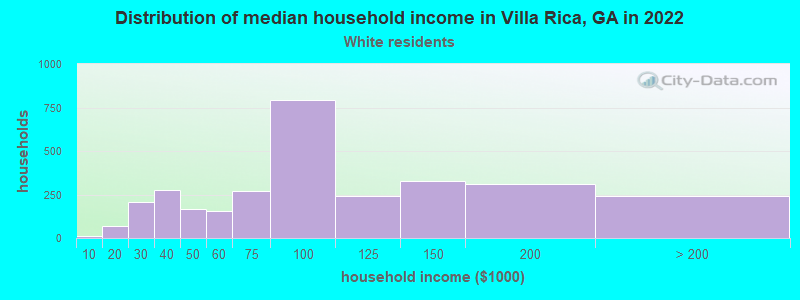
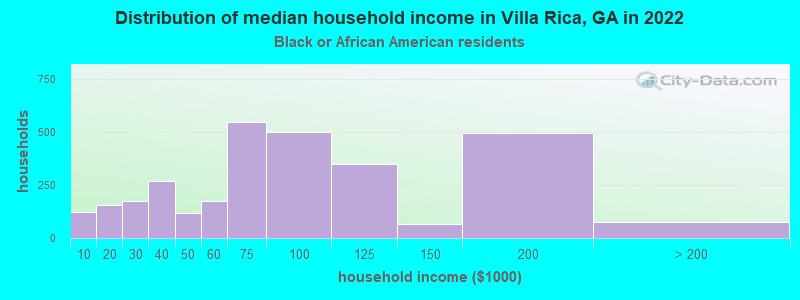
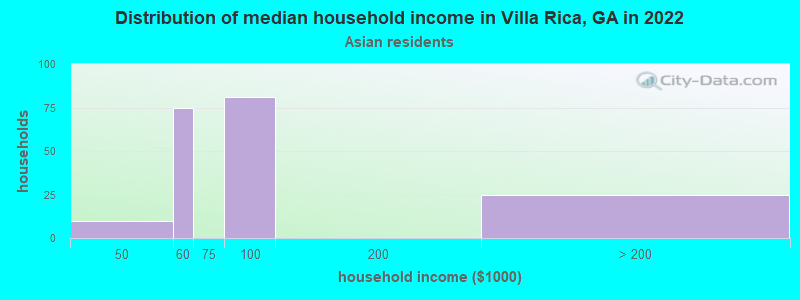
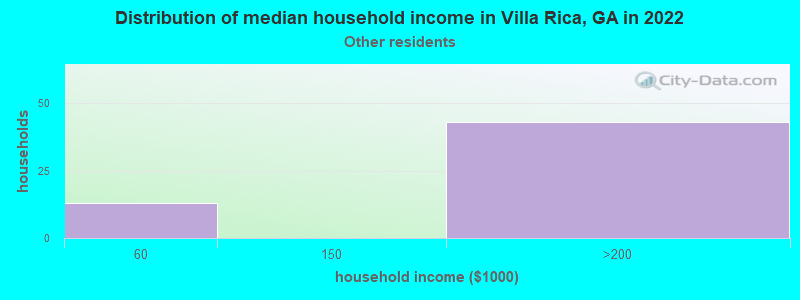
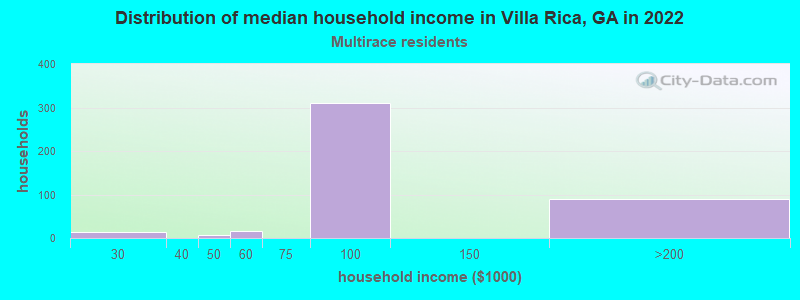
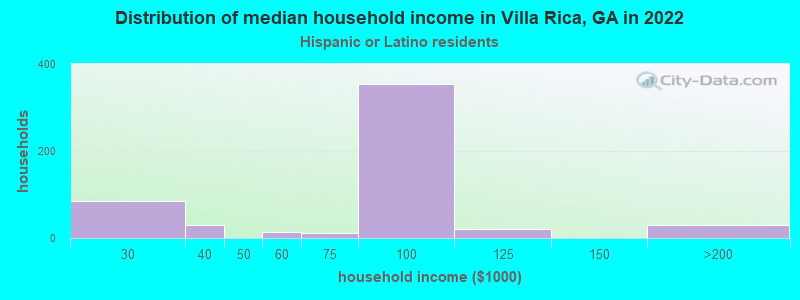
Income and house value in Villa Rica Median household income in 2022 $94,001 White non-Hispanic householders$101,802 Black householders$142,085 Asian householders$66,012 Two or more races householders$93,263 Hispanic or Latino race householdersMedian 2022 house value $293,538 White Non-Hispanic householders$274,325 Black or African American householders$231,272 Some other race householders$231,272 Hispanic or Latino householders
Median age by race in Villa Rica
36.1 Median age for White residents37.1 35.9 32.7 Median age for Black or African American residents30.3 32.3 -682,692,307.0 Median age for American Indian / Alaska Native residents-765,550,238.5 -634,581,104.5 41.1 Median age for Asian residents14.5 54.8 -666,666,666.0 Median age for Native Hawaiian / Pacific Islander residents-666,666,666.0 -666,666,666.0 28.1 Median age for Other race residents7.3 85.2 49.7 Median age for Two or more races residents48.5 19.6 37.1 Median age for White alone residents37.6 37.2 28.1 Median age for Hispanic or Latino residents24.2 24.9
Owner/renter occupied households by race in Villa Rica
House owners and renters - White residents 2,067 68.7% Owner occupied941 31.3% Renter occupiedHouse owners and renters - Black or African American residents 1,525 64.0% Owner occupied857 36.0% Renter occupiedHouse owners and renters - Asian residents 34 19.1% Owner occupied145 80.9% Renter occupiedHouse owners and renters - Other race residents 25 100.0% Owner occupiedHouse owners and renters - Two or more races residents 340 93.2% Owner occupied25 6.8% Renter occupiedHouse owners and renters - White alone residents 2,019 71.2% Owner occupied817 28.8% Renter occupiedHouse owners and renters - Hispanic or Latino residents 289 59.6% Owner occupied195 40.4% Renter occupied
Language usage in Villa Rica
English speakers - Total 89.5% of residents of Villa Rica speak English at home.
5.8% of residents speak Spanish at home 168 17.4% Speak English very well799 82.6% Speak English less than very well4.5% of residents speak other language at home 388 52.0% Speak English very well358 48.0% Speak English less than very well
English speakers - Born in the United States 96.0% of residents of Villa Rica speak English at home.
2.3% of residents speak Spanish at home 55 37.2% Speak English very well93 62.8% Speak English less than very well1.7% of residents speak other language at home 32 29.9% Speak English very well75 70.1% Speak English less than very well
English speakers - Native, born elsewhere 85.0% of residents of Villa Rica speak English at home.
15.0% of residents speak other language at home 17 100.0% Speak English very well
English speakers - Foreign-born 23.6% of residents of Villa Rica speak English at home.
39.7% of residents speak Spanish at home 66 10.5% Speak English very well565 89.5% Speak English less than very well36.4% of residents speak other language at home 321 55.5% Speak English very well257 44.5% Speak English less than very well
White (Caucasian) - Speak only English Native:
97.8% (6,959)Foreign-born:
29.3% (42)
White (Caucasian) - Speak another language Native:
2.2% (155)Foreign-born:
82.1% (117)
Black or African American - Speak only English Native:
97.0% (6,788)Foreign-born:
66.6% (329)
Black or African American - Speak another language Native:
3.0% (210)Foreign-born:
32.5% (160)
Asian - Speak only English Native:
60.7% (146)Foreign-born:
3.2% (14)
Asian - Speak another language Native:
38.0% (92)Foreign-born:
97.7% (430)
Other race - Speak another language Native:
22.6% (26)Foreign-born:
99.0% (118)
Two or more races - Speak only English Native:
98.1% (778)Foreign-born:
5.2% (25)
Two or more races - Speak another language Native:
2.5% (20)Foreign-born:
94.4% (444)
White alone - Speak only English Native:
99.8% (6,810)Foreign-born:
100.0% (45)
White alone - Speak another language Native:
0.4% (28)Foreign-born:
21.9% (10)
Hispanic or Latino - Speak another language Native:
40.9% (222)Foreign-born:
98.8% (731)
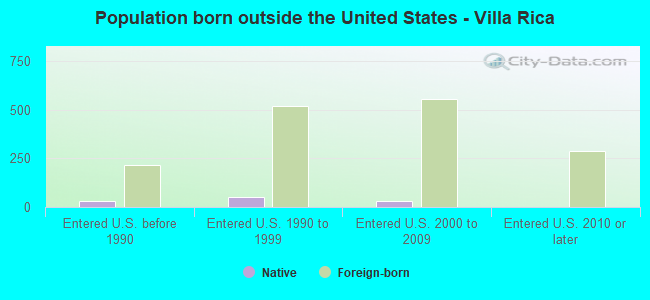
Foreign-born residents in Villa Rica 1,589 residents are foreign born (5.2% Latin America , 2.5% Asia ).
This city:
8.8%Georgia:
10.4%
Marital status for residents in Villa Rica Marital status - White (Caucasian) population 15 years and over
Males 32.6% Never married50.4% Now married0.8% Separated1.6% Widowed14.7% DivorcedFemales 26.1% Never married45.9% Now married2.8% Separated9.5% Widowed15.7% DivorcedWomen who gave birth in the past 12 months Now married:
100.0% (134)Unmarried:
0.0% (0)
Women who did not give birth in the past 12 months Now married:
40.6% (840)Unmarried:
59.4% (1,230)
Marital status - Black or African American population 15 years and over
Males 43.8% Never married38.2% Now married2.1% Separated1.2% Widowed14.7% DivorcedFemales 53.0% Never married25.8% Now married2.9% Separated6.3% Widowed12.0% DivorcedWomen who gave birth in the past 12 months Now married:
100.0% (42)Unmarried:
0.0% (0)
Women who did not give birth in the past 12 months Now married:
18.6% (392)Unmarried:
81.4% (1,712)
Marital status - Asian population 15 years and over
Males 14.0% Never married70.6% Now married2.3% Separated13.1% Widowed0.0% DivorcedFemales 19.5% Never married67.3% Now married11.2% Separated2.0% Widowed0.0% DivorcedWomen who did not give birth in the past 12 months Now married:
67.5% (106)Unmarried:
32.5% (51)
Marital status - Other race population 15 years and over
Males 0.0% Never married100.0% Now married0.0% Separated0.0% Widowed0.0% DivorcedFemales 31.7% Never married68.3% Now married0.0% Separated0.0% Widowed0.0% DivorcedWomen who did not give birth in the past 12 months Now married:
0.0% (0)Unmarried:
100.0% (26)
Marital status - Two or more races population 15 years and over
Males 12.3% Never married85.5% Now married0.0% Separated0.0% Widowed2.2% DivorcedFemales 18.5% Never married67.8% Now married0.0% Separated3.0% Widowed10.6% DivorcedWomen who did not give birth in the past 12 months Now married:
64.0% (332)Unmarried:
36.0% (186)
Marital status - White alone, not Hispanic / Latino population 15 years and over
Males 33.2% Never married49.0% Now married0.9% Separated1.6% Widowed15.3% DivorcedFemales 26.1% Never married45.4% Now married2.7% Separated9.0% Widowed16.9% DivorcedWomen who gave birth in the past 12 months Now married:
100.0% (54)Unmarried:
0.0% (0)
Women who did not give birth in the past 12 months Now married:
40.3% (792)Unmarried:
59.7% (1,173)
Marital status - Hispanic or Latino population 15 years and over
Males 10.8% Never married89.2% Now married0.0% Separated0.0% Widowed0.0% DivorcedFemales 19.9% Never married71.9% Now married2.0% Separated6.3% Widowed0.0% DivorcedWomen who gave birth in the past 12 months Now married:
100.0% (88)Unmarried:
0.0% (0)
Women who did not give birth in the past 12 months Now married:
72.4% (328)Unmarried:
27.6% (125)
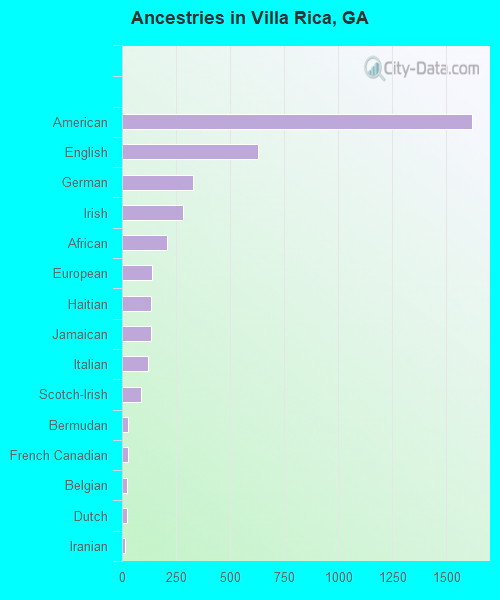
Ancestries in Villa Rica
1,617 18.0% American628 7.0% English330 3.7% German280 3.1% Irish208 2.3% African140 1.6% European135 1.5% Haitian134 1.5% Jamaican122 1.4% Italian86 1.0% Scotch-Irish28 0.3% Bermudan27 0.3% French Canadian24 0.3% Belgian24 0.3% Dutch15 0.2% Iranian14 0.2% Scandinavian12 0.1% French11 0.1% Austrian11 0.1% Slovene11 0.1% Turkish
Children Nativity (place of birth) in Villa Rica
Children under 6 years - Living with two parents Both parents native 314 100.0% NativeBoth parents foreign-born 289 100.0% NativeChildren under 6 years - Living with one parent Native parent 515 100.0% NativeForeign-born parent 19 100.0% NativeChildren 6 to 17 years - Living with two parents Both parents native 1,473 100.0% NativeBoth parents foreign-born 150 68.1% Native70 31.9% Foreign-bornOne native, one foreign-born parent 39 100.0% NativeChildren 6 to 17 years - Living with one parent Native parent 1,689 99.1% Native16 0.9% Foreign-bornForeign-born parent 188 68.5% Native86 31.5% Foreign-born
Grandparents responsible for own grandchildren in Villa Rica
Grandparents (30 to 59 years) White / Caucasian 46 100.0% Not responsible for grandchildrenBlack or African American 37 29.1% Responsible for grandchildren90 70.9% Not responsible for grandchildrenTwo or more races 241 100.0% Responsible for grandchildrenWhite alone, not Hispanic / Latino 37 100.0% Not responsible for grandchildrenGrandparents (60 years and over) White / Caucasian 37 16.6% Responsible for grandchildren186 83.4% Not responsible for grandchildrenBlack or African American 21 15.7% Responsible for grandchildren114 84.3% Not responsible for grandchildrenTwo or more races 20 100.0% Not responsible for grandchildrenWhite alone, not Hispanic / Latino 37 16.5% Responsible for grandchildren188 83.5% Not responsible for grandchildren