Races in Village St. George, Louisiana (LA) Detailed Stats
Data:
Races - White alone (%)
Races - White alone (% change since 2000)
Races - Black alone (%)
Races - Black alone (% change since 2000)
Races - American Indian alone (%)
Races - American Indian alone (% change since 2000)
Races - Asian alone (%)
Races - Asian alone (% change since 2000)
Races - Hispanic (%)
Races - Hispanic (% change since 2000)
Races - Native Hawaiian and Other Pacific Islander alone (%)
Races - Native Hawaiian and Other Pacific Islander alone (% change since 2000)
Races - Two or more races(%)
Races - Two or more races(% change since 2000)
Races - Other race alone (%)
Races - Other race alone (% change since 2000)
Racial diversity
Place of birth - Born in state of residence (%)
Place of birth - Born in state of residence (%) - White
Place of birth - Born in state of residence (%) - Black or African American
Place of birth - Born in state of residence (%) - Asian
Place of birth - Born in state of residence (%) - Hispanic or Latino
Place of birth - Born in state of residence (%) - American Indian and Alaska Native
Place of birth - Born in state of residence (%) - Multirace
Place of birth - Born in state of residence (%) - Other Race
Place of birth - Born in other state (%)
Place of birth - Born in other state (%) - White
Place of birth - Born in other state (%) - Black or African American
Place of birth - Born in other state (%) - Asian
Place of birth - Born in other state (%) - Hispanic or Latino
Place of birth - Born in other state (%) - American Indian and Alaska Native
Place of birth - Born in other state (%) - Multirace
Place of birth - Born in other state (%) - Other Race
Place of birth - Native, outside of US (%)
Place of birth - Native, outside of US (%) - White
Place of birth - Native, outside of US (%) - Black or African American
Place of birth - Native, outside of US (%) - Asian
Place of birth - Native, outside of US (%) - Hispanic or Latino
Place of birth - Native, outside of US (%) - American Indian and Alaska Native
Place of birth - Native, outside of US (%) - Multirace
Place of birth - Native, outside of US (%) - Other Race
Place of birth - Foreign born (%)
Place of birth - Foreign born (%) - White
Place of birth - Foreign born (%) - Black or African American
Place of birth - Foreign born (%) - Asian
Place of birth - Foreign born (%) - Hispanic or Latino
Place of birth - Foreign born (%) - American Indian and Alaska Native
Place of birth - Foreign born (%) - Multirace
Place of birth - Foreign born (%) - Other Race
Residents speaking English at home (%)
Residents speaking English at home - Born in the United States (%)
Residents speaking English at home - Native, born elsewhere (%)
Residents speaking English at home - Foreign born (%)
Residents speaking Spanish at home (%)
Residents speaking Spanish at home - Born in the United States (%)
Residents speaking Spanish at home - Native, born elsewhere (%)
Residents speaking Spanish at home - Foreign born (%)
Residents speaking other language at home (%)
Residents speaking other language at home - Born in the United States (%)
Residents speaking other language at home - Native, born elsewhere (%)
Residents speaking other language at home - Foreign born (%)
Marital status - Never married (%)
Marital status - Now married (%)
Marital status - Separated (%)
Marital status - Widowed (%)
Marital status - Divorced (%)
Ancestries Reported - Arab (%)
Ancestries Reported - Czech (%)
Ancestries Reported - Danish (%)
Ancestries Reported - Dutch (%)
Ancestries Reported - English (%)
Ancestries Reported - French (%)
Ancestries Reported - French Canadian (%)
Ancestries Reported - German (%)
Ancestries Reported - Greek (%)
Ancestries Reported - Hungarian (%)
Ancestries Reported - Irish (%)
Ancestries Reported - Italian (%)
Ancestries Reported - Lithuanian (%)
Ancestries Reported - Norwegian (%)
Ancestries Reported - Polish (%)
Ancestries Reported - Portuguese (%)
Ancestries Reported - Russian (%)
Ancestries Reported - Scotch-Irish (%)
Ancestries Reported - Scottish (%)
Ancestries Reported - Slovak (%)
Ancestries Reported - Subsaharan African (%)
Ancestries Reported - Swedish (%)
Ancestries Reported - Swiss (%)
Ancestries Reported - Ukrainian (%)
Ancestries Reported - United States (%)
Ancestries Reported - Welsh (%)
Ancestries Reported - West Indian (%)
Ancestries Reported - Other (%)
Geographical mobility - Same house 1 year ago (%)
Geographical mobility - Same house 1 year ago (%) - White
Geographical mobility - Same house 1 year ago (%) - Black or African American
Geographical mobility - Same house 1 year ago (%) - Asian
Geographical mobility - Same house 1 year ago (%) - Hispanic or Latino
Geographical mobility - Same house 1 year ago (%) - American Indian and Alaska Native
Geographical mobility - Same house 1 year ago (%) - Multirace
Geographical mobility - Same house 1 year ago (%) - Other Race
Geographical mobility - Moved within same county (%)
Geographical mobility - Moved within same county (%) - White
Geographical mobility - Moved within same county (%) - Black or African American
Geographical mobility - Moved within same county (%) - Asian
Geographical mobility - Moved within same county (%) - Hispanic or Latino
Geographical mobility - Moved within same county (%) - American Indian and Alaska Native
Geographical mobility - Moved within same county (%) - Multirace
Geographical mobility - Moved within same county (%) - Other Race
Geographical mobility - Moved from different county within same state (%)
Geographical mobility - Moved from different county within same state (%) - White
Geographical mobility - Moved from different county within same state (%) - Black or African American
Geographical mobility - Moved from different county within same state (%) - Asian
Geographical mobility - Moved from different county within same state (%) - Hispanic or Latino
Geographical mobility - Moved from different county within same state (%) - American Indian and Alaska Native
Geographical mobility - Moved from different county within same state (%) - Multirace
Geographical mobility - Moved from different county within same state (%) - Other Race
Geographical mobility - Moved from different state (%)
Geographical mobility - Moved from different state (%) - White
Geographical mobility - Moved from different state (%) - Black or African American
Geographical mobility - Moved from different state (%) - Asian
Geographical mobility - Moved from different state (%) - Hispanic or Latino
Geographical mobility - Moved from different state (%) - American Indian and Alaska Native
Geographical mobility - Moved from different state (%) - Multirace
Geographical mobility - Moved from different state (%) - Other Race
Geographical mobility - Moved from abroad (%)
Geographical mobility - Moved from abroad (%) - White
Geographical mobility - Moved from abroad (%) - Black or African American
Geographical mobility - Moved from abroad (%) - Asian
Geographical mobility - Moved from abroad (%) - Hispanic or Latino
Geographical mobility - Moved from abroad (%) - American Indian and Alaska Native
Geographical mobility - Moved from abroad (%) - Multirace
Geographical mobility - Moved from abroad (%) - Other Race
Place of birth for the foreign-born population - Ireland (%)
Place of birth for the foreign-born population - Denmark (%)
Place of birth for the foreign-born population - Norway (%)
Place of birth for the foreign-born population - Sweden (%)
Place of birth for the foreign-born population - United Kingdom (%)
Place of birth for the foreign-born population - England (%)
Place of birth for the foreign-born population - Scotland (%)
Place of birth for the foreign-born population - Other Northern Europe (%)
Place of birth for the foreign-born population - Austria (%)
Place of birth for the foreign-born population - Belgium (%)
Place of birth for the foreign-born population - France (%)
Place of birth for the foreign-born population - Germany (%)
Place of birth for the foreign-born population - Netherlands (%)
Place of birth for the foreign-born population - Switzerland (%)
Place of birth for the foreign-born population - Other Western Europe (%)
Place of birth for the foreign-born population - Greece (%)
Place of birth for the foreign-born population - Italy (%)
Place of birth for the foreign-born population - Portugal (%)
Place of birth for the foreign-born population - Spain (%)
Place of birth for the foreign-born population - Other Southern Europe (%)
Place of birth for the foreign-born population - Albania (%)
Place of birth for the foreign-born population - Belarus (%)
Place of birth for the foreign-born population - Bosnia and Herzegovina (%)
Place of birth for the foreign-born population - Bulgaria (%)
Place of birth for the foreign-born population - Croatia (%)
Place of birth for the foreign-born population - Czechoslovakia (%)
Place of birth for the foreign-born population - Hungary (%)
Place of birth for the foreign-born population - Latvia (%)
Place of birth for the foreign-born population - Lithuania (%)
Place of birth for the foreign-born population - North Macedonia (Macedonia) (%)
Place of birth for the foreign-born population - Moldova (%)
Place of birth for the foreign-born population - Poland (%)
Place of birth for the foreign-born population - Romania (%)
Place of birth for the foreign-born population - Russia (%)
Place of birth for the foreign-born population - Serbia (%)
Place of birth for the foreign-born population - Ukraine (%)
Place of birth for the foreign-born population - Other Eastern Europe (%)
Place of birth for the foreign-born population - China (%)
Place of birth for the foreign-born population - Hong Kong (%)
Place of birth for the foreign-born population - Taiwan (%)
Place of birth for the foreign-born population - Japan (%)
Place of birth for the foreign-born population - Korea (%)
Place of birth for the foreign-born population - Other Eastern Asia (%)
Place of birth for the foreign-born population - Afghanistan (%)
Place of birth for the foreign-born population - Bangladesh (%)
Place of birth for the foreign-born population - India (%)
Place of birth for the foreign-born population - Iran (%)
Place of birth for the foreign-born population - Kazakhstan (%)
Place of birth for the foreign-born population - Nepal (%)
Place of birth for the foreign-born population - Pakistan (%)
Place of birth for the foreign-born population - Sri Lanka (%)
Place of birth for the foreign-born population - Uzbekistan (%)
Place of birth for the foreign-born population - Other South Central Asia (%)
Place of birth for the foreign-born population - Burma (%)
Place of birth for the foreign-born population - Cambodia (%)
Place of birth for the foreign-born population - Indonesia (%)
Place of birth for the foreign-born population - Laos (%)
Place of birth for the foreign-born population - Malaysia (%)
Place of birth for the foreign-born population - Philippines (%)
Place of birth for the foreign-born population - Singapore (%)
Place of birth for the foreign-born population - Thailand (%)
Place of birth for the foreign-born population - Vietnam (%)
Place of birth for the foreign-born population - Other South Eastern Asia (%)
Place of birth for the foreign-born population - Armenia (%)
Place of birth for the foreign-born population - Iraq (%)
Place of birth for the foreign-born population - Israel (%)
Place of birth for the foreign-born population - Jordan (%)
Place of birth for the foreign-born population - Kuwait (%)
Place of birth for the foreign-born population - Lebanon (%)
Place of birth for the foreign-born population - Saudi Arabia (%)
Place of birth for the foreign-born population - Syria (%)
Place of birth for the foreign-born population - Turkey (%)
Place of birth for the foreign-born population - Yemen (%)
Place of birth for the foreign-born population - Other Western Asia (%)
Place of birth for the foreign-born population - Eritrea (%)
Place of birth for the foreign-born population - Ethiopia (%)
Place of birth for the foreign-born population - Kenya (%)
Place of birth for the foreign-born population - Somalia (%)
Place of birth for the foreign-born population - Uganda (%)
Place of birth for the foreign-born population - Zimbabwe (%)
Place of birth for the foreign-born population - Other Eastern Africa (%)
Place of birth for the foreign-born population - Cameroon (%)
Place of birth for the foreign-born population - Congo (%)
Place of birth for the foreign-born population - Democratic Republic of Congo (Zaire) (%)
Place of birth for the foreign-born population - Other Middle Africa (%)
Place of birth for the foreign-born population - Egypt (%)
Place of birth for the foreign-born population - Morocco (%)
Place of birth for the foreign-born population - Sudan (%)
Place of birth for the foreign-born population - Other Northern Africa (%)
Place of birth for the foreign-born population - South Africa (%)
Place of birth for the foreign-born population - Other Southern Africa (%)
Place of birth for the foreign-born population - Cabo Verde (%)
Place of birth for the foreign-born population - Ghana (%)
Place of birth for the foreign-born population - Liberia (%)
Place of birth for the foreign-born population - Nigeria (%)
Place of birth for the foreign-born population - Senegal (%)
Place of birth for the foreign-born population - Sierra Leone (%)
Place of birth for the foreign-born population - Other Western Africa (%)
Place of birth for the foreign-born population - Australia (%)
Place of birth for the foreign-born population - New Zealand (%)
Place of birth for the foreign-born population - Fiji (%)
Place of birth for the foreign-born population - Micronesia (%)
Place of birth for the foreign-born population - Bahamas (%)
Place of birth for the foreign-born population - Barbados (%)
Place of birth for the foreign-born population - Cuba (%)
Place of birth for the foreign-born population - Dominica (%)
Place of birth for the foreign-born population - Dominican Republic (%)
Place of birth for the foreign-born population - Grenada (%)
Place of birth for the foreign-born population - Haiti (%)
Place of birth for the foreign-born population - Jamaica (%)
Place of birth for the foreign-born population - St. Vincent and the Grenadines (%)
Place of birth for the foreign-born population - Trinidad and Tobago (%)
Place of birth for the foreign-born population - West Indies (%)
Place of birth for the foreign-born population - Other Caribbean (%)
Place of birth for the foreign-born population - Belize (%)
Place of birth for the foreign-born population - Costa Rica (%)
Place of birth for the foreign-born population - El Salvador (%)
Place of birth for the foreign-born population - Guatemala (%)
Place of birth for the foreign-born population - Honduras (%)
Place of birth for the foreign-born population - Mexico (%)
Place of birth for the foreign-born population - Nicaragua (%)
Place of birth for the foreign-born population - Panama (%)
Place of birth for the foreign-born population - Other Central America (%)
Place of birth for the foreign-born population - Argentina (%)
Place of birth for the foreign-born population - Bolivia (%)
Place of birth for the foreign-born population - Brazil (%)
Place of birth for the foreign-born population - Chile (%)
Place of birth for the foreign-born population - Colombia (%)
Place of birth for the foreign-born population - Ecuador (%)
Place of birth for the foreign-born population - Guyana (%)
Place of birth for the foreign-born population - Peru (%)
Place of birth for the foreign-born population - Uruguay (%)
Place of birth for the foreign-born population - Venezuela (%)
Place of birth for the foreign-born population - Other South America (%)
Place of birth for the foreign-born population - Canada (%)
Place of birth for the foreign-born population - Other Northern America (%)
Place of birth for the foreign-born population - Other (%)
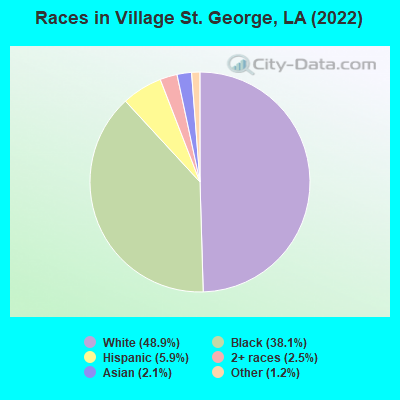
According to 2022 data, the most numerous races in Village St. George, LA are White alone (4,322 residents), Black alone (3,371 residents), and Hispanic (519 residents). 90.6% of Village St. George residents speak English at home. 7.5% of Village St. George, LA residents are foreign-born (3.1% born in Latin America, 1.9% born in Asia, 1.8% born in Africa), which is 46.8% greater than the foreign-born rate of 4.0% across the entire state of Louisiana.
Race distribution in Village St. George
2000 2022
2,794,391 62.5% White alone 1,443,390 32.3% Black alone 107,738 2.4% Hispanic 54,256 1.2% Asian alone 39,260 0.9% Two or more races 24,129 0.5% American Indian alone 4,736 0.1% Other race alone 1,076 0.02% Native Hawaiian and Other
2,603,221 56.7% White alone 1,420,055 30.9% Black alone 262,213 5.7% Hispanic 183,270 4.0% Two or more races 81,169 1.8% Asian alone 19,991 0.4% American Indian alone 18,043 0.4% Other race alone 2,279 0.05% Native Hawaiian and Other
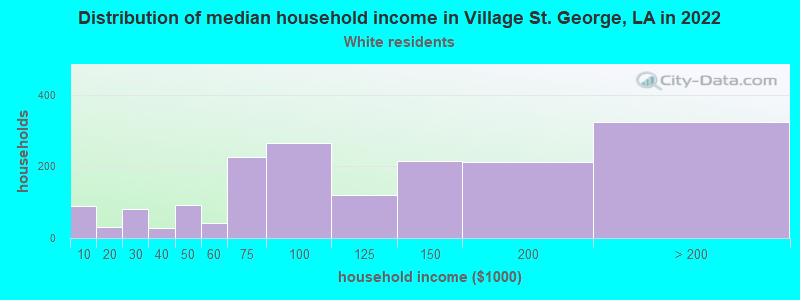
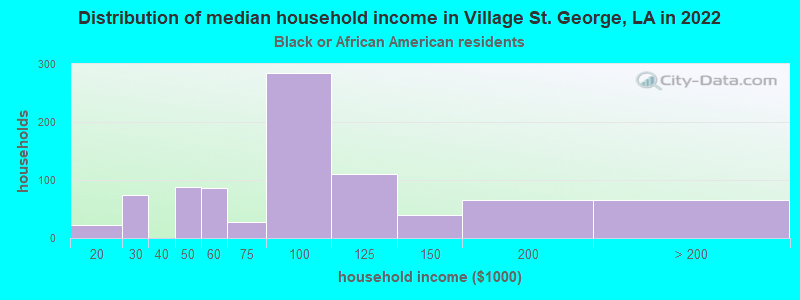
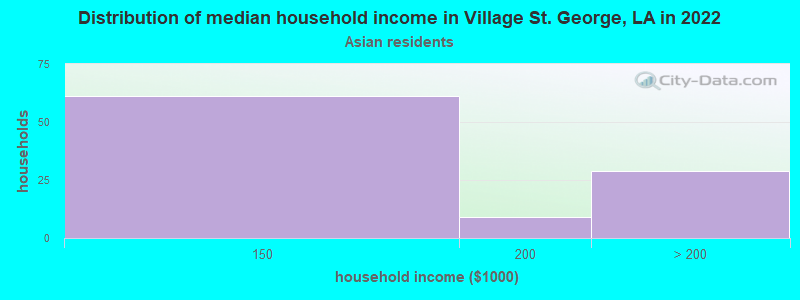
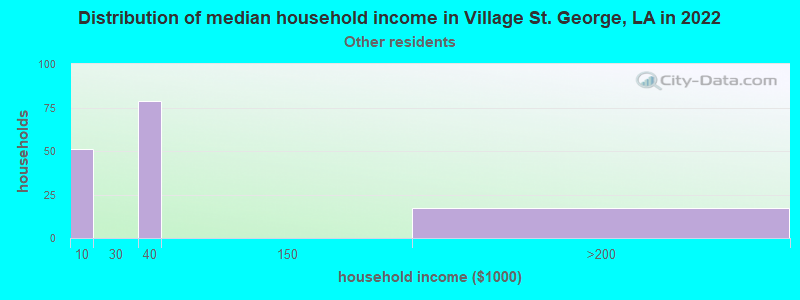
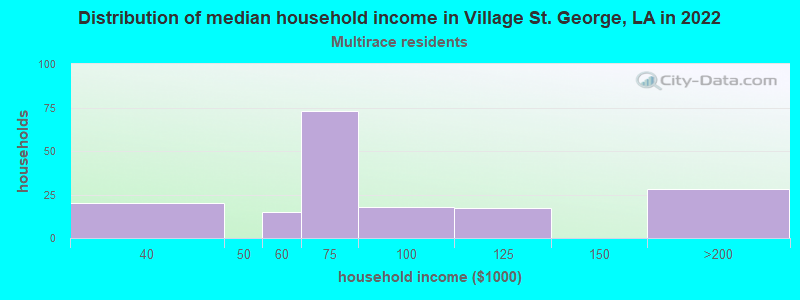
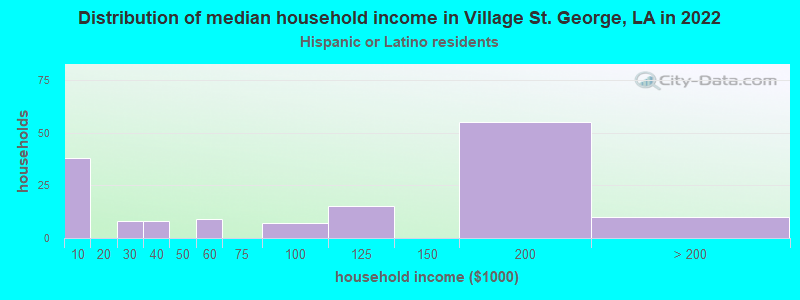
Income and house value in Village St. George Median household income in 2022 $119,054 White non-Hispanic householders$82,492 Black householders$172,013 Asian householders$80,534 Two or more races householdersMedian 2022 house value $267,525 White Non-Hispanic householders$196,218 Black or African American householders$110,649 American Indian or Alaska Native householders $522,510 Asian householders$233,593 Two or more races householders$218,347 Hispanic or Latino householders
Median age by race in Village St. George
41.4 Median age for White residents45.2 41.0 29.1 Median age for Black or African American residents28.8 35.3 -736,637,511.4 Median age for American Indian / Alaska Native residents-666,666,666.0 -1,445,312,498.6 53.2 Median age for Asian residents56.9 47.6 -666,666,666.0 Median age for Native Hawaiian / Pacific Islander residents-666,666,666.0 -666,666,666.0 63.3 Median age for Other race residents-758,226,036.4 53.2 23.6 Median age for Two or more races residents14.9 27.4 41.3 Median age for White alone residents45.3 40.5 28.4 Median age for Hispanic or Latino residents19.7 31.8
Owner/renter occupied households by race in Village St. George
House owners and renters - White residents 1,449 83.6% Owner occupied285 16.4% Renter occupiedHouse owners and renters - Black or African American residents 617 67.2% Owner occupied301 32.8% Renter occupiedHouse owners and renters - Asian residents 96 100.0% Owner occupiedHouse owners and renters - Other race residents 14 9.4% Owner occupied132 90.6% Renter occupiedHouse owners and renters - Two or more races residents 49 46.7% Owner occupied56 53.3% Renter occupiedHouse owners and renters - White alone residents 1,423 83.5% Owner occupied282 16.5% Renter occupiedHouse owners and renters - Hispanic or Latino residents 101 60.1% Owner occupied67 39.9% Renter occupied
Language usage in Village St. George
English speakers - Total 90.6% of residents of Village St. George speak English at home.
4.2% of residents speak Spanish at home 169 47.9% Speak English very well184 52.1% Speak English less than very well5.0% of residents speak other language at home 274 65.1% Speak English very well147 34.9% Speak English less than very well
English speakers - Born in the United States 98.0% of residents of Village St. George speak English at home.
1.7% of residents speak Spanish at home 30 100.0% Speak English very well0.4% of residents speak other language at home 8 100.0% Speak English very well
English speakers - Native, born elsewhere 34.9% of residents of Village St. George speak English at home.
75.9% of residents speak Spanish at home 63 100.0% Speak English very well
English speakers - Foreign-born 25.5% of residents of Village St. George speak English at home.
4.7% of residents speak Spanish at home 20 60.6% Speak English very well13 39.4% Speak English less than very well59.4% of residents speak other language at home 268 64.7% Speak English very well146 35.3% Speak English less than very well
White (Caucasian) - Speak only English Native:
98.1% (4,053)Foreign-born:
26.9% (25)
White (Caucasian) - Speak another language Native:
1.9% (79)Foreign-born:
71.8% (67)
Black or African American - Speak another language Native:
3.6% (109)Foreign-born:
100.0% (195)
Asian - Speak only English Native:
60.0% (21)Foreign-born:
8.0% (12)
Asian - Speak another language Native:
40.1% (14)Foreign-born:
93.0% (137)
Other race - Speak another language Native:
83.8% (51)Foreign-born:
9.8% (29)
Two or more races - Speak another language Native:
17.7% (90)Foreign-born:
100.0% (12)
White alone - Speak only English Native:
98.6% (4,008)Foreign-born:
15.2% (14)
White alone - Speak another language Native:
1.4% (55)Foreign-born:
89.6% (85)
Hispanic or Latino - Speak only English Native:
65.4% (283)Foreign-born:
35.9% (21)
Hispanic or Latino - Speak another language Native:
32.7% (141)Foreign-born:
62.9% (37)
Foreign-born residents in Village St. George 665 residents are foreign born (3.1% Latin America , 1.9% Asia , 1.8% Africa ).
This city:
7.5%Louisiana:
4.2%
Marital status for residents in Village St. George Marital status - White (Caucasian) population 15 years and over
Males 26.4% Never married60.0% Now married0.6% Separated3.3% Widowed9.7% DivorcedFemales 31.8% Never married47.8% Now married0.2% Separated6.9% Widowed13.3% DivorcedWomen who gave birth in the past 12 months Now married:
100.0% (98)Unmarried:
0.0% (0)
Women who did not give birth in the past 12 months Now married:
34.2% (357)Unmarried:
65.8% (687)
Marital status - Black or African American population 15 years and over
Males 47.6% Never married48.5% Now married0.0% Separated0.0% Widowed3.9% DivorcedFemales 52.7% Never married30.5% Now married7.8% Separated3.2% Widowed5.9% DivorcedWomen who gave birth in the past 12 months Now married:
78.9% (56)Unmarried:
21.1% (15)
Women who did not give birth in the past 12 months Now married:
28.3% (253)Unmarried:
71.7% (640)
Marital status - Asian population 15 years and over
Males 30.5% Never married69.5% Now married0.0% Separated0.0% Widowed0.0% DivorcedFemales 0.0% Never married100.0% Now married0.0% Separated0.0% Widowed0.0% DivorcedWomen who did not give birth in the past 12 months Now married:
100.0% (47)Unmarried:
0.0% (0)
Marital status - Other race population 15 years and over
Males 0.0% Never married100.0% Now married0.0% Separated0.0% Widowed0.0% DivorcedFemales 0.0% Never married26.3% Now married0.0% Separated28.8% Widowed45.0% DivorcedWomen who did not give birth in the past 12 months Now married:
100.0% (36)Unmarried:
0.0% (0)
Marital status - Two or more races population 15 years and over
Males 52.0% Never married31.6% Now married9.6% Separated0.0% Widowed6.8% DivorcedFemales 68.9% Never married20.4% Now married0.0% Separated6.8% Widowed3.9% DivorcedWomen who did not give birth in the past 12 months Now married:
5.3% (6)Unmarried:
94.7% (99)
Marital status - White alone, not Hispanic / Latino population 15 years and over
Males 26.7% Never married59.6% Now married0.6% Separated3.4% Widowed9.8% DivorcedFemales 31.4% Never married48.0% Now married0.2% Separated6.7% Widowed13.6% DivorcedWomen who gave birth in the past 12 months Now married:
100.0% (99)Unmarried:
0.0% (0)
Women who did not give birth in the past 12 months Now married:
35.0% (362)Unmarried:
65.0% (671)
Marital status - Hispanic or Latino population 15 years and over
Males 24.0% Never married57.1% Now married11.0% Separated0.0% Widowed7.8% DivorcedFemales 30.1% Never married59.5% Now married0.0% Separated8.1% Widowed2.3% DivorcedWomen who did not give birth in the past 12 months Now married:
37.3% (32)Unmarried:
62.7% (54)
Ancestries in Village St. George
1,305 22.2% American557 9.5% English457 7.8% Scandinavian240 4.1% Irish223 3.8% French106 1.8% Italian97 1.7% Guyanese62 1.1% European56 1.0% Scottish30 0.5% Haitian29 0.5% German26 0.4% Polish23 0.4% Scotch-Irish21 0.4% Russian20 0.3% Norwegian19 0.3% Lebanese19 0.3% Iranian19 0.3% Ukrainian15 0.3% British14 0.2% Welsh13 0.2% French Canadian11 0.2% Portuguese9 0.2% Swedish7 0.1% Eastern European7 0.1% African5 0.09% Belgian4 0.07% Cajun
Children Nativity (place of birth) in Village St. George
Children under 6 years - Living with two parents Both parents native 370 100.0% NativeOne native, one foreign-born parent 51 100.0% NativeChildren under 6 years - Living with one parent Native parent 12 100.0% NativeChildren 6 to 17 years - Living with two parents Both parents native 921 98.0% Native19 2.0% Foreign-bornBoth parents foreign-born 37 100.0% NativeOne native, one foreign-born parent 83 100.0% NativeChildren 6 to 17 years - Living with one parent Native parent 316 100.0% NativeForeign-born parent 36 48.1% Native39 51.9% Foreign-born
Grandparents responsible for own grandchildren in Village St. George
Grandparents (30 to 59 years) Black or African American 8 100.0% Responsible for grandchildren
Grandparents (60 years and over) Black or African American 95 100.0% Not responsible for grandchildren