Races in Vinalhaven, Maine (ME) Detailed Stats
Ancestries, Foreign-born residents, place of birth

Recent posts about races in Vinalhaven, Maine on our local forum with over 2,400,000 registered users:
 | Armed vigilantes trap workmen with out of state plates in house by felling tree (7 replies) |
1.5% of Vinalhaven, ME residents are foreign-born , which is 95.0% less than the foreign-born rate of 3.0% across the entire state of Maine.
Race distribution in Vinalhaven

- 1,21298.1%White alone
- 151.2%Two or more races
- 40.3%Asian alone
- 40.3%American Indian alone

2000
2022
-
- 1,230,29796.5%White alone
- 11,7310.9%Two or more races
- 9,3600.7%Hispanic
- 9,0140.7%Asian alone
- 6,4400.5%Black alone
- 6,9110.5%American Indian alone
- 8360.07%Other race alone
- 3340.03%Native Hawaiian and Other
Pacific Islander alone

-
- 1,249,23390.2%White alone
- 58,3574.2%Two or more races
- 28,7172.1%Hispanic
- 21,5831.6%Black alone
- 16,1511.2%Asian alone
- 5,8730.4%Other race alone
- 5,2050.4%American Indian alone
- 2210.02%Native Hawaiian and Other
Pacific Islander alone

Income and house value in Vinalhaven
- Median household income in 2022
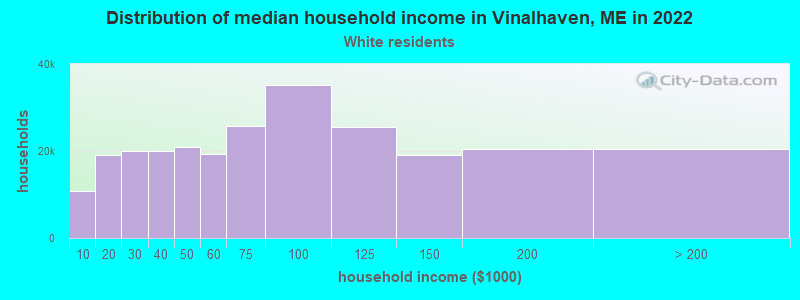
- $64,101White non-Hispanic householders
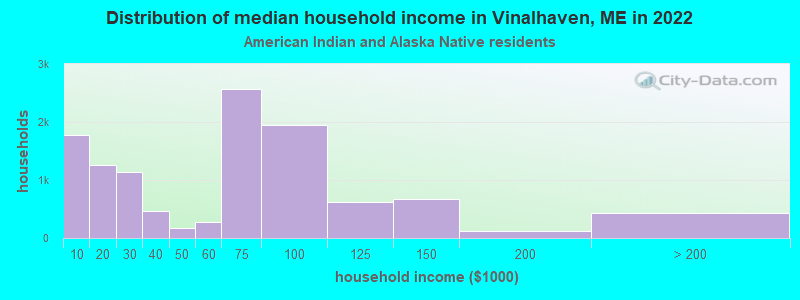
- $199,551American Indian and Alaska Native householders
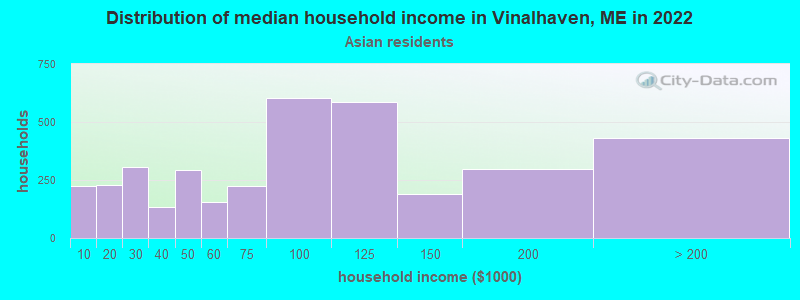
- $47,536Asian householders
- Median 2022 house value
- $326,730White Non-Hispanic householders
- $316,055American Indian or Alaska Native householders
- $182,609Asian householders
Household income for White non-Hispanic householders
Household income for American Indian and Alaska Native householders
Household income for Asian householders
Foreign-born residents in Vinalhaven
19 residents are foreign born
| This city: | 1.5% |
| Maine: | 2.9% |
Ancestries in Vinalhaven

- 36331.2%English
- 14412.4%Irish
- 12811.0%Other
- 1008.6%French
- 887.6%Scottish
- 796.8%Swedish
- 544.6%United States
- 514.4%German
- 403.4%Scotch-Irish
- 393.4%Italian
- 191.6%Norwegian
- 161.4%Portuguese
- 131.1%Welsh
- 100.9%Dutch
- 80.7%French Canadian
- 60.5%Polish
- 40.3%Russian
- 20.2%Danish

Zip codes: 04863.