Races in Vincennes, Indiana (IN) Detailed Stats
Ancestries, Foreign-born residents, place of birth
Settings
X


Recent posts about races in Vincennes, Indiana on our local forum with over 2,400,000 registered users:
 | Does everyone in Indiana drive everywhere? (19 replies) |
| Real Estate question - Vincennes (2 replies) |
| rum village, in south bend (21 replies) |
| Vincennes (19 replies) |
| What's Vincennes like? (23 replies) |
| Parking an RV in Daviess or Knox County (3 replies) |
Latest news about races in Vincennes, IN collected exclusively by city-data.com from local newspapers, TV, and radio stations
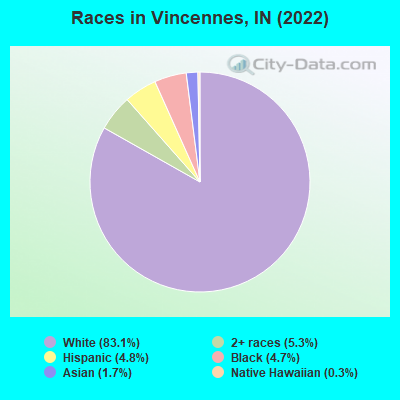
According to 2022 data, the most numerous races in Vincennes, IN are White alone (13,995 residents), Black alone (785 residents), and Hispanic (814 residents). 91.7% of Vincennes residents speak English at home. 4.0% of Vincennes, IN residents are foreign-born (2.0% born in Latin America, 1.2% born in Asia, 0.4% born in Africa), which is 49.9% less than the foreign-born rate of 6.0% across the entire state of Indiana.
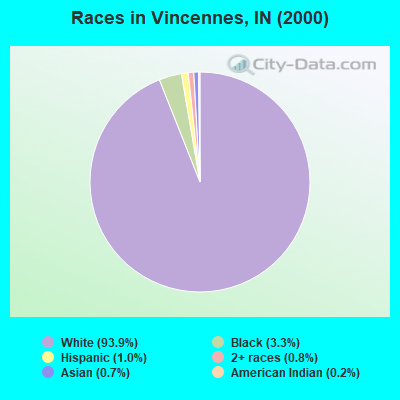
Race distribution in Vincennes
2000
2022

- 17,56493.9%White alone
- 6123.3%Black alone
- 1911.0%Hispanic
- 1410.8%Two or more races
- 1340.7%Asian alone
- 430.2%American Indian alone
- 100.05%Native Hawaiian and Other
Pacific Islander alone - 60.03%Other race alone
-
- 13,99583.1%White alone
- 8945.3%Two or more races
- 8144.8%Hispanic
- 7854.7%Black alone
- 2891.7%Asian alone
- 460.3%Native Hawaiian and Other
Pacific Islander alone - 110.07%American Indian alone
2000
2022
-
- 5,219,37385.8%White alone
- 505,4628.3%Black alone
- 214,5363.5%Hispanic
- 61,1151.0%Two or more races
- 58,4241.0%Asian alone
- 13,6540.2%American Indian alone
- 6,3480.1%Other race alone
- 1,5730.03%Native Hawaiian and Other
Pacific Islander alone

-
- 5,192,45576.0%White alone
- 628,0549.2%Black alone
- 534,5287.8%Hispanic
- 263,2423.9%Two or more races
- 172,8802.5%Asian alone
- 33,4670.5%Other race alone
- 5,8660.09%American Indian alone
- 2,5450.04%Native Hawaiian and Other
Pacific Islander alone

Income and house value in Vincennes
- Median household income in 2022
- $46,687White non-Hispanic householders
- $55,306Black householders
- $58,252Two or more races householders
- Median 2022 house value
- $107,040White Non-Hispanic householders
- $95,262Black or African American householders
- $147,223Asian householders
- $147,223Some other race householders
- $164,543Two or more races householders
- $147,223Hispanic or Latino householders
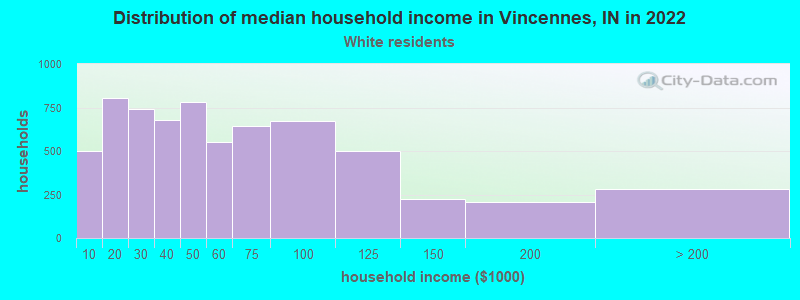
Household income for White non-Hispanic householders
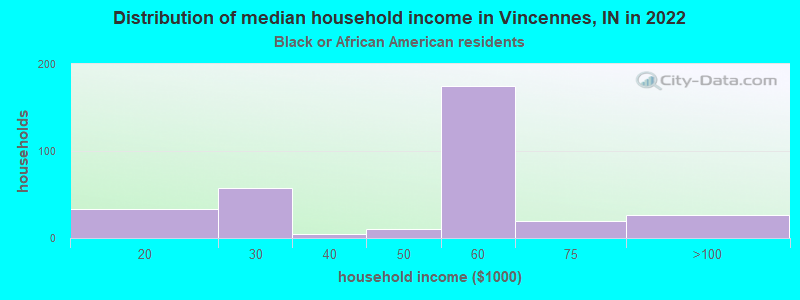
Household income for Black householders
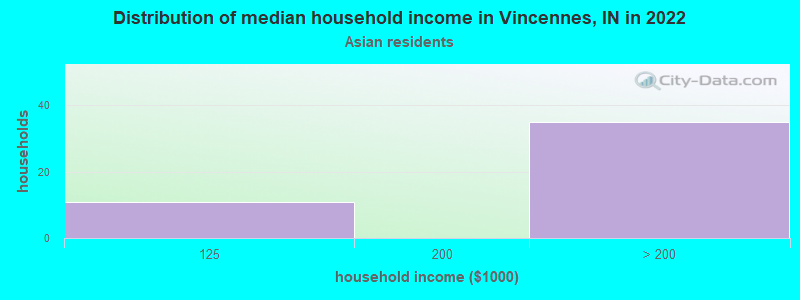
Household income for Asian householders
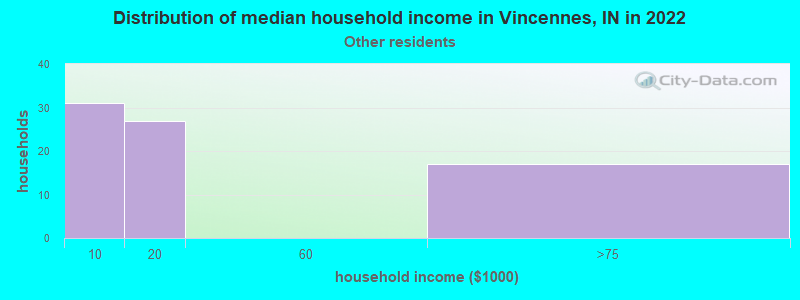
Household income for Some other race householders
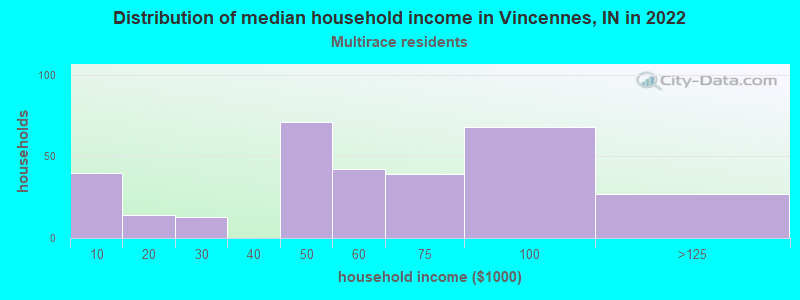
Household income for Two or more races householders
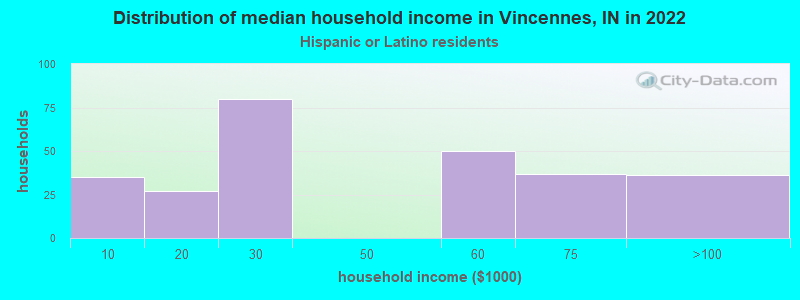
Household income for Hispanic or Latino race householders
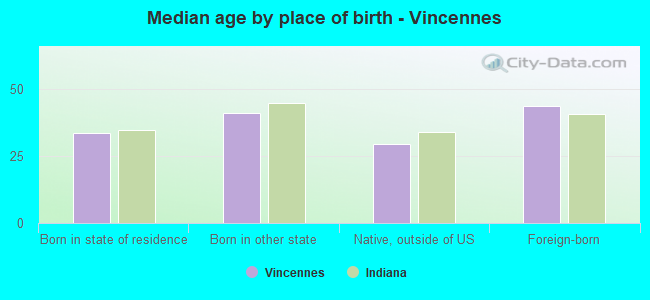
Median age by race in Vincennes
- 39.5Median age for White residents
- 36.5Males
- 42.1Females
- 36.9Median age for Black or African American residents
- 35.7Males
- 41.2Females
- -558,797,523.8Median age for American Indian / Alaska Native residents
- -654,255,318.5Males
- -491,600,353.2Females
- 23.3Median age for Asian residents
- 40.5Males
- 22.3Females
- -664,335,663.7Median age for Native Hawaiian / Pacific Islander residents
- -644,025,156.6Males
- -664,437,011.6Females
- 13.6Median age for Other race residents
- 14.2Males
- 9.6Females
- 24.8Median age for Two or more races residents
- 20.5Males
- 30.2Females
- 39.1Median age for White alone residents
- 35.7Males
- 43.3Females
- 22.3Median age for Hispanic or Latino residents
- 22.5Males
- 18.9Females
Owner/renter occupied households by race in Vincennes
- House owners and renters - White residents
- 3,28650.7%Owner occupied
- 3,19149.3%Renter occupied
- House owners and renters - Black or African American residents
- 3710.7%Owner occupied
- 30889.3%Renter occupied
- House owners and renters - Asian residents
- 44100.0%Owner occupied
- House owners and renters - Other race residents
- 81100.0%Renter occupied
- House owners and renters - Two or more races residents
- 8127.6%Owner occupied
- 21372.4%Renter occupied
- House owners and renters - White alone residents
- 3,23350.2%Owner occupied
- 3,20649.8%Renter occupied
- House owners and renters - Hispanic or Latino residents
- 8331.0%Owner occupied
- 18669.0%Renter occupied
Language usage in Vincennes
- English speakers - Total
- 91.7% of residents of Vincennes speak English at home.
- 3.6% of residents speak Spanish at home
- 27647.4%Speak English very well
- 30652.6%Speak English less than very well
- 4.5% of residents speak other language at home
- 17824.5%Speak English very well
- 54875.5%Speak English less than very well
- English speakers - Born in the United States
- 92.3% of residents of Vincennes speak English at home.
- 7.4% of residents speak Spanish at home
- 22273.8%Speak English very well
- 7926.2%Speak English less than very well
- 0.2% of residents speak other language at home
- 9100.0%Speak English less than very well
- English speakers - Native, born elsewhere
- 41.7% of residents of Vincennes speak English at home.
- 57.1% of residents speak Spanish at home
- 96100.0%Speak English less than very well
- English speakers - Foreign-born
- 3.7% of residents of Vincennes speak English at home.
- 13.5% of residents speak Spanish at home
- 91100.0%Speak English less than very well
- 85.7% of residents speak other language at home
- 396.7%Speak English very well
- 54093.3%Speak English less than very well
White (Caucasian) - Speak only English
| Native: | 98.6% (13,225) |
| Foreign-born: | 38.9% (21) |
White (Caucasian) - Speak another language
| Native: | 1.5% (197) |
| Foreign-born: | 62.0% (33) |
Asian - Speak another language
| Native: | 100.0% (102) |
| Foreign-born: | 99.7% (188) |
Other race - Speak another language
| Native: | 69.6% (171) |
| Foreign-born: | 97.7% (41) |
White alone - Speak only English
| Native: | 99.3% (13,153) |
| Foreign-born: | 79.8% (23) |
White alone - Speak another language
| Native: | 0.6% (75) |
| Foreign-born: | 15.0% (4) |
Hispanic or Latino - Speak another language
| Native: | 70.3% (450) |
| Foreign-born: | 99.5% (86) |
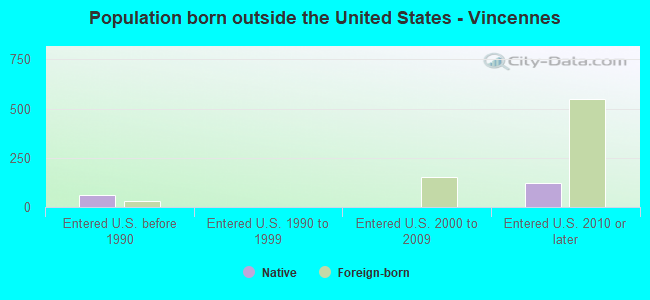
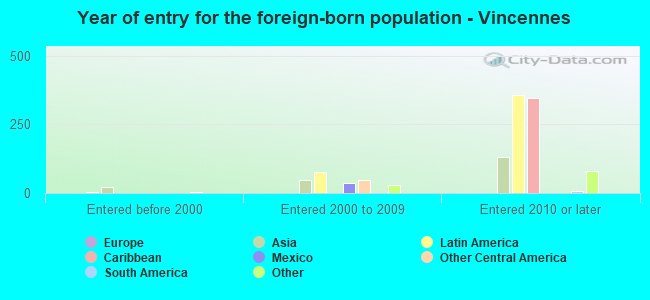
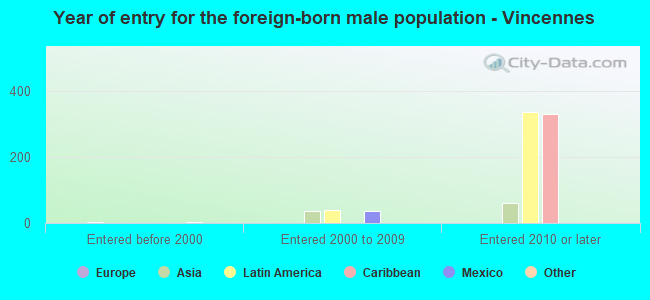
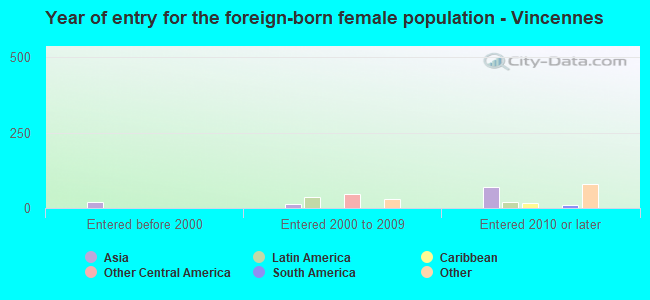
Foreign-born residents in Vincennes
674 residents are foreign born (2.0% Latin America, 1.2% Asia, 0.4% Africa).
| This city: | 4.0% |
| Indiana: | 5.6% |
Marital status for residents in Vincennes
Marital status - White (Caucasian) population 15 years and over
- Males
- 42.9%Never married
- 44.8%Now married
- 0.1%Separated
- 2.6%Widowed
- 9.6%Divorced
- Females
- 29.4%Never married
- 41.5%Now married
- 1.5%Separated
- 12.9%Widowed
- 14.6%Divorced
Women who gave birth in the past 12 months
| Now married: | 59.1% (88) |
| Unmarried: | 40.9% (61) |
Women who did not give birth in the past 12 months
| Now married: | 41.2% (1,336) |
| Unmarried: | 58.8% (1,903) |
Marital status - Black or African American population 15 years and over
- Males
- 43.8%Never married
- 54.5%Now married
- 0.0%Separated
- 0.0%Widowed
- 1.7%Divorced
- Females
- 57.2%Never married
- 39.4%Now married
- 0.0%Separated
- 3.4%Widowed
- 0.0%Divorced
Women who did not give birth in the past 12 months
| Now married: | 25.5% (38) |
| Unmarried: | 74.5% (111) |
Marital status - American Indian / Alaska Native population 15 years and over
- Males
- 100.0%Never married
- 0.0%Now married
- 0.0%Separated
- 0.0%Widowed
- 0.0%Divorced
- Females
- 0.0%Never married
- 100.0%Now married
- 0.0%Separated
- 0.0%Widowed
- 0.0%Divorced
Marital status - Asian population 15 years and over
- Males
- 30.3%Never married
- 69.7%Now married
- 0.0%Separated
- 0.0%Widowed
- 0.0%Divorced
- Females
- 90.1%Never married
- 9.9%Now married
- 0.0%Separated
- 0.0%Widowed
- 0.0%Divorced
Women who did not give birth in the past 12 months
| Now married: | 9.9% (15) |
| Unmarried: | 90.1% (132) |
Marital status - Other race population 15 years and over
- Males
- 84.8%Never married
- 15.2%Now married
- 0.0%Separated
- 0.0%Widowed
- 0.0%Divorced
- Females
- 47.8%Never married
- 0.0%Now married
- 52.2%Separated
- 0.0%Widowed
- 0.0%Divorced
Women who did not give birth in the past 12 months
| Now married: | 52.2% (42) |
| Unmarried: | 47.8% (39) |
Marital status - Two or more races population 15 years and over
- Males
- 60.9%Never married
- 20.2%Now married
- 0.0%Separated
- 6.3%Widowed
- 12.6%Divorced
- Females
- 54.9%Never married
- 27.3%Now married
- 0.0%Separated
- 1.6%Widowed
- 16.3%Divorced
Women who gave birth in the past 12 months
| Now married: | 6.7% (5) |
| Unmarried: | 93.3% (77) |
Women who did not give birth in the past 12 months
| Now married: | 26.3% (82) |
| Unmarried: | 73.7% (230) |
Marital status - White alone, not Hispanic / Latino population 15 years and over
- Males
- 43.0%Never married
- 44.8%Now married
- 0.2%Separated
- 2.3%Widowed
- 9.8%Divorced
- Females
- 29.2%Never married
- 41.1%Now married
- 1.6%Separated
- 13.2%Widowed
- 14.9%Divorced
Women who gave birth in the past 12 months
| Now married: | 59.1% (89) |
| Unmarried: | 40.9% (62) |
Women who did not give birth in the past 12 months
| Now married: | 40.3% (1,268) |
| Unmarried: | 59.7% (1,878) |
Marital status - Hispanic or Latino population 15 years and over
- Males
- 56.9%Never married
- 32.5%Now married
- 0.0%Separated
- 9.6%Widowed
- 1.0%Divorced
- Females
- 57.5%Never married
- 30.8%Now married
- 11.7%Separated
- 0.0%Widowed
- 0.0%Divorced
Women who gave birth in the past 12 months
| Now married: | 0.0% (0) |
| Unmarried: | 100.0% (60) |
Women who did not give birth in the past 12 months
| Now married: | 52.3% (136) |
| Unmarried: | 47.7% (124) |
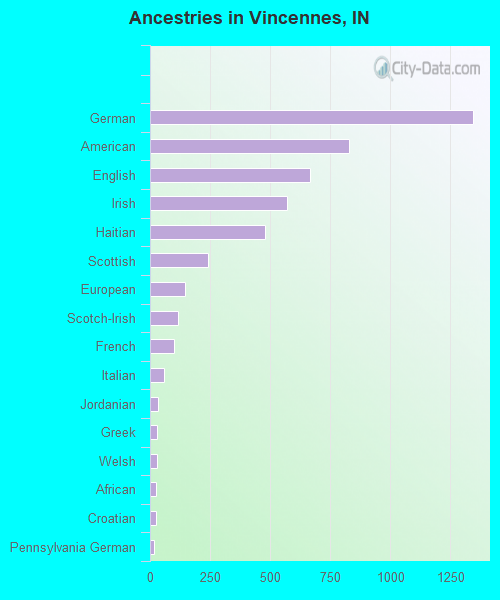
Ancestries in Vincennes

- 1,34522.5%German
- 82713.8%American
- 66711.2%English
- 5699.5%Irish
- 4798.0%Haitian
- 2424.0%Scottish
- 1452.4%European
- 1172.0%Scotch-Irish
- 981.6%French
- 601.0%Italian
- 330.6%Jordanian
- 300.5%Greek
- 300.5%Welsh
- 260.4%African
- 250.4%Croatian
- 150.3%Pennsylvania German
- 120.2%Polish
- 110.2%Austrian
- 90.2%Dutch
- 90.2%Scandinavian
- 80.1%Hungarian
- 60.1%British
- 50.08%Swedish
- 30.05%Eastern European
- 30.05%Ukrainian
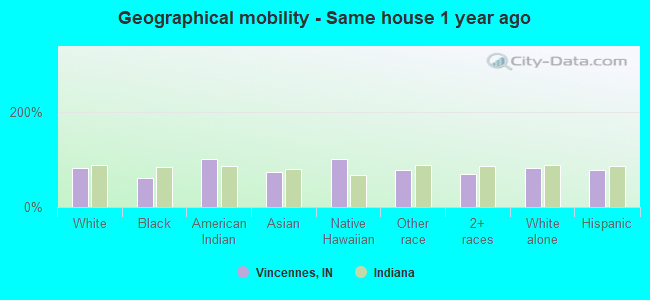
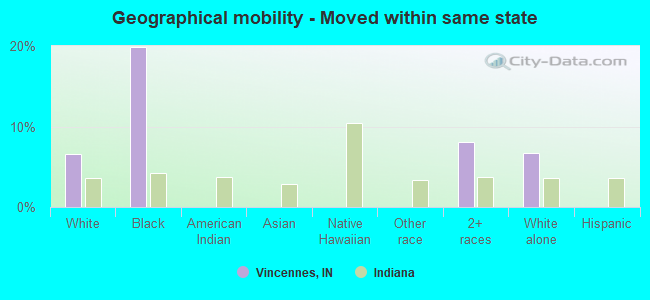
Geographical mobility in Vincennes

- Same house 1 year ago
- 11,50882.3%White (Caucasian)
- 47560.3%Black or African American
- 20100.0%American Indian / Alaska Native
- 21072.6%Asian
- 44100.0%Native Hawaiian / Pacific Islander
- 25578.2%Other race
- 78769.8%Two or more races
- 11,35281.9%White alone, not Hispanic / Latino
- 59678.0%Hispanic or Latino
-
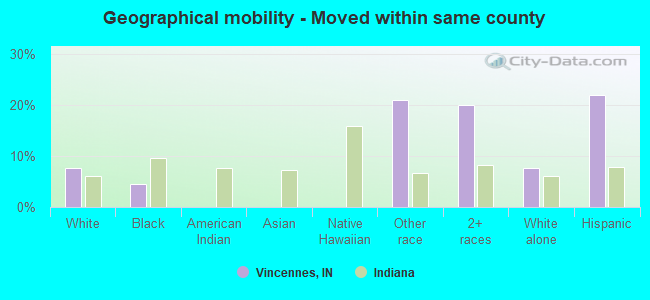
- Moved within same county
- 1,0597.6%White / Caucasian
- 364.5%Black or African American
- 6820.9%Other race
- 22520.0%Two or more races
- 1,0687.7%White alone, not Hispanic / Latino
- 16721.8%Hispanic or Latino
-
- Moved within same state
- 9206.6%White / Caucasian
- 15719.9%Black or African American
- 918.1%Two or more races
- 9356.8%White alone, not Hispanic / Latino
-
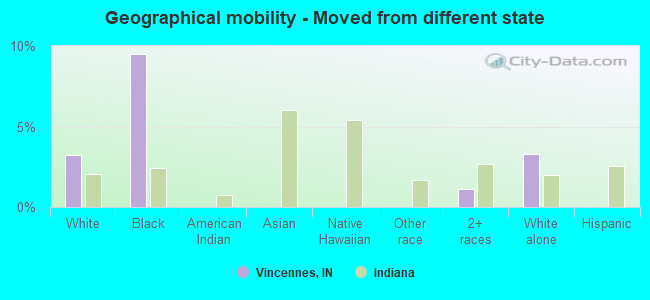
- Moved from different state
- 4493.2%White / Caucasian
- 759.5%Black or African American
- 131.1%Two or more races
- 4593.3%White alone, not Hispanic / Latino
-
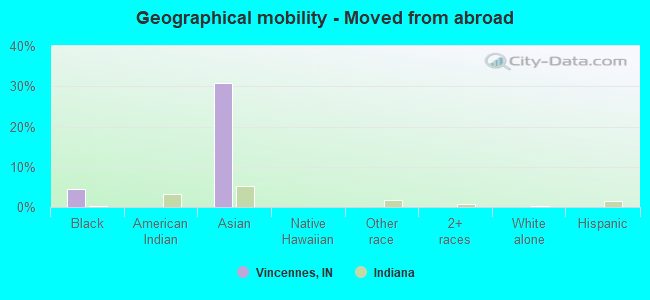
- Moved from abroad
- 354.5%Black or African American
- 8930.9%Asian
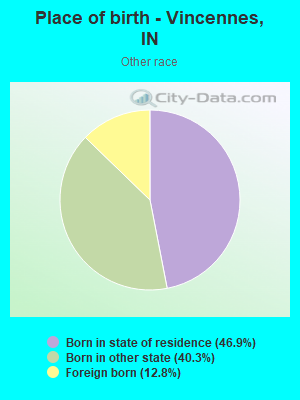
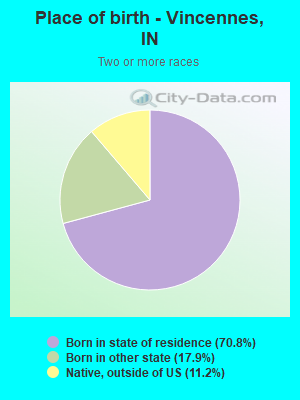
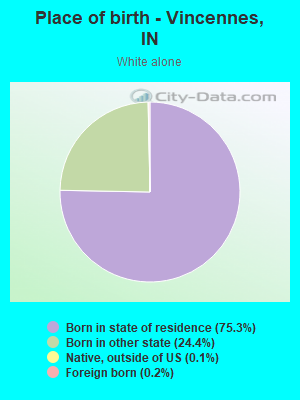
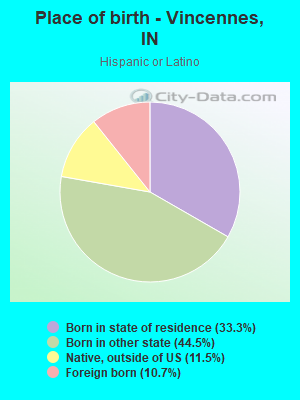
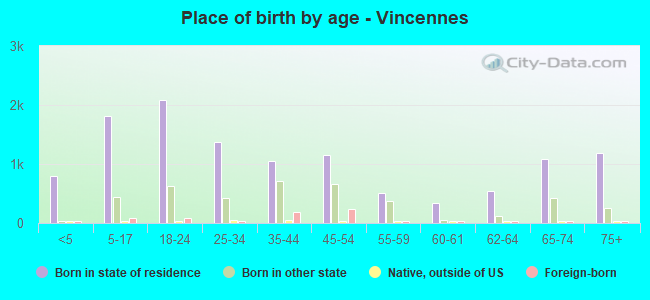
Children Nativity (place of birth) in Vincennes
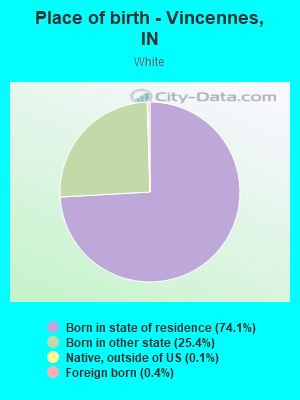
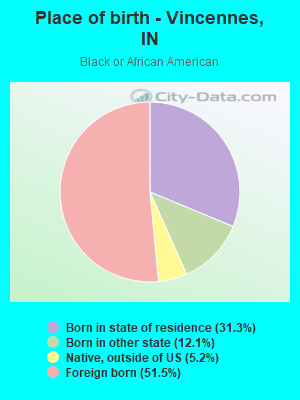
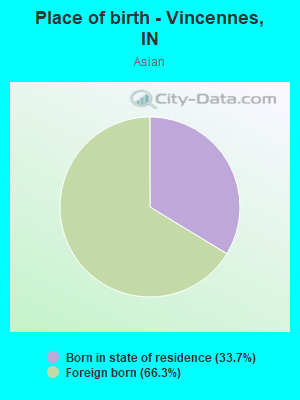
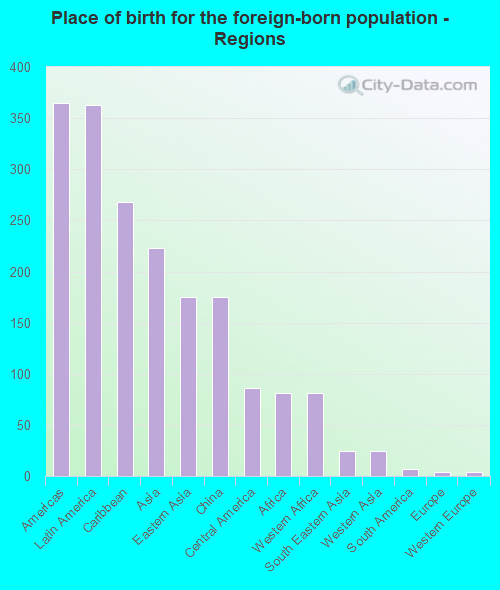
Place of birth for residents in Vincennes
![Place of birth for the foreign-born population - Regions]()
- 365Americas
- 363Latin America
- 268Caribbean
- 223Asia
- 175Eastern Asia
- 175China
- 86Central America
- 81Africa
- 81Western Africa
- 24South Eastern Asia
- 24Western Asia
- 7South America
- 4Europe
- 4Western Europe
- 2Northern America
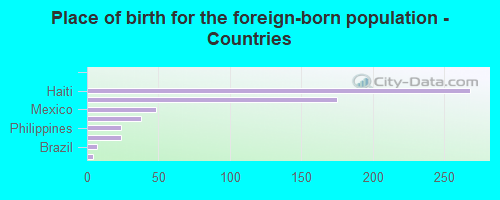
![Place of birth for the foreign-born population - Countries]()
- 268Haiti
- 175China
- 48Mexico
- 38Guatemala
- 24Philippines
- 24Jordan
- 7Brazil
- 4France
- 2Canada
Grandparents responsible for own grandchildren in Vincennes
Zip codes: 47591.