Races in Vineland, New Jersey (NJ) Detailed Stats
Data:
Races - White alone (%)
Races - White alone (% change since 2000)
Races - Black alone (%)
Races - Black alone (% change since 2000)
Races - American Indian alone (%)
Races - American Indian alone (% change since 2000)
Races - Asian alone (%)
Races - Asian alone (% change since 2000)
Races - Hispanic (%)
Races - Hispanic (% change since 2000)
Races - Native Hawaiian and Other Pacific Islander alone (%)
Races - Native Hawaiian and Other Pacific Islander alone (% change since 2000)
Races - Two or more races(%)
Races - Two or more races(% change since 2000)
Races - Other race alone (%)
Races - Other race alone (% change since 2000)
Racial diversity
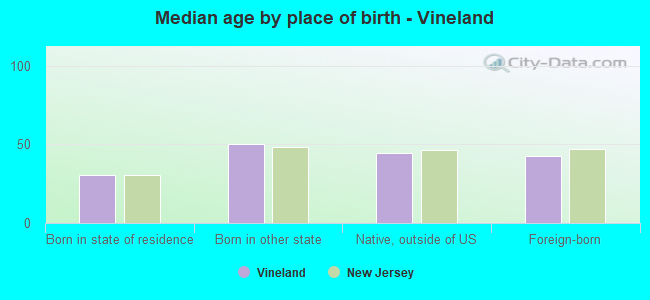
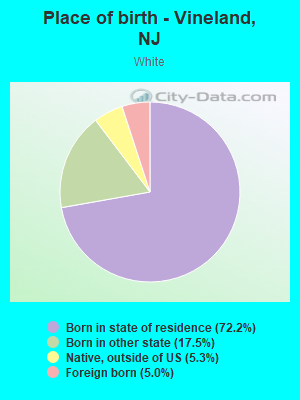
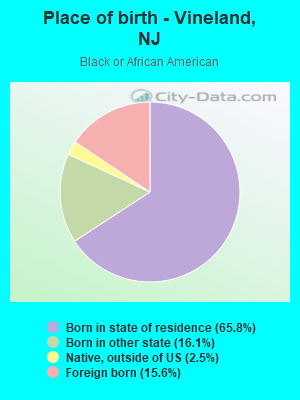
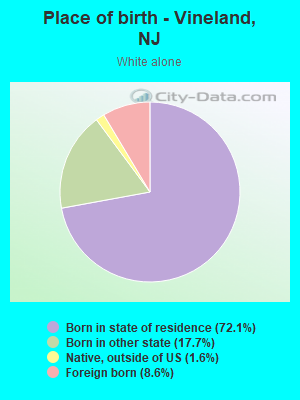
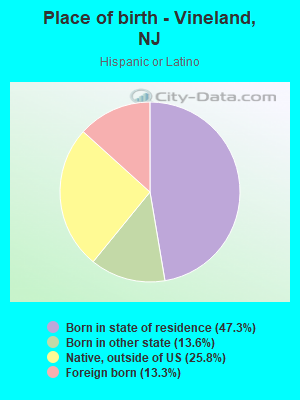
Place of birth - Born in state of residence (%)
Place of birth - Born in state of residence (%) - White
Place of birth - Born in state of residence (%) - Black or African American
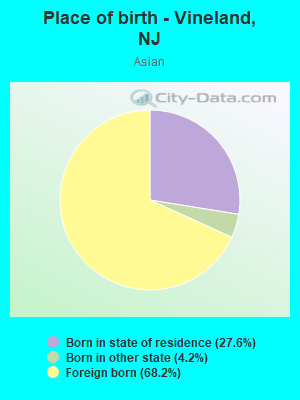
Place of birth - Born in state of residence (%) - Asian
Place of birth - Born in state of residence (%) - Hispanic or Latino
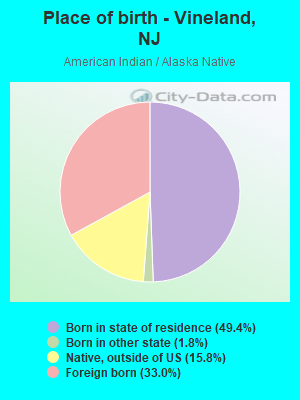
Place of birth - Born in state of residence (%) - American Indian and Alaska Native
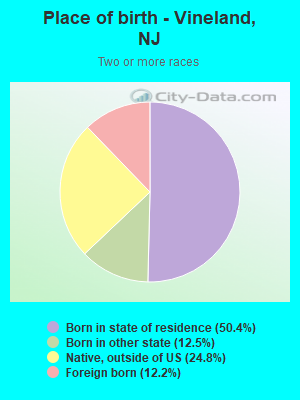
Place of birth - Born in state of residence (%) - Multirace
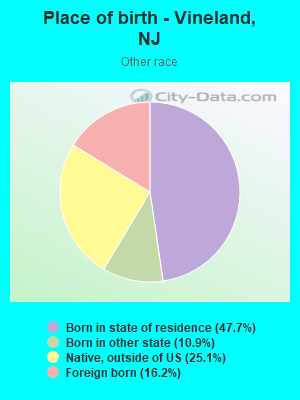
Place of birth - Born in state of residence (%) - Other Race
Place of birth - Born in other state (%)
Place of birth - Born in other state (%) - White
Place of birth - Born in other state (%) - Black or African American
Place of birth - Born in other state (%) - Asian
Place of birth - Born in other state (%) - Hispanic or Latino
Place of birth - Born in other state (%) - American Indian and Alaska Native
Place of birth - Born in other state (%) - Multirace
Place of birth - Born in other state (%) - Other Race
Place of birth - Native, outside of US (%)
Place of birth - Native, outside of US (%) - White
Place of birth - Native, outside of US (%) - Black or African American
Place of birth - Native, outside of US (%) - Asian
Place of birth - Native, outside of US (%) - Hispanic or Latino
Place of birth - Native, outside of US (%) - American Indian and Alaska Native
Place of birth - Native, outside of US (%) - Multirace
Place of birth - Native, outside of US (%) - Other Race
Place of birth - Foreign born (%)
Place of birth - Foreign born (%) - White
Place of birth - Foreign born (%) - Black or African American
Place of birth - Foreign born (%) - Asian
Place of birth - Foreign born (%) - Hispanic or Latino
Place of birth - Foreign born (%) - American Indian and Alaska Native
Place of birth - Foreign born (%) - Multirace
Place of birth - Foreign born (%) - Other Race
Residents speaking English at home (%)
Residents speaking English at home - Born in the United States (%)
Residents speaking English at home - Native, born elsewhere (%)
Residents speaking English at home - Foreign born (%)
Residents speaking Spanish at home (%)
Residents speaking Spanish at home - Born in the United States (%)
Residents speaking Spanish at home - Native, born elsewhere (%)
Residents speaking Spanish at home - Foreign born (%)
Residents speaking other language at home (%)
Residents speaking other language at home - Born in the United States (%)
Residents speaking other language at home - Native, born elsewhere (%)
Residents speaking other language at home - Foreign born (%)
Marital status - Never married (%)
Marital status - Now married (%)
Marital status - Separated (%)
Marital status - Widowed (%)
Marital status - Divorced (%)
Ancestries Reported - Arab (%)
Ancestries Reported - Czech (%)
Ancestries Reported - Danish (%)
Ancestries Reported - Dutch (%)
Ancestries Reported - English (%)
Ancestries Reported - French (%)
Ancestries Reported - French Canadian (%)
Ancestries Reported - German (%)
Ancestries Reported - Greek (%)
Ancestries Reported - Hungarian (%)
Ancestries Reported - Irish (%)
Ancestries Reported - Italian (%)
Ancestries Reported - Lithuanian (%)
Ancestries Reported - Norwegian (%)
Ancestries Reported - Polish (%)
Ancestries Reported - Portuguese (%)
Ancestries Reported - Russian (%)
Ancestries Reported - Scotch-Irish (%)
Ancestries Reported - Scottish (%)
Ancestries Reported - Slovak (%)
Ancestries Reported - Subsaharan African (%)
Ancestries Reported - Swedish (%)
Ancestries Reported - Swiss (%)
Ancestries Reported - Ukrainian (%)
Ancestries Reported - United States (%)
Ancestries Reported - Welsh (%)
Ancestries Reported - West Indian (%)
Ancestries Reported - Other (%)
Geographical mobility - Same house 1 year ago (%)
Geographical mobility - Same house 1 year ago (%) - White
Geographical mobility - Same house 1 year ago (%) - Black or African American
Geographical mobility - Same house 1 year ago (%) - Asian
Geographical mobility - Same house 1 year ago (%) - Hispanic or Latino
Geographical mobility - Same house 1 year ago (%) - American Indian and Alaska Native
Geographical mobility - Same house 1 year ago (%) - Multirace
Geographical mobility - Same house 1 year ago (%) - Other Race
Geographical mobility - Moved within same county (%)
Geographical mobility - Moved within same county (%) - White
Geographical mobility - Moved within same county (%) - Black or African American
Geographical mobility - Moved within same county (%) - Asian
Geographical mobility - Moved within same county (%) - Hispanic or Latino
Geographical mobility - Moved within same county (%) - American Indian and Alaska Native
Geographical mobility - Moved within same county (%) - Multirace
Geographical mobility - Moved within same county (%) - Other Race
Geographical mobility - Moved from different county within same state (%)
Geographical mobility - Moved from different county within same state (%) - White
Geographical mobility - Moved from different county within same state (%) - Black or African American
Geographical mobility - Moved from different county within same state (%) - Asian
Geographical mobility - Moved from different county within same state (%) - Hispanic or Latino
Geographical mobility - Moved from different county within same state (%) - American Indian and Alaska Native
Geographical mobility - Moved from different county within same state (%) - Multirace
Geographical mobility - Moved from different county within same state (%) - Other Race
Geographical mobility - Moved from different state (%)
Geographical mobility - Moved from different state (%) - White
Geographical mobility - Moved from different state (%) - Black or African American
Geographical mobility - Moved from different state (%) - Asian
Geographical mobility - Moved from different state (%) - Hispanic or Latino
Geographical mobility - Moved from different state (%) - American Indian and Alaska Native
Geographical mobility - Moved from different state (%) - Multirace
Geographical mobility - Moved from different state (%) - Other Race
Geographical mobility - Moved from abroad (%)
Geographical mobility - Moved from abroad (%) - White
Geographical mobility - Moved from abroad (%) - Black or African American
Geographical mobility - Moved from abroad (%) - Asian
Geographical mobility - Moved from abroad (%) - Hispanic or Latino
Geographical mobility - Moved from abroad (%) - American Indian and Alaska Native
Geographical mobility - Moved from abroad (%) - Multirace
Geographical mobility - Moved from abroad (%) - Other Race
Place of birth for the foreign-born population - Ireland (%)
Place of birth for the foreign-born population - Denmark (%)
Place of birth for the foreign-born population - Norway (%)
Place of birth for the foreign-born population - Sweden (%)
Place of birth for the foreign-born population - United Kingdom (%)
Place of birth for the foreign-born population - England (%)
Place of birth for the foreign-born population - Scotland (%)
Place of birth for the foreign-born population - Other Northern Europe (%)
Place of birth for the foreign-born population - Austria (%)
Place of birth for the foreign-born population - Belgium (%)
Place of birth for the foreign-born population - France (%)
Place of birth for the foreign-born population - Germany (%)
Place of birth for the foreign-born population - Netherlands (%)
Place of birth for the foreign-born population - Switzerland (%)
Place of birth for the foreign-born population - Other Western Europe (%)
Place of birth for the foreign-born population - Greece (%)
Place of birth for the foreign-born population - Italy (%)
Place of birth for the foreign-born population - Portugal (%)
Place of birth for the foreign-born population - Spain (%)
Place of birth for the foreign-born population - Other Southern Europe (%)
Place of birth for the foreign-born population - Albania (%)
Place of birth for the foreign-born population - Belarus (%)
Place of birth for the foreign-born population - Bosnia and Herzegovina (%)
Place of birth for the foreign-born population - Bulgaria (%)
Place of birth for the foreign-born population - Croatia (%)
Place of birth for the foreign-born population - Czechoslovakia (%)
Place of birth for the foreign-born population - Hungary (%)
Place of birth for the foreign-born population - Latvia (%)
Place of birth for the foreign-born population - Lithuania (%)
Place of birth for the foreign-born population - North Macedonia (Macedonia) (%)
Place of birth for the foreign-born population - Moldova (%)
Place of birth for the foreign-born population - Poland (%)
Place of birth for the foreign-born population - Romania (%)
Place of birth for the foreign-born population - Russia (%)
Place of birth for the foreign-born population - Serbia (%)
Place of birth for the foreign-born population - Ukraine (%)
Place of birth for the foreign-born population - Other Eastern Europe (%)
Place of birth for the foreign-born population - China (%)
Place of birth for the foreign-born population - Hong Kong (%)
Place of birth for the foreign-born population - Taiwan (%)
Place of birth for the foreign-born population - Japan (%)
Place of birth for the foreign-born population - Korea (%)
Place of birth for the foreign-born population - Other Eastern Asia (%)
Place of birth for the foreign-born population - Afghanistan (%)
Place of birth for the foreign-born population - Bangladesh (%)
Place of birth for the foreign-born population - India (%)
Place of birth for the foreign-born population - Iran (%)
Place of birth for the foreign-born population - Kazakhstan (%)
Place of birth for the foreign-born population - Nepal (%)
Place of birth for the foreign-born population - Pakistan (%)
Place of birth for the foreign-born population - Sri Lanka (%)
Place of birth for the foreign-born population - Uzbekistan (%)
Place of birth for the foreign-born population - Other South Central Asia (%)
Place of birth for the foreign-born population - Burma (%)
Place of birth for the foreign-born population - Cambodia (%)
Place of birth for the foreign-born population - Indonesia (%)
Place of birth for the foreign-born population - Laos (%)
Place of birth for the foreign-born population - Malaysia (%)
Place of birth for the foreign-born population - Philippines (%)
Place of birth for the foreign-born population - Singapore (%)
Place of birth for the foreign-born population - Thailand (%)
Place of birth for the foreign-born population - Vietnam (%)
Place of birth for the foreign-born population - Other South Eastern Asia (%)
Place of birth for the foreign-born population - Armenia (%)
Place of birth for the foreign-born population - Iraq (%)
Place of birth for the foreign-born population - Israel (%)
Place of birth for the foreign-born population - Jordan (%)
Place of birth for the foreign-born population - Kuwait (%)
Place of birth for the foreign-born population - Lebanon (%)
Place of birth for the foreign-born population - Saudi Arabia (%)
Place of birth for the foreign-born population - Syria (%)
Place of birth for the foreign-born population - Turkey (%)
Place of birth for the foreign-born population - Yemen (%)
Place of birth for the foreign-born population - Other Western Asia (%)
Place of birth for the foreign-born population - Eritrea (%)
Place of birth for the foreign-born population - Ethiopia (%)
Place of birth for the foreign-born population - Kenya (%)
Place of birth for the foreign-born population - Somalia (%)
Place of birth for the foreign-born population - Uganda (%)
Place of birth for the foreign-born population - Zimbabwe (%)
Place of birth for the foreign-born population - Other Eastern Africa (%)
Place of birth for the foreign-born population - Cameroon (%)
Place of birth for the foreign-born population - Congo (%)
Place of birth for the foreign-born population - Democratic Republic of Congo (Zaire) (%)
Place of birth for the foreign-born population - Other Middle Africa (%)
Place of birth for the foreign-born population - Egypt (%)
Place of birth for the foreign-born population - Morocco (%)
Place of birth for the foreign-born population - Sudan (%)
Place of birth for the foreign-born population - Other Northern Africa (%)
Place of birth for the foreign-born population - South Africa (%)
Place of birth for the foreign-born population - Other Southern Africa (%)
Place of birth for the foreign-born population - Cabo Verde (%)
Place of birth for the foreign-born population - Ghana (%)
Place of birth for the foreign-born population - Liberia (%)
Place of birth for the foreign-born population - Nigeria (%)
Place of birth for the foreign-born population - Senegal (%)
Place of birth for the foreign-born population - Sierra Leone (%)
Place of birth for the foreign-born population - Other Western Africa (%)
Place of birth for the foreign-born population - Australia (%)
Place of birth for the foreign-born population - New Zealand (%)
Place of birth for the foreign-born population - Fiji (%)
Place of birth for the foreign-born population - Micronesia (%)
Place of birth for the foreign-born population - Bahamas (%)
Place of birth for the foreign-born population - Barbados (%)
Place of birth for the foreign-born population - Cuba (%)
Place of birth for the foreign-born population - Dominica (%)
Place of birth for the foreign-born population - Dominican Republic (%)
Place of birth for the foreign-born population - Grenada (%)
Place of birth for the foreign-born population - Haiti (%)
Place of birth for the foreign-born population - Jamaica (%)
Place of birth for the foreign-born population - St. Vincent and the Grenadines (%)
Place of birth for the foreign-born population - Trinidad and Tobago (%)
Place of birth for the foreign-born population - West Indies (%)
Place of birth for the foreign-born population - Other Caribbean (%)
Place of birth for the foreign-born population - Belize (%)
Place of birth for the foreign-born population - Costa Rica (%)
Place of birth for the foreign-born population - El Salvador (%)
Place of birth for the foreign-born population - Guatemala (%)
Place of birth for the foreign-born population - Honduras (%)
Place of birth for the foreign-born population - Mexico (%)
Place of birth for the foreign-born population - Nicaragua (%)
Place of birth for the foreign-born population - Panama (%)
Place of birth for the foreign-born population - Other Central America (%)
Place of birth for the foreign-born population - Argentina (%)
Place of birth for the foreign-born population - Bolivia (%)
Place of birth for the foreign-born population - Brazil (%)
Place of birth for the foreign-born population - Chile (%)
Place of birth for the foreign-born population - Colombia (%)
Place of birth for the foreign-born population - Ecuador (%)
Place of birth for the foreign-born population - Guyana (%)
Place of birth for the foreign-born population - Peru (%)
Place of birth for the foreign-born population - Uruguay (%)
Place of birth for the foreign-born population - Venezuela (%)
Place of birth for the foreign-born population - Other South America (%)
Place of birth for the foreign-born population - Canada (%)
Place of birth for the foreign-born population - Other Northern America (%)
Place of birth for the foreign-born population - Other (%)
Latest news about races in Vineland, NJ collected exclusively by city-data.com from local newspapers, TV, and radio stations
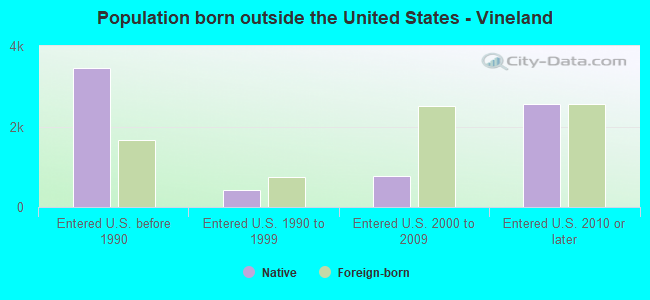
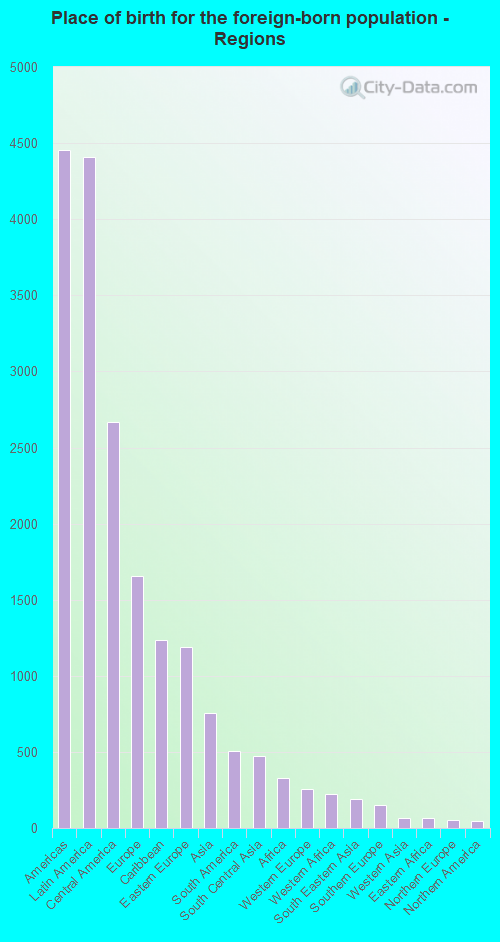
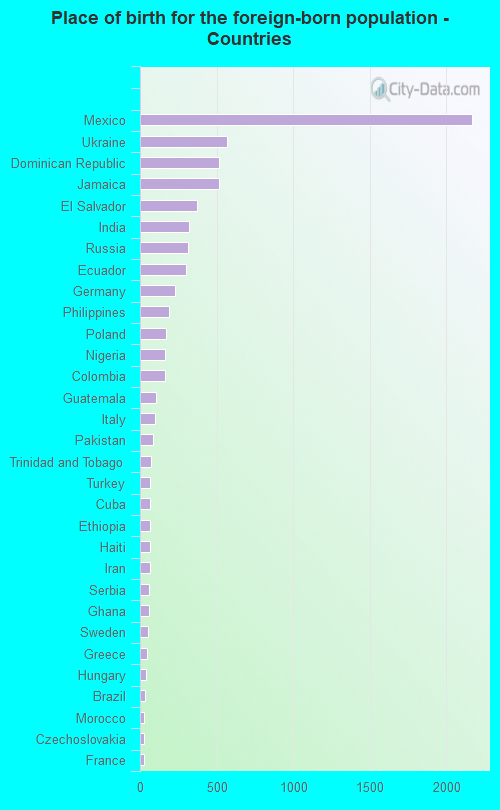
According to 2022 data, the most numerous races in Vineland, NJ are White alone (23,347 residents), Hispanic (26,753 residents), and Black alone (6,402 residents). 62.8% of Vineland residents speak English at home. 12.0% of Vineland, NJ residents are foreign-born (7.1% born in Latin America, 2.7% born in Europe, 1.2% born in Asia), which is 91.4% less than the foreign-born rate of 23.0% across the entire state of New Jersey.
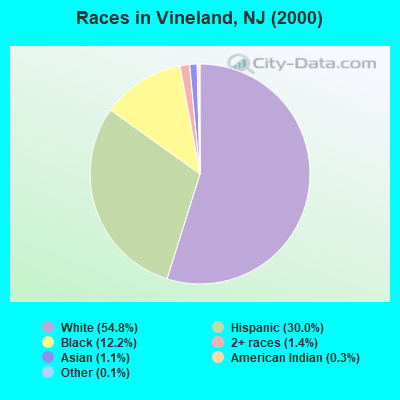
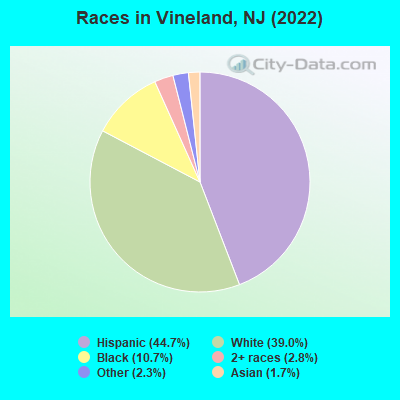
Race distribution in Vineland
2000 2022
5,557,209 66.0% White alone 1,117,191 13.3% Hispanic 1,096,171 13.0% Black alone 477,012 5.7% Asian alone 133,689 1.6% Two or more races 19,565 0.2% Other race alone 11,338 0.1% American Indian alone 2,175 0.03% Native Hawaiian and Other
4,766,476 51.5% White alone 2,028,470 21.9% Hispanic 1,111,632 12.0% Black alone 923,546 10.0% Asian alone 332,237 3.6% Two or more races 89,847 1.0% Other race alone 8,557 0.09% American Indian alone 934 0.01% Native Hawaiian and Other
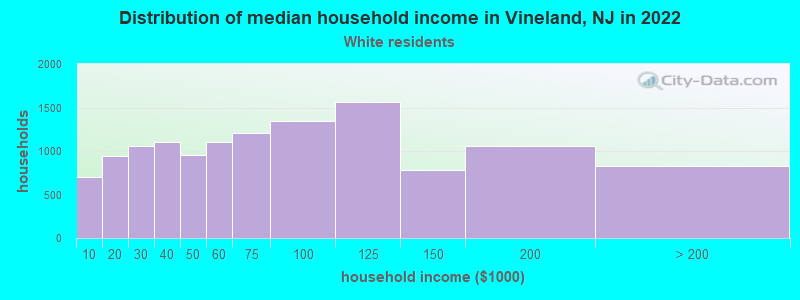
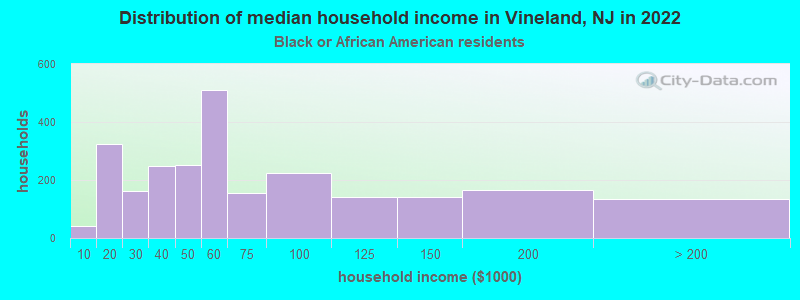
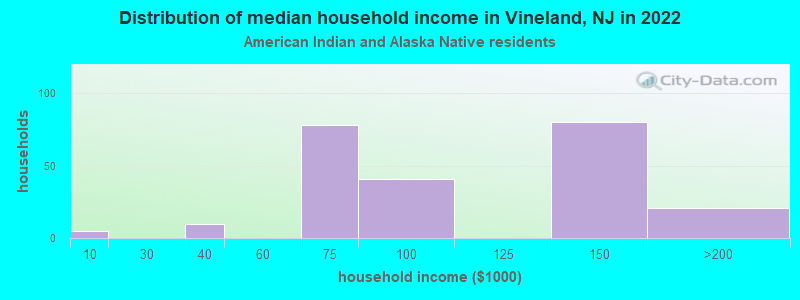
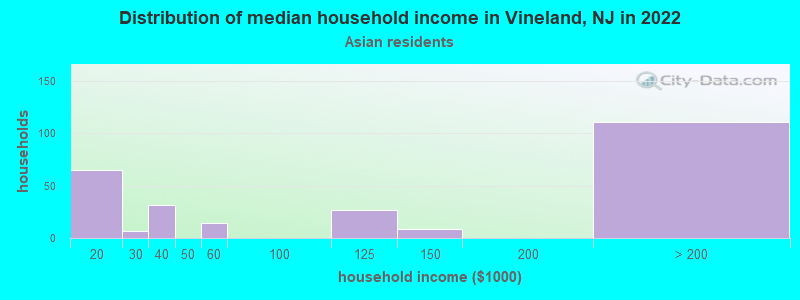
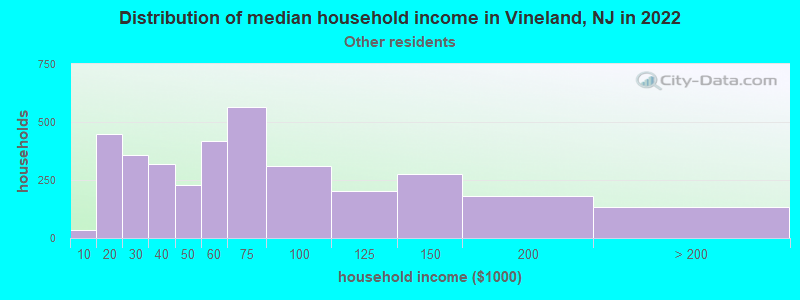
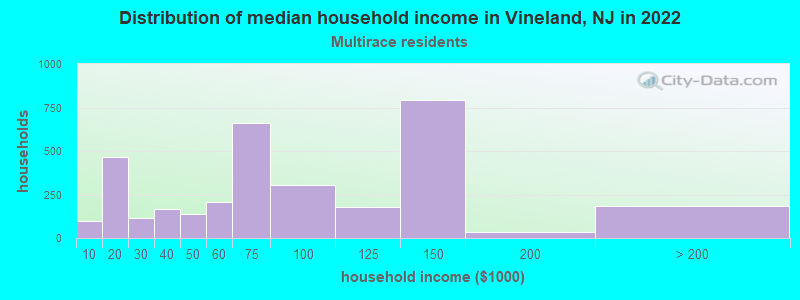
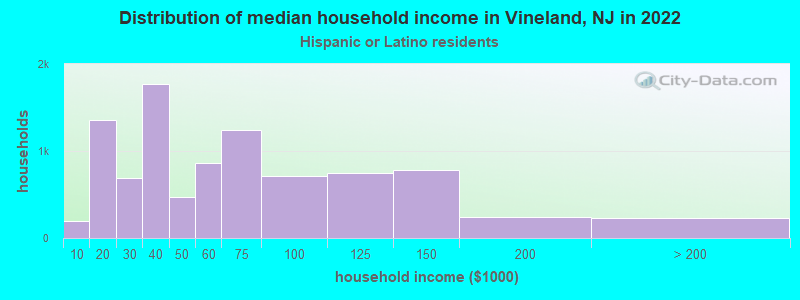
Income and house value in Vineland Median household income in 2022 $74,300 White non-Hispanic householders$75,661 Black householders$136,007 American Indian and Alaska Native householders$54,749 Some other race householders$61,743 Two or more races householders$52,850 Hispanic or Latino race householdersMedian 2022 house value $237,065 White Non-Hispanic householders$196,713 Black or African American householders$163,469 American Indian or Alaska Native householders $221,245 Asian householders$171,952 Native Hawaiian and other Pacific Islander householders$197,172 Some other race householders$178,830 Two or more races householders$195,796 Hispanic or Latino householders
Median age by race in Vineland
47.7 Median age for White residents45.8 49.4 41.1 Median age for Black or African American residents33.3 43.1 46.1 Median age for American Indian / Alaska Native residents44.9 36.8 36.9 Median age for Asian residents41.2 37.2 -804,177,544.9 Median age for Native Hawaiian / Pacific Islander residents-666,666,666.0 -666,666,666.0 31.7 Median age for Other race residents27.6 36.2 24.1 Median age for Two or more races residents23.1 31.6 49.8 Median age for White alone residents48.6 51.0 30.3 Median age for Hispanic or Latino residents28.0 32.2
Owner/renter occupied households by race in Vineland
House owners and renters - White residents 9,669 76.1% Owner occupied3,044 23.9% Renter occupiedHouse owners and renters - Black or African American residents 1,584 65.5% Owner occupied834 34.5% Renter occupiedHouse owners and renters - American Indian / Alaska Native residents 206 93.4% Owner occupied15 6.6% Renter occupiedHouse owners and renters - Asian residents 321 73.9% Owner occupied113 26.1% Renter occupiedHouse owners and renters - Native Hawaiian / Pacific Islander residents 26 100.0% Owner occupiedHouse owners and renters - Other race residents 2,592 57.1% Owner occupied1,948 42.9% Renter occupiedHouse owners and renters - Two or more races residents 1,793 52.6% Owner occupied1,614 47.4% Renter occupiedHouse owners and renters - White alone residents 8,229 78.5% Owner occupied2,248 21.5% Renter occupiedHouse owners and renters - Hispanic or Latino residents 5,218 58.8% Owner occupied3,655 41.2% Renter occupied
Language usage in Vineland
English speakers - Total 62.8% of residents of Vineland speak English at home.
30.8% of residents speak Spanish at home 8,926 51.4% Speak English very well8,453 48.6% Speak English less than very well6.6% of residents speak other language at home 1,993 53.7% Speak English very well1,719 46.3% Speak English less than very well
English speakers - Born in the United States 71.0% of residents of Vineland speak English at home.
28.9% of residents speak Spanish at home 1,803 72.6% Speak English very well680 27.4% Speak English less than very well2.9% of residents speak other language at home 207 84.1% Speak English very well39 15.9% Speak English less than very well
English speakers - Native, born elsewhere 7.4% of residents of Vineland speak English at home.
91.9% of residents speak Spanish at home 2,719 40.3% Speak English very well4,027 59.7% Speak English less than very well0.1% of residents speak other language at home 8 100.0% Speak English very well
English speakers - Foreign-born 21.3% of residents of Vineland speak English at home.
44.1% of residents speak Spanish at home 890 26.8% Speak English very well2,436 73.2% Speak English less than very well37.6% of residents speak other language at home 1,406 49.6% Speak English very well1,430 50.4% Speak English less than very well
White (Caucasian) - Speak only English Native:
83.8% (21,585)Foreign-born:
25.0% (352)
White (Caucasian) - Speak another language Native:
12.1% (3,116)Foreign-born:
75.2% (1,056)
Black or African American - Speak only English Native:
96.0% (5,706)Foreign-born:
71.6% (827)
Black or African American - Speak another language Native:
6.6% (395)Foreign-born:
25.9% (299)
American Indian / Alaska Native - Speak another language Native:
100.0% (408)Foreign-born:
97.6% (207)
Asian - Speak only English Native:
16.0% (57)Foreign-born:
16.8% (118)
Asian - Speak another language Native:
81.6% (290)Foreign-born:
83.1% (584)
Other race - Speak only English Native:
32.7% (3,504)Foreign-born:
9.9% (217)
Other race - Speak another language Native:
67.3% (7,215)Foreign-born:
90.2% (1,976)
Two or more races - Speak another language Native:
50.5% (3,976)Foreign-born:
94.3% (1,315)
White alone - Speak only English Native:
94.8% (19,618)Foreign-born:
17.8% (361)
White alone - Speak another language Native:
5.0% (1,026)Foreign-born:
83.4% (1,686)
Hispanic or Latino - Speak only English Native:
33.6% (7,032)Foreign-born:
6.9% (242)
Hispanic or Latino - Speak another language Native:
66.5% (13,903)Foreign-born:
92.7% (3,274)
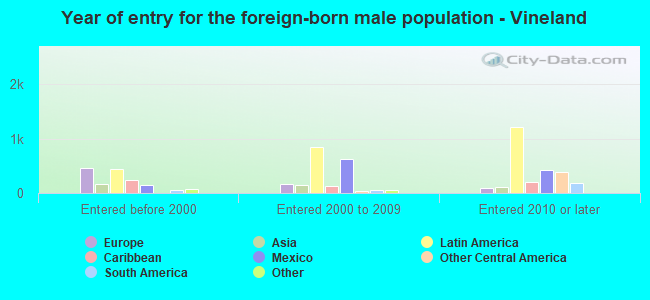
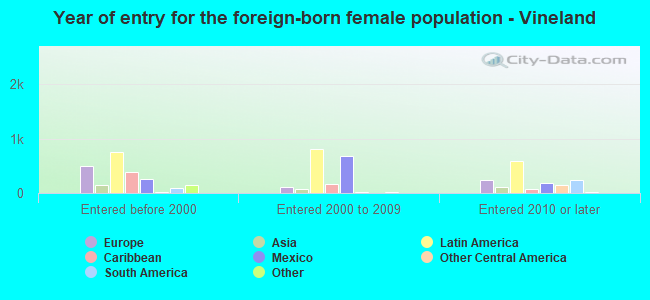
Foreign-born residents in Vineland 7,198 residents are foreign born (7.1% Latin America , 2.7% Europe , 1.2% Asia ).
This city:
12.0%New Jersey:
23.2%
Marital status for residents in Vineland Marital status - White (Caucasian) population 15 years and over
Males 35.2% Never married47.8% Now married1.5% Separated3.7% Widowed11.9% DivorcedFemales 27.1% Never married47.9% Now married2.2% Separated10.8% Widowed11.9% DivorcedWomen who gave birth in the past 12 months Now married:
59.5% (174)Unmarried:
40.5% (119)
Women who did not give birth in the past 12 months Now married:
46.0% (2,413)Unmarried:
54.0% (2,827)
Marital status - Black or African American population 15 years and over
Males 50.0% Never married37.3% Now married2.4% Separated0.2% Widowed10.1% DivorcedFemales 50.8% Never married28.6% Now married4.4% Separated6.6% Widowed9.6% DivorcedWomen who gave birth in the past 12 months Now married:
100.0% (15)Unmarried:
0.0% (0)
Women who did not give birth in the past 12 months Now married:
25.5% (346)Unmarried:
74.5% (1,008)
Marital status - American Indian / Alaska Native population 15 years and over
Males 60.0% Never married36.1% Now married3.9% Separated0.0% Widowed0.0% DivorcedFemales 50.0% Never married14.6% Now married0.0% Separated0.0% Widowed35.4% DivorcedWomen who did not give birth in the past 12 months Now married:
1.8% (5)Unmarried:
98.2% (253)
Marital status - Asian population 15 years and over
Males 17.4% Never married73.2% Now married4.0% Separated5.3% Widowed0.0% DivorcedFemales 33.7% Never married64.0% Now married0.0% Separated0.0% Widowed2.3% DivorcedWomen who gave birth in the past 12 months Now married:
100.0% (8)Unmarried:
0.0% (0)
Women who did not give birth in the past 12 months Now married:
63.9% (153)Unmarried:
36.1% (87)
Marital status - Other race population 15 years and over
Males 45.2% Never married46.8% Now married0.0% Separated5.2% Widowed2.8% DivorcedFemales 32.9% Never married36.2% Now married8.7% Separated5.8% Widowed16.4% DivorcedWomen who gave birth in the past 12 months Now married:
77.6% (232)Unmarried:
22.4% (67)
Women who did not give birth in the past 12 months Now married:
49.2% (1,565)Unmarried:
50.8% (1,618)
Marital status - Two or more races population 15 years and over
Males 48.2% Never married38.3% Now married5.7% Separated0.7% Widowed7.1% DivorcedFemales 42.2% Never married36.6% Now married6.5% Separated6.1% Widowed8.6% DivorcedWomen who gave birth in the past 12 months Now married:
100.0% (20)Unmarried:
0.0% (0)
Women who did not give birth in the past 12 months Now married:
36.8% (1,008)Unmarried:
63.2% (1,731)
Marital status - White alone, not Hispanic / Latino population 15 years and over
Males 32.3% Never married53.6% Now married1.1% Separated3.9% Widowed9.1% DivorcedFemales 26.3% Never married50.9% Now married0.7% Separated12.8% Widowed9.3% DivorcedWomen who gave birth in the past 12 months Now married:
76.4% (118)Unmarried:
23.6% (37)
Women who did not give birth in the past 12 months Now married:
48.4% (2,107)Unmarried:
51.6% (2,243)
Marital status - Hispanic or Latino population 15 years and over
Males 45.9% Never married37.3% Now married2.6% Separated3.4% Widowed10.8% DivorcedFemales 34.1% Never married37.1% Now married7.0% Separated5.2% Widowed16.6% DivorcedWomen who gave birth in the past 12 months Now married:
63.0% (271)Unmarried:
37.0% (159)
Women who did not give birth in the past 12 months Now married:
42.4% (2,512)Unmarried:
57.6% (3,408)
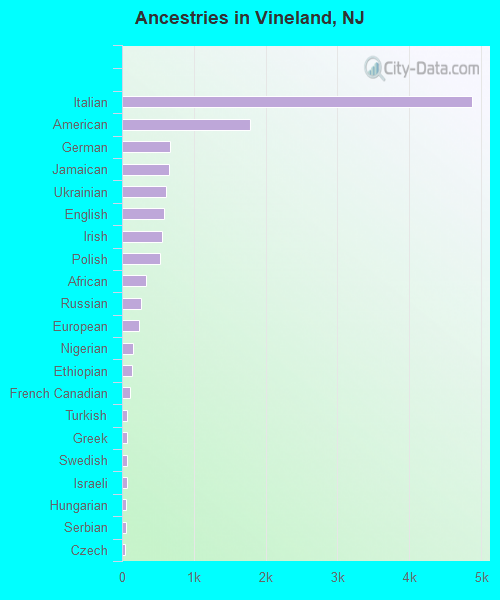
Ancestries in Vineland
4,867 14.6% Italian1,779 5.3% American663 2.0% German655 2.0% Jamaican608 1.8% Ukrainian586 1.8% English559 1.7% Irish527 1.6% Polish335 1.0% African268 0.8% Russian236 0.7% European154 0.5% Nigerian139 0.4% Ethiopian117 0.4% French Canadian72 0.2% Turkish69 0.2% Greek68 0.2% Swedish65 0.2% Israeli53 0.2% Hungarian51 0.2% Serbian45 0.1% Czech43 0.1% French43 0.1% Bermudan42 0.1% Welsh41 0.1% Scotch-Irish41 0.1% Trinidadian and Tobagonian35 0.1% British25 0.07% Arab22 0.07% Brazilian19 0.06% Danish18 0.05% Northern European17 0.05% Lithuanian16 0.05% Austrian13 0.04% Norwegian10 0.03% Eastern European9 0.03% Scottish8 0.02% Pennsylvania German8 0.02% Iranian5 0.01% Latvian
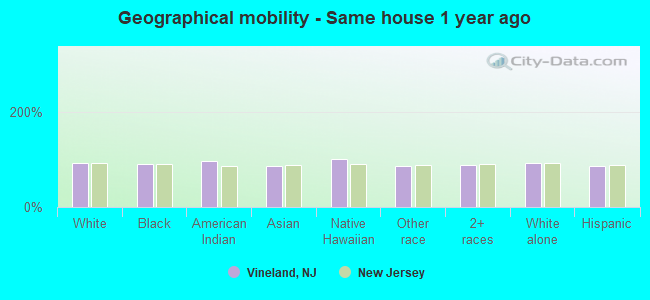
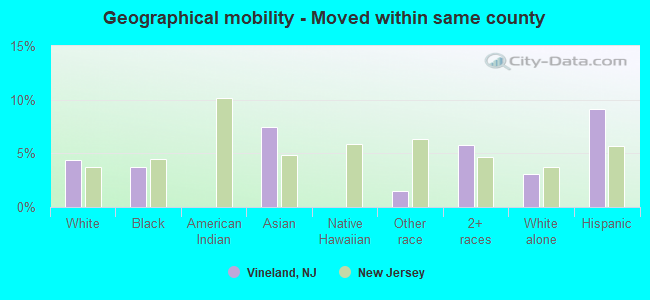
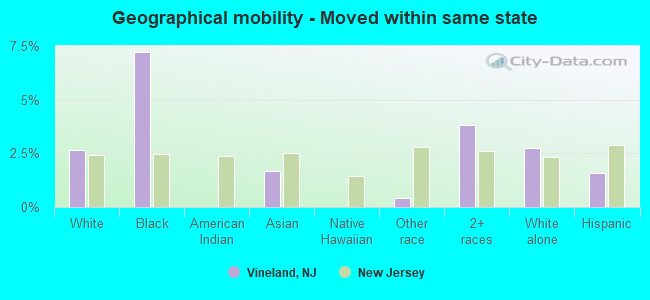
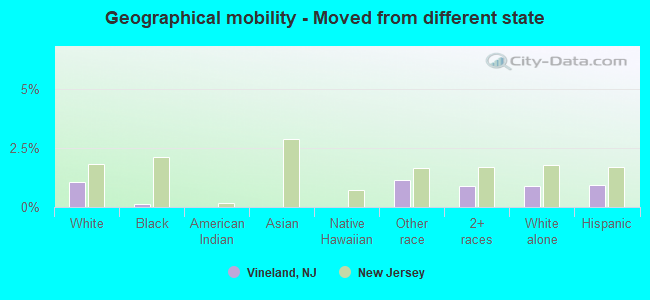
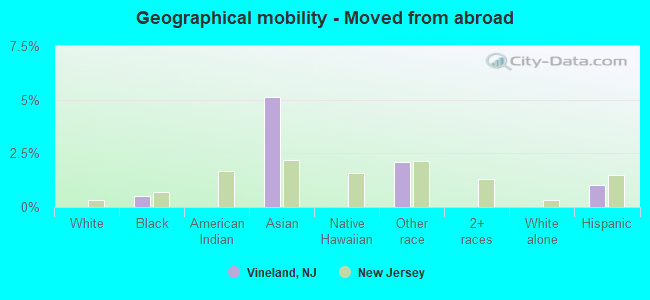
Geographical mobility in Vineland Same house 1 year ago 25,929 91.7% White (Caucasian)6,616 90.7% Black or African American601 96.6% American Indian / Alaska Native915 85.4% Asian23 100.0% Native Hawaiian / Pacific Islander11,263 85.8% Other race9,834 89.1% Two or more races21,618 93.1% White alone, not Hispanic / Latino22,398 85.1% Hispanic or LatinoMoved within same county 1,227 4.3% White / Caucasian275 3.8% Black or African American79 7.4% Asian193 1.5% Other race638 5.8% Two or more races716 3.1% White alone, not Hispanic / Latino2,397 9.1% Hispanic or LatinoMoved within same state 757 2.7% White / Caucasian528 7.2% Black or African American18 1.7% Asian54 0.4% Other race424 3.8% Two or more races638 2.7% White alone, not Hispanic / Latino416 1.6% Hispanic or LatinoMoved from different state 297 1.1% White / Caucasian8 0.1% Black or African American147 1.1% Other race98 0.9% Two or more races206 0.9% White alone, not Hispanic / Latino245 0.9% Hispanic or LatinoMoved from abroad 39 0.5% Black or African American55 5.1% Asian278 2.1% Other race274 1.0% Hispanic or Latino
Children Nativity (place of birth) in Vineland
Children under 6 years - Living with two parents Both parents native 2,353 100.0% NativeBoth parents foreign-born 226 100.0% NativeOne native, one foreign-born parent 262 100.0% NativeChildren under 6 years - Living with one parent Native parent 1,249 100.0% NativeForeign-born parent 239 86.0% Native39 14.0% Foreign-bornChildren 6 to 17 years - Living with two parents Both parents native 3,141 100.0% NativeBoth parents foreign-born 1,289 89.7% Native148 10.3% Foreign-bornOne native, one foreign-born parent 748 100.0% NativeChildren 6 to 17 years - Living with one parent Native parent 2,120 100.0% NativeForeign-born parent 779 62.3% Native472 37.7% Foreign-born
Grandparents responsible for own grandchildren in Vineland
Grandparents (30 to 59 years) White / Caucasian 107 26.5% Responsible for grandchildren297 73.5% Not responsible for grandchildrenBlack or African American 109 26.8% Responsible for grandchildren297 73.2% Not responsible for grandchildrenTwo or more races 34 100.0% Not responsible for grandchildrenWhite alone, not Hispanic / Latino 50 41.9% Responsible for grandchildren70 58.1% Not responsible for grandchildrenHispanic or Latino 113 21.5% Responsible for grandchildren413 78.5% Not responsible for grandchildrenGrandparents (60 years and over) White / Caucasian 54 14.6% Responsible for grandchildren315 85.4% Not responsible for grandchildrenBlack or African American 70 27.8% Responsible for grandchildren182 72.2% Not responsible for grandchildrenTwo or more races 69 36.2% Responsible for grandchildren123 63.8% Not responsible for grandchildrenWhite alone, not Hispanic / Latino 26 8.7% Responsible for grandchildren276 91.3% Not responsible for grandchildrenHispanic or Latino 58 15.8% Responsible for grandchildren308 84.2% Not responsible for grandchildren