Races in Virginia, Minnesota (MN) Detailed Stats
Data:
Races - White alone (%)
Races - White alone (% change since 2000)
Races - Black alone (%)
Races - Black alone (% change since 2000)
Races - American Indian alone (%)
Races - American Indian alone (% change since 2000)
Races - Asian alone (%)
Races - Asian alone (% change since 2000)
Races - Hispanic (%)
Races - Hispanic (% change since 2000)
Races - Native Hawaiian and Other Pacific Islander alone (%)
Races - Native Hawaiian and Other Pacific Islander alone (% change since 2000)
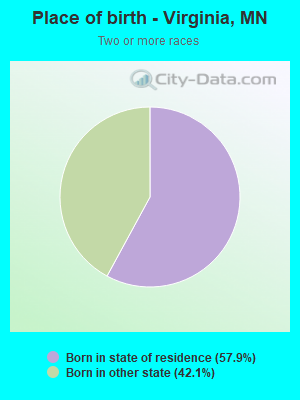
Races - Two or more races(%)
Races - Two or more races(% change since 2000)
Races - Other race alone (%)
Races - Other race alone (% change since 2000)
Racial diversity
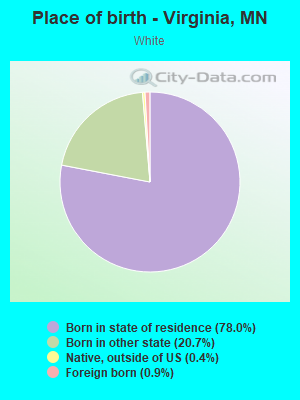
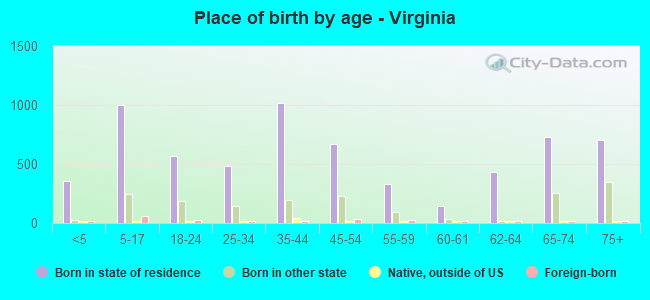
Place of birth - Born in state of residence (%)
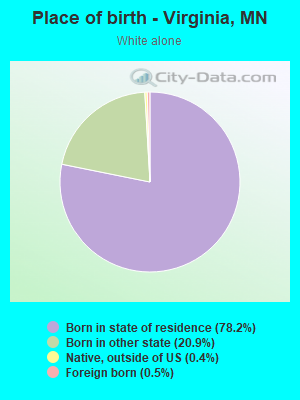
Place of birth - Born in state of residence (%) - White
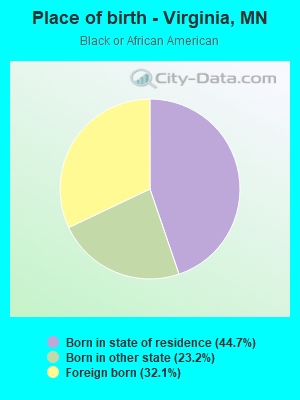
Place of birth - Born in state of residence (%) - Black or African American
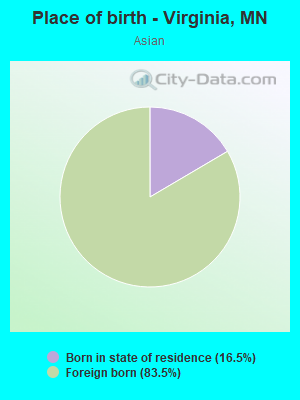
Place of birth - Born in state of residence (%) - Asian
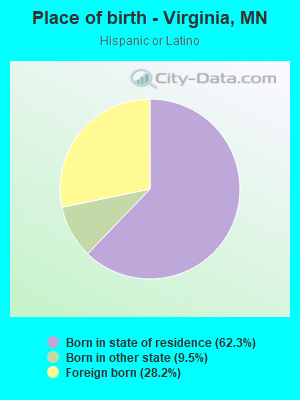
Place of birth - Born in state of residence (%) - Hispanic or Latino
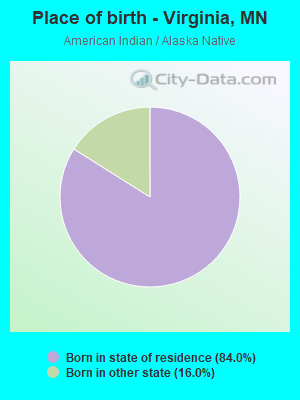
Place of birth - Born in state of residence (%) - American Indian and Alaska Native
Place of birth - Born in state of residence (%) - Multirace
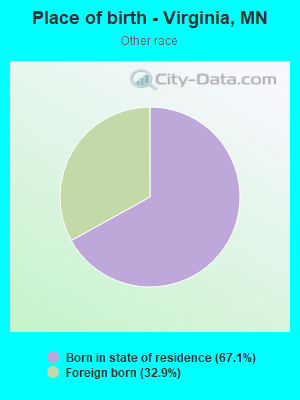
Place of birth - Born in state of residence (%) - Other Race
Place of birth - Born in other state (%)
Place of birth - Born in other state (%) - White
Place of birth - Born in other state (%) - Black or African American
Place of birth - Born in other state (%) - Asian
Place of birth - Born in other state (%) - Hispanic or Latino
Place of birth - Born in other state (%) - American Indian and Alaska Native
Place of birth - Born in other state (%) - Multirace
Place of birth - Born in other state (%) - Other Race
Place of birth - Native, outside of US (%)
Place of birth - Native, outside of US (%) - White
Place of birth - Native, outside of US (%) - Black or African American
Place of birth - Native, outside of US (%) - Asian
Place of birth - Native, outside of US (%) - Hispanic or Latino
Place of birth - Native, outside of US (%) - American Indian and Alaska Native
Place of birth - Native, outside of US (%) - Multirace
Place of birth - Native, outside of US (%) - Other Race
Place of birth - Foreign born (%)
Place of birth - Foreign born (%) - White
Place of birth - Foreign born (%) - Black or African American
Place of birth - Foreign born (%) - Asian
Place of birth - Foreign born (%) - Hispanic or Latino
Place of birth - Foreign born (%) - American Indian and Alaska Native
Place of birth - Foreign born (%) - Multirace
Place of birth - Foreign born (%) - Other Race
Residents speaking English at home (%)
Residents speaking English at home - Born in the United States (%)
Residents speaking English at home - Native, born elsewhere (%)
Residents speaking English at home - Foreign born (%)
Residents speaking Spanish at home (%)
Residents speaking Spanish at home - Born in the United States (%)
Residents speaking Spanish at home - Native, born elsewhere (%)
Residents speaking Spanish at home - Foreign born (%)
Residents speaking other language at home (%)
Residents speaking other language at home - Born in the United States (%)
Residents speaking other language at home - Native, born elsewhere (%)
Residents speaking other language at home - Foreign born (%)
Marital status - Never married (%)
Marital status - Now married (%)
Marital status - Separated (%)
Marital status - Widowed (%)
Marital status - Divorced (%)
Ancestries Reported - Arab (%)
Ancestries Reported - Czech (%)
Ancestries Reported - Danish (%)
Ancestries Reported - Dutch (%)
Ancestries Reported - English (%)
Ancestries Reported - French (%)
Ancestries Reported - French Canadian (%)
Ancestries Reported - German (%)
Ancestries Reported - Greek (%)
Ancestries Reported - Hungarian (%)
Ancestries Reported - Irish (%)
Ancestries Reported - Italian (%)
Ancestries Reported - Lithuanian (%)
Ancestries Reported - Norwegian (%)
Ancestries Reported - Polish (%)
Ancestries Reported - Portuguese (%)
Ancestries Reported - Russian (%)
Ancestries Reported - Scotch-Irish (%)
Ancestries Reported - Scottish (%)
Ancestries Reported - Slovak (%)
Ancestries Reported - Subsaharan African (%)
Ancestries Reported - Swedish (%)
Ancestries Reported - Swiss (%)
Ancestries Reported - Ukrainian (%)
Ancestries Reported - United States (%)
Ancestries Reported - Welsh (%)
Ancestries Reported - West Indian (%)
Ancestries Reported - Other (%)
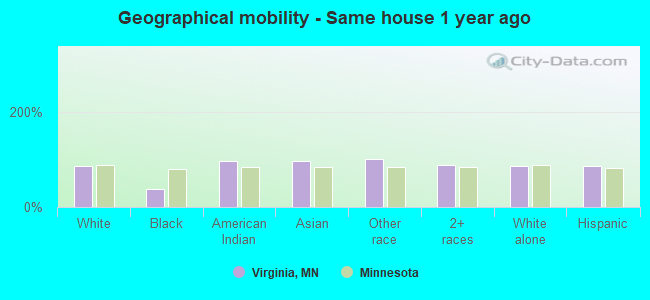
Geographical mobility - Same house 1 year ago (%)
Geographical mobility - Same house 1 year ago (%) - White
Geographical mobility - Same house 1 year ago (%) - Black or African American
Geographical mobility - Same house 1 year ago (%) - Asian
Geographical mobility - Same house 1 year ago (%) - Hispanic or Latino
Geographical mobility - Same house 1 year ago (%) - American Indian and Alaska Native
Geographical mobility - Same house 1 year ago (%) - Multirace
Geographical mobility - Same house 1 year ago (%) - Other Race
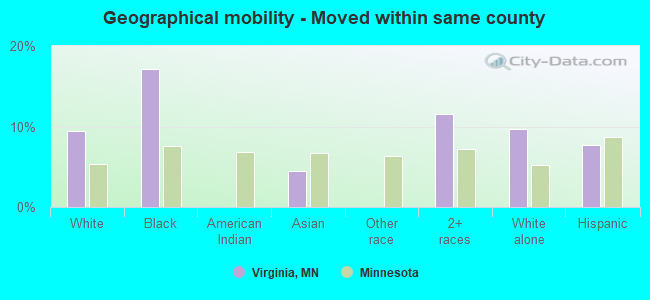
Geographical mobility - Moved within same county (%)
Geographical mobility - Moved within same county (%) - White
Geographical mobility - Moved within same county (%) - Black or African American
Geographical mobility - Moved within same county (%) - Asian
Geographical mobility - Moved within same county (%) - Hispanic or Latino
Geographical mobility - Moved within same county (%) - American Indian and Alaska Native
Geographical mobility - Moved within same county (%) - Multirace
Geographical mobility - Moved within same county (%) - Other Race
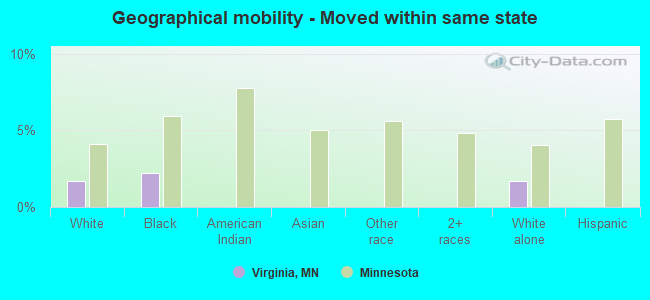
Geographical mobility - Moved from different county within same state (%)
Geographical mobility - Moved from different county within same state (%) - White
Geographical mobility - Moved from different county within same state (%) - Black or African American
Geographical mobility - Moved from different county within same state (%) - Asian
Geographical mobility - Moved from different county within same state (%) - Hispanic or Latino
Geographical mobility - Moved from different county within same state (%) - American Indian and Alaska Native
Geographical mobility - Moved from different county within same state (%) - Multirace
Geographical mobility - Moved from different county within same state (%) - Other Race
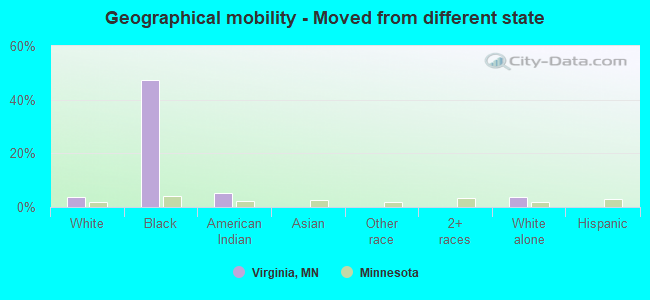
Geographical mobility - Moved from different state (%)
Geographical mobility - Moved from different state (%) - White
Geographical mobility - Moved from different state (%) - Black or African American
Geographical mobility - Moved from different state (%) - Asian
Geographical mobility - Moved from different state (%) - Hispanic or Latino
Geographical mobility - Moved from different state (%) - American Indian and Alaska Native
Geographical mobility - Moved from different state (%) - Multirace
Geographical mobility - Moved from different state (%) - Other Race
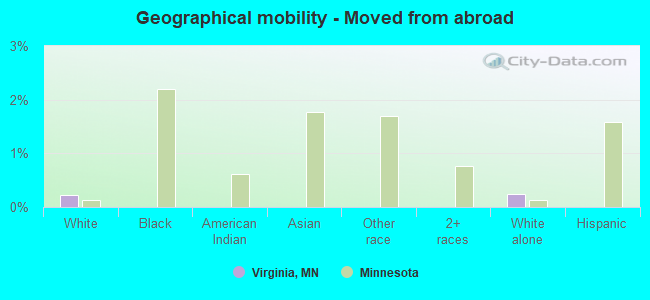
Geographical mobility - Moved from abroad (%)
Geographical mobility - Moved from abroad (%) - White
Geographical mobility - Moved from abroad (%) - Black or African American
Geographical mobility - Moved from abroad (%) - Asian
Geographical mobility - Moved from abroad (%) - Hispanic or Latino
Geographical mobility - Moved from abroad (%) - American Indian and Alaska Native
Geographical mobility - Moved from abroad (%) - Multirace
Geographical mobility - Moved from abroad (%) - Other Race
Place of birth for the foreign-born population - Ireland (%)
Place of birth for the foreign-born population - Denmark (%)
Place of birth for the foreign-born population - Norway (%)
Place of birth for the foreign-born population - Sweden (%)
Place of birth for the foreign-born population - United Kingdom (%)
Place of birth for the foreign-born population - England (%)
Place of birth for the foreign-born population - Scotland (%)
Place of birth for the foreign-born population - Other Northern Europe (%)
Place of birth for the foreign-born population - Austria (%)
Place of birth for the foreign-born population - Belgium (%)
Place of birth for the foreign-born population - France (%)
Place of birth for the foreign-born population - Germany (%)
Place of birth for the foreign-born population - Netherlands (%)
Place of birth for the foreign-born population - Switzerland (%)
Place of birth for the foreign-born population - Other Western Europe (%)
Place of birth for the foreign-born population - Greece (%)
Place of birth for the foreign-born population - Italy (%)
Place of birth for the foreign-born population - Portugal (%)
Place of birth for the foreign-born population - Spain (%)
Place of birth for the foreign-born population - Other Southern Europe (%)
Place of birth for the foreign-born population - Albania (%)
Place of birth for the foreign-born population - Belarus (%)
Place of birth for the foreign-born population - Bosnia and Herzegovina (%)
Place of birth for the foreign-born population - Bulgaria (%)
Place of birth for the foreign-born population - Croatia (%)
Place of birth for the foreign-born population - Czechoslovakia (%)
Place of birth for the foreign-born population - Hungary (%)
Place of birth for the foreign-born population - Latvia (%)
Place of birth for the foreign-born population - Lithuania (%)
Place of birth for the foreign-born population - North Macedonia (Macedonia) (%)
Place of birth for the foreign-born population - Moldova (%)
Place of birth for the foreign-born population - Poland (%)
Place of birth for the foreign-born population - Romania (%)
Place of birth for the foreign-born population - Russia (%)
Place of birth for the foreign-born population - Serbia (%)
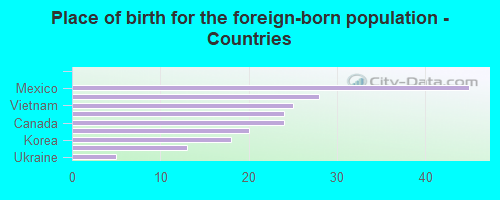
Place of birth for the foreign-born population - Ukraine (%)
Place of birth for the foreign-born population - Other Eastern Europe (%)
Place of birth for the foreign-born population - China (%)
Place of birth for the foreign-born population - Hong Kong (%)
Place of birth for the foreign-born population - Taiwan (%)
Place of birth for the foreign-born population - Japan (%)
Place of birth for the foreign-born population - Korea (%)
Place of birth for the foreign-born population - Other Eastern Asia (%)
Place of birth for the foreign-born population - Afghanistan (%)
Place of birth for the foreign-born population - Bangladesh (%)
Place of birth for the foreign-born population - India (%)
Place of birth for the foreign-born population - Iran (%)
Place of birth for the foreign-born population - Kazakhstan (%)
Place of birth for the foreign-born population - Nepal (%)
Place of birth for the foreign-born population - Pakistan (%)
Place of birth for the foreign-born population - Sri Lanka (%)
Place of birth for the foreign-born population - Uzbekistan (%)
Place of birth for the foreign-born population - Other South Central Asia (%)
Place of birth for the foreign-born population - Burma (%)
Place of birth for the foreign-born population - Cambodia (%)
Place of birth for the foreign-born population - Indonesia (%)
Place of birth for the foreign-born population - Laos (%)
Place of birth for the foreign-born population - Malaysia (%)
Place of birth for the foreign-born population - Philippines (%)
Place of birth for the foreign-born population - Singapore (%)
Place of birth for the foreign-born population - Thailand (%)
Place of birth for the foreign-born population - Vietnam (%)
Place of birth for the foreign-born population - Other South Eastern Asia (%)
Place of birth for the foreign-born population - Armenia (%)
Place of birth for the foreign-born population - Iraq (%)
Place of birth for the foreign-born population - Israel (%)
Place of birth for the foreign-born population - Jordan (%)
Place of birth for the foreign-born population - Kuwait (%)
Place of birth for the foreign-born population - Lebanon (%)
Place of birth for the foreign-born population - Saudi Arabia (%)
Place of birth for the foreign-born population - Syria (%)
Place of birth for the foreign-born population - Turkey (%)
Place of birth for the foreign-born population - Yemen (%)
Place of birth for the foreign-born population - Other Western Asia (%)
Place of birth for the foreign-born population - Eritrea (%)
Place of birth for the foreign-born population - Ethiopia (%)
Place of birth for the foreign-born population - Kenya (%)
Place of birth for the foreign-born population - Somalia (%)
Place of birth for the foreign-born population - Uganda (%)
Place of birth for the foreign-born population - Zimbabwe (%)
Place of birth for the foreign-born population - Other Eastern Africa (%)
Place of birth for the foreign-born population - Cameroon (%)
Place of birth for the foreign-born population - Congo (%)
Place of birth for the foreign-born population - Democratic Republic of Congo (Zaire) (%)
Place of birth for the foreign-born population - Other Middle Africa (%)
Place of birth for the foreign-born population - Egypt (%)
Place of birth for the foreign-born population - Morocco (%)
Place of birth for the foreign-born population - Sudan (%)
Place of birth for the foreign-born population - Other Northern Africa (%)
Place of birth for the foreign-born population - South Africa (%)
Place of birth for the foreign-born population - Other Southern Africa (%)
Place of birth for the foreign-born population - Cabo Verde (%)
Place of birth for the foreign-born population - Ghana (%)
Place of birth for the foreign-born population - Liberia (%)
Place of birth for the foreign-born population - Nigeria (%)
Place of birth for the foreign-born population - Senegal (%)
Place of birth for the foreign-born population - Sierra Leone (%)
Place of birth for the foreign-born population - Other Western Africa (%)
Place of birth for the foreign-born population - Australia (%)
Place of birth for the foreign-born population - New Zealand (%)
Place of birth for the foreign-born population - Fiji (%)
Place of birth for the foreign-born population - Micronesia (%)
Place of birth for the foreign-born population - Bahamas (%)
Place of birth for the foreign-born population - Barbados (%)
Place of birth for the foreign-born population - Cuba (%)
Place of birth for the foreign-born population - Dominica (%)
Place of birth for the foreign-born population - Dominican Republic (%)
Place of birth for the foreign-born population - Grenada (%)
Place of birth for the foreign-born population - Haiti (%)
Place of birth for the foreign-born population - Jamaica (%)
Place of birth for the foreign-born population - St. Vincent and the Grenadines (%)
Place of birth for the foreign-born population - Trinidad and Tobago (%)
Place of birth for the foreign-born population - West Indies (%)
Place of birth for the foreign-born population - Other Caribbean (%)
Place of birth for the foreign-born population - Belize (%)
Place of birth for the foreign-born population - Costa Rica (%)
Place of birth for the foreign-born population - El Salvador (%)
Place of birth for the foreign-born population - Guatemala (%)
Place of birth for the foreign-born population - Honduras (%)
Place of birth for the foreign-born population - Mexico (%)
Place of birth for the foreign-born population - Nicaragua (%)
Place of birth for the foreign-born population - Panama (%)
Place of birth for the foreign-born population - Other Central America (%)
Place of birth for the foreign-born population - Argentina (%)
Place of birth for the foreign-born population - Bolivia (%)
Place of birth for the foreign-born population - Brazil (%)
Place of birth for the foreign-born population - Chile (%)
Place of birth for the foreign-born population - Colombia (%)
Place of birth for the foreign-born population - Ecuador (%)
Place of birth for the foreign-born population - Guyana (%)
Place of birth for the foreign-born population - Peru (%)
Place of birth for the foreign-born population - Uruguay (%)
Place of birth for the foreign-born population - Venezuela (%)
Place of birth for the foreign-born population - Other South America (%)
Place of birth for the foreign-born population - Canada (%)
Place of birth for the foreign-born population - Other Northern America (%)
Place of birth for the foreign-born population - Other (%)
Latest news about races in Virginia, MN collected exclusively by city-data.com from local newspapers, TV, and radio stations
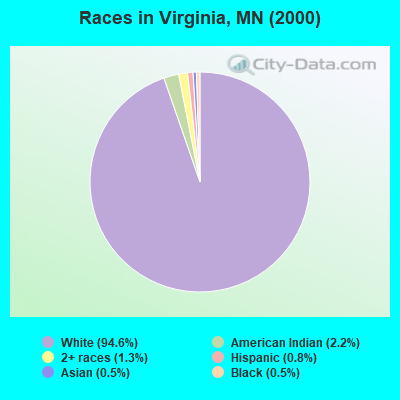
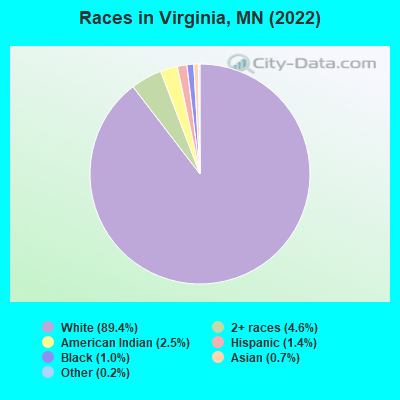
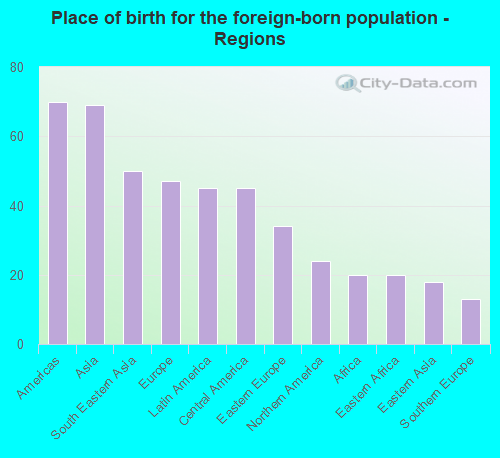
According to 2022 data, the most numerous races in Virginia, MN are White alone (7,499 residents), Black alone (83 residents), and Hispanic (120 residents). 96.4% of Virginia residents speak English at home. 2.5% of Virginia, MN residents are foreign-born (0.8% born in Asia, 0.5% born in Europe, 0.5% born in Latin America, 0.3% born in North America), which is 222.7% less than the foreign-born rate of 8.0% across the entire state of Minnesota.
Race distribution in Virginia
2000 2022
4,337,143 88.2% White alone 168,813 3.4% Black alone 143,382 2.9% Hispanic 141,083 2.9% Asian alone 70,304 1.4% Two or more races 52,009 1.1% American Indian alone 5,031 0.1% Other race alone 1,714 0.03% Native Hawaiian and Other
4,356,347 76.2% White alone 395,179 6.9% Black alone 333,830 5.8% Hispanic 294,800 5.2% Asian alone 259,649 4.5% Two or more races 42,125 0.7% American Indian alone 32,976 0.6% Other race alone 2,278 0.04% Native Hawaiian and Other
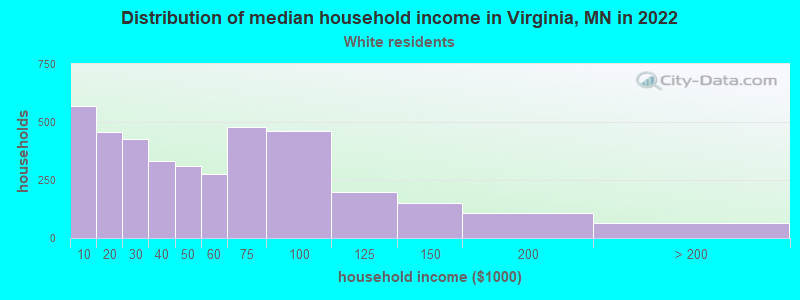
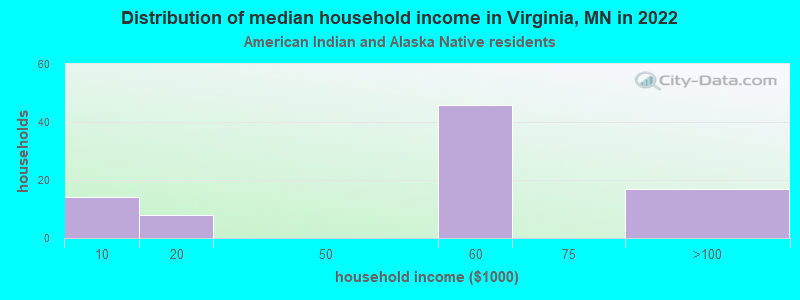
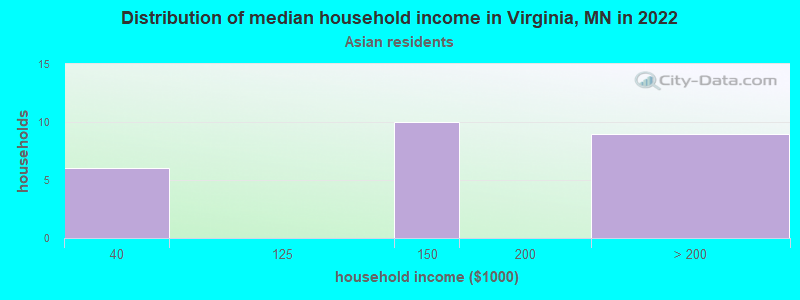
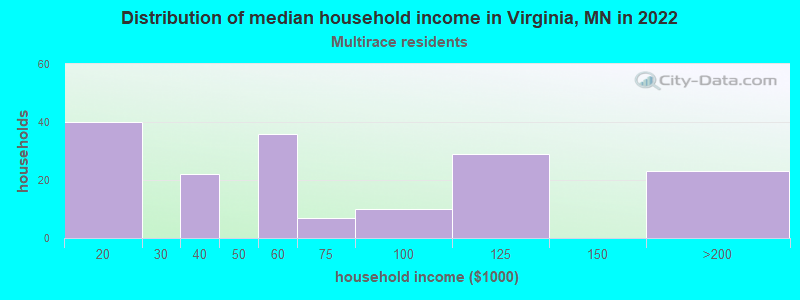
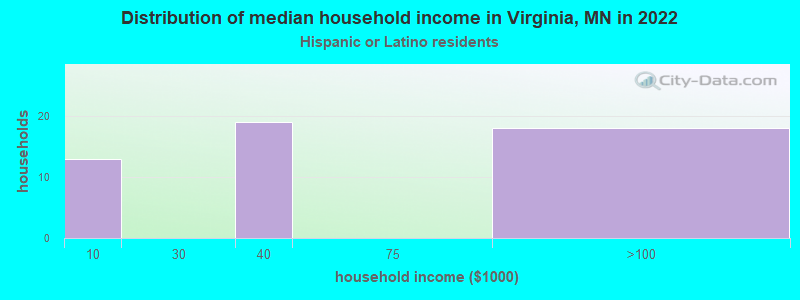
Income and house value in Virginia Median household income in 2022 $46,480 White non-Hispanic householders$33,427 American Indian and Alaska Native householders$58,830 Two or more races householdersMedian 2022 house value $124,806 White Non-Hispanic householders$161,786 American Indian or Alaska Native householders
Median age by race in Virginia
43.8 Median age for White residents41.3 47.0 15.0 Median age for Black or African American residents15.1 -623,828,647.3 35.9 Median age for American Indian / Alaska Native residents38.9 30.7 68.8 Median age for Asian residents66.7 26.5 -744,336,568.8 Median age for Native Hawaiian / Pacific Islander residents-856,799,036.4 -534,959,349.1 35.0 Median age for Other race residents-518,518,518.0 -848,484,847.6 40.1 Median age for Two or more races residents28.7 65.8 43.9 Median age for White alone residents41.4 47.2 39.2 Median age for Hispanic or Latino residents41.5 40.4
Owner/renter occupied households by race in Virginia
House owners and renters - White residents 2,094 56.2% Owner occupied1,633 43.8% Renter occupiedHouse owners and renters - American Indian / Alaska Native residents 138 100.0% Renter occupiedHouse owners and renters - Asian residents 37 85.1% Owner occupied6 14.9% Renter occupiedHouse owners and renters - Other race residents 4 100.0% Owner occupiedHouse owners and renters - Two or more races residents 91 43.7% Owner occupied117 56.3% Renter occupiedHouse owners and renters - White alone residents 2,097 57.0% Owner occupied1,585 43.0% Renter occupiedHouse owners and renters - Hispanic or Latino residents 71 100.0% Renter occupied
Language usage in Virginia
English speakers - Total 96.4% of residents of Virginia speak English at home.
1.4% of residents speak Spanish at home 73 65.8% Speak English very well38 34.2% Speak English less than very well1.9% of residents speak other language at home 111 74.5% Speak English very well38 25.5% Speak English less than very well
English speakers - Born in the United States 98.7% of residents of Virginia speak English at home.
0.5% of residents speak Spanish at home 9 100.0% Speak English very well0.8% of residents speak other language at home 13 100.0% Speak English very well
English speakers - Native, born elsewhere 0.0% of residents of Virginia speak English at home.
48.4% of residents speak Spanish at home 15 100.0% Speak English very well
English speakers - Foreign-born 69.9% of residents of Virginia speak English at home.
20.9% of residents speak Spanish at home 34 100.0% Speak English less than very well21.5% of residents speak other language at home 8 22.9% Speak English very well27 77.1% Speak English less than very well
White (Caucasian) - Speak only English Native:
97.0% (6,965)Foreign-born:
85.1% (57)
White (Caucasian) - Speak another language Native:
2.7% (194)Foreign-born:
43.4% (29)
Black or African American - Speak only English Native:
97.2% (39)Foreign-born:
49.9% (20)
Asian - Speak another language Native:
100.0% (6)Foreign-born:
42.6% (30)
Other race - Speak only English Native:
100.0% (8)Foreign-born:
100.0% (4)
White alone - Speak only English Native:
97.0% (6,912)Foreign-born:
100.0% (36)
Hispanic or Latino - Speak another language Native:
3.0% (2)Foreign-born:
68.3% (21)
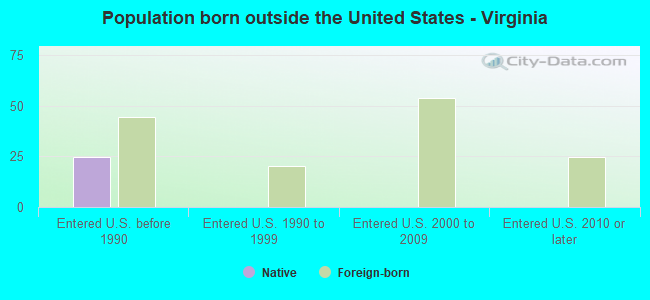
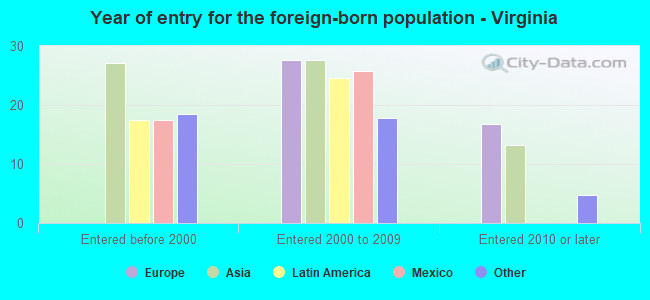
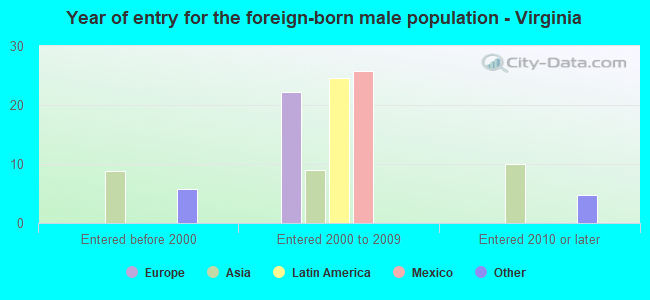
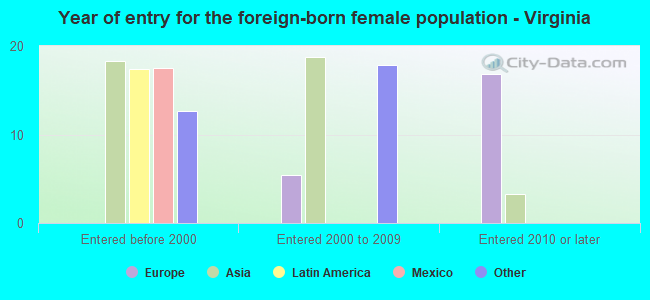
Foreign-born residents in Virginia 208 residents are foreign born (0.8% Asia , 0.5% Europe , 0.5% Latin America , 0.3% North America ).
This city:
2.5%Minnesota:
8.5%
Marital status for residents in Virginia Marital status - White (Caucasian) population 15 years and over
Males 37.6% Never married39.6% Now married2.2% Separated3.8% Widowed16.8% DivorcedFemales 26.8% Never married40.7% Now married1.0% Separated10.9% Widowed20.7% DivorcedWomen who gave birth in the past 12 months Now married:
39.8% (41)Unmarried:
60.2% (62)
Women who did not give birth in the past 12 months Now married:
41.2% (572)Unmarried:
58.8% (816)
Marital status - American Indian / Alaska Native population 15 years and over
Males 32.6% Never married0.0% Now married0.0% Separated0.0% Widowed67.4% DivorcedFemales 56.4% Never married17.9% Now married17.9% Separated7.7% Widowed0.0% DivorcedWomen who did not give birth in the past 12 months Now married:
35.9% (17)Unmarried:
64.1% (31)
Marital status - Asian population 15 years and over
Males 0.0% Never married100.0% Now married0.0% Separated0.0% Widowed0.0% DivorcedFemales 48.6% Never married35.1% Now married16.2% Separated0.0% Widowed0.0% DivorcedWomen who did not give birth in the past 12 months Now married:
25.0% (6)Unmarried:
75.0% (19)
Marital status - Other race population 15 years and over
Males 0.0% Never married100.0% Now married0.0% Separated0.0% Widowed0.0% DivorcedFemales 0.0% Never married100.0% Now married0.0% Separated0.0% Widowed0.0% DivorcedWomen who did not give birth in the past 12 months Now married:
100.0% (4)Unmarried:
0.0% (0)
Marital status - Two or more races population 15 years and over
Males 70.4% Never married10.1% Now married0.0% Separated0.0% Widowed19.5% DivorcedFemales 38.6% Never married28.3% Now married0.0% Separated8.7% Widowed24.4% DivorcedWomen who did not give birth in the past 12 months Now married:
10.6% (5)Unmarried:
89.4% (45)
Marital status - White alone, not Hispanic / Latino population 15 years and over
Males 37.8% Never married39.9% Now married1.3% Separated3.9% Widowed17.0% DivorcedFemales 25.9% Never married41.1% Now married1.0% Separated11.1% Widowed20.9% DivorcedWomen who gave birth in the past 12 months Now married:
39.8% (41)Unmarried:
60.2% (62)
Women who did not give birth in the past 12 months Now married:
41.8% (573)Unmarried:
58.2% (799)
Marital status - Hispanic or Latino population 15 years and over
Males 7.5% Never married0.0% Now married67.5% Separated0.0% Widowed25.0% DivorcedFemales 100.0% Never married0.0% Now married0.0% Separated0.0% Widowed0.0% DivorcedWomen who did not give birth in the past 12 months Now married:
0.0% (0)Unmarried:
100.0% (18)
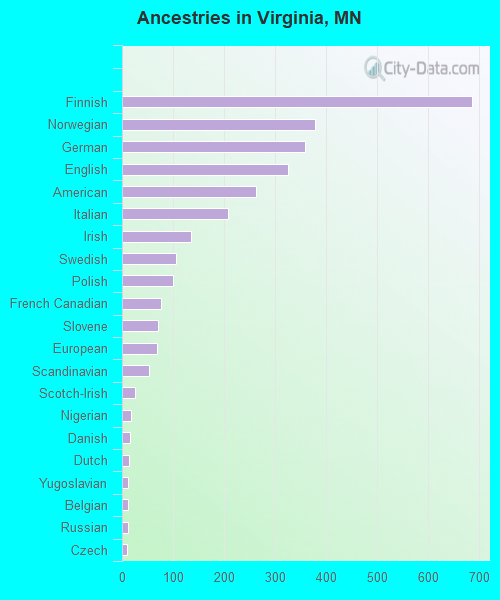
Ancestries in Virginia
685 20.4% Finnish378 11.2% Norwegian359 10.7% German326 9.7% English263 7.8% American207 6.2% Italian135 4.0% Irish105 3.1% Swedish99 2.9% Polish76 2.3% French Canadian71 2.1% Slovene69 2.1% European53 1.6% Scandinavian25 0.7% Scotch-Irish18 0.5% Nigerian15 0.4% Danish13 0.4% Dutch12 0.4% Yugoslavian11 0.3% Belgian11 0.3% Russian9 0.3% Czech6 0.2% Albanian6 0.2% Ukrainian5 0.1% Welsh4 0.1% Slavic3 0.09% French
Children Nativity (place of birth) in Virginia
Children under 6 years - Living with two parents Both parents native 284 100.0% NativeChildren under 6 years - Living with one parent Native parent 161 100.0% NativeChildren 6 to 17 years - Living with two parents Both parents native 595 99.6% Native2 0.4% Foreign-bornOne native, one foreign-born parent 15 28.9% Native37 71.1% Foreign-bornChildren 6 to 17 years - Living with one parent Native parent 465 100.0% NativeForeign-born parent 12 50.4% Native12 49.6% Foreign-born
Grandparents responsible for own grandchildren in Virginia
Grandparents (30 to 59 years) White / Caucasian 15 100.0% Responsible for grandchildrenWhite alone, not Hispanic / Latino 16 100.0% Responsible for grandchildren
Grandparents (60 years and over)