Races in Wagoner, Oklahoma (OK) Detailed Stats
Data:
Races - White alone (%)
Races - White alone (% change since 2000)
Races - Black alone (%)
Races - Black alone (% change since 2000)
Races - American Indian alone (%)
Races - American Indian alone (% change since 2000)
Races - Asian alone (%)
Races - Asian alone (% change since 2000)
Races - Hispanic (%)
Races - Hispanic (% change since 2000)
Races - Native Hawaiian and Other Pacific Islander alone (%)
Races - Native Hawaiian and Other Pacific Islander alone (% change since 2000)
Races - Two or more races(%)
Races - Two or more races(% change since 2000)
Races - Other race alone (%)
Races - Other race alone (% change since 2000)
Racial diversity
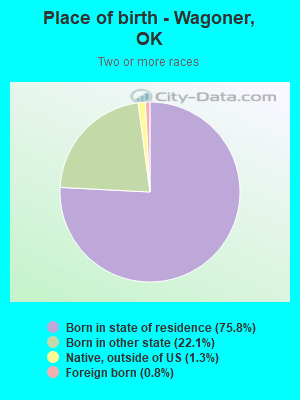
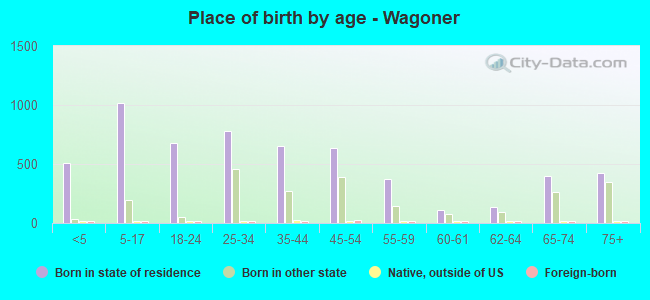
Place of birth - Born in state of residence (%)
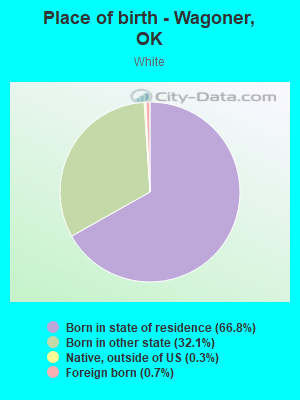
Place of birth - Born in state of residence (%) - White
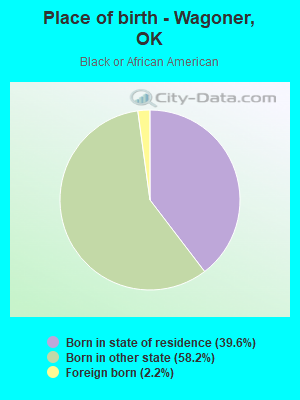
Place of birth - Born in state of residence (%) - Black or African American
Place of birth - Born in state of residence (%) - Asian
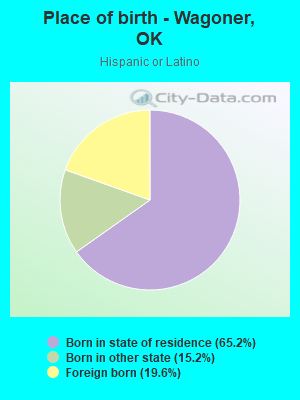
Place of birth - Born in state of residence (%) - Hispanic or Latino
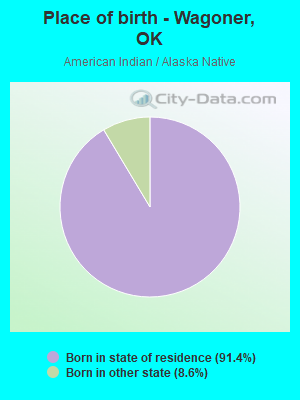
Place of birth - Born in state of residence (%) - American Indian and Alaska Native
Place of birth - Born in state of residence (%) - Multirace
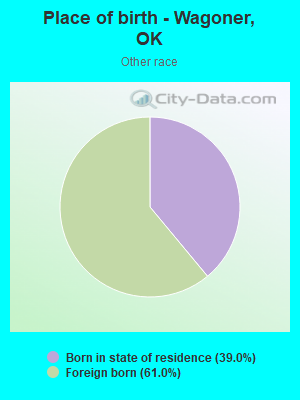
Place of birth - Born in state of residence (%) - Other Race
Place of birth - Born in other state (%)
Place of birth - Born in other state (%) - White
Place of birth - Born in other state (%) - Black or African American
Place of birth - Born in other state (%) - Asian
Place of birth - Born in other state (%) - Hispanic or Latino
Place of birth - Born in other state (%) - American Indian and Alaska Native
Place of birth - Born in other state (%) - Multirace
Place of birth - Born in other state (%) - Other Race
Place of birth - Native, outside of US (%)
Place of birth - Native, outside of US (%) - White
Place of birth - Native, outside of US (%) - Black or African American
Place of birth - Native, outside of US (%) - Asian
Place of birth - Native, outside of US (%) - Hispanic or Latino
Place of birth - Native, outside of US (%) - American Indian and Alaska Native
Place of birth - Native, outside of US (%) - Multirace
Place of birth - Native, outside of US (%) - Other Race
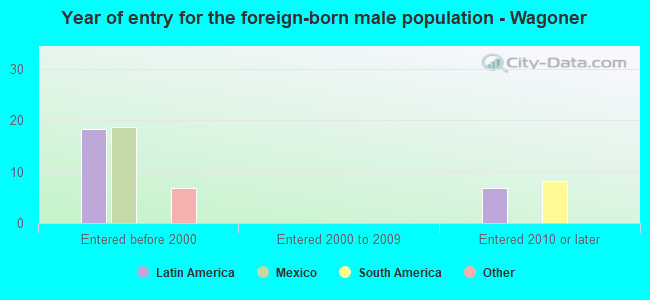
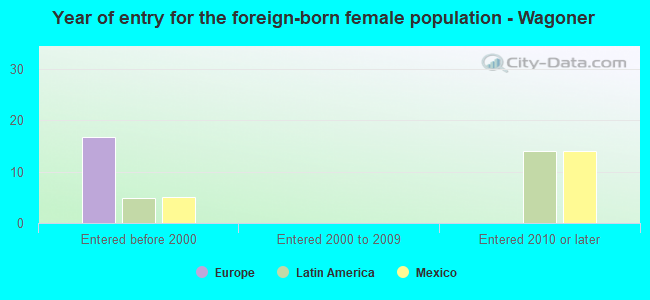
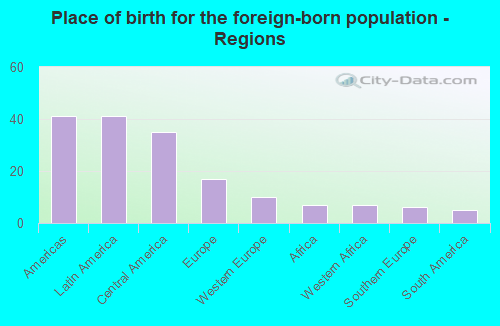
Place of birth - Foreign born (%)
Place of birth - Foreign born (%) - White
Place of birth - Foreign born (%) - Black or African American
Place of birth - Foreign born (%) - Asian
Place of birth - Foreign born (%) - Hispanic or Latino
Place of birth - Foreign born (%) - American Indian and Alaska Native
Place of birth - Foreign born (%) - Multirace
Place of birth - Foreign born (%) - Other Race
Residents speaking English at home (%)
Residents speaking English at home - Born in the United States (%)
Residents speaking English at home - Native, born elsewhere (%)
Residents speaking English at home - Foreign born (%)
Residents speaking Spanish at home (%)
Residents speaking Spanish at home - Born in the United States (%)
Residents speaking Spanish at home - Native, born elsewhere (%)
Residents speaking Spanish at home - Foreign born (%)
Residents speaking other language at home (%)
Residents speaking other language at home - Born in the United States (%)
Residents speaking other language at home - Native, born elsewhere (%)
Residents speaking other language at home - Foreign born (%)
Marital status - Never married (%)
Marital status - Now married (%)
Marital status - Separated (%)
Marital status - Widowed (%)
Marital status - Divorced (%)
Ancestries Reported - Arab (%)
Ancestries Reported - Czech (%)
Ancestries Reported - Danish (%)
Ancestries Reported - Dutch (%)
Ancestries Reported - English (%)
Ancestries Reported - French (%)
Ancestries Reported - French Canadian (%)
Ancestries Reported - German (%)
Ancestries Reported - Greek (%)
Ancestries Reported - Hungarian (%)
Ancestries Reported - Irish (%)
Ancestries Reported - Italian (%)
Ancestries Reported - Lithuanian (%)
Ancestries Reported - Norwegian (%)
Ancestries Reported - Polish (%)
Ancestries Reported - Portuguese (%)
Ancestries Reported - Russian (%)
Ancestries Reported - Scotch-Irish (%)
Ancestries Reported - Scottish (%)
Ancestries Reported - Slovak (%)
Ancestries Reported - Subsaharan African (%)
Ancestries Reported - Swedish (%)
Ancestries Reported - Swiss (%)
Ancestries Reported - Ukrainian (%)
Ancestries Reported - United States (%)
Ancestries Reported - Welsh (%)
Ancestries Reported - West Indian (%)
Ancestries Reported - Other (%)
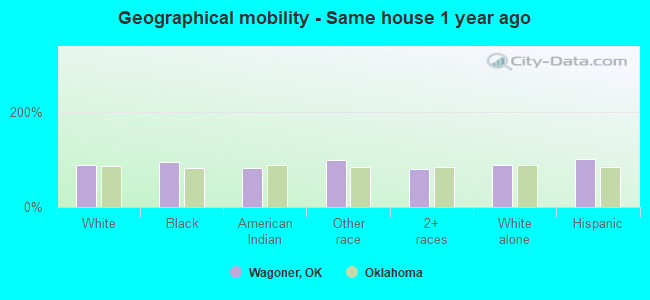
Geographical mobility - Same house 1 year ago (%)
Geographical mobility - Same house 1 year ago (%) - White
Geographical mobility - Same house 1 year ago (%) - Black or African American
Geographical mobility - Same house 1 year ago (%) - Asian
Geographical mobility - Same house 1 year ago (%) - Hispanic or Latino
Geographical mobility - Same house 1 year ago (%) - American Indian and Alaska Native
Geographical mobility - Same house 1 year ago (%) - Multirace
Geographical mobility - Same house 1 year ago (%) - Other Race
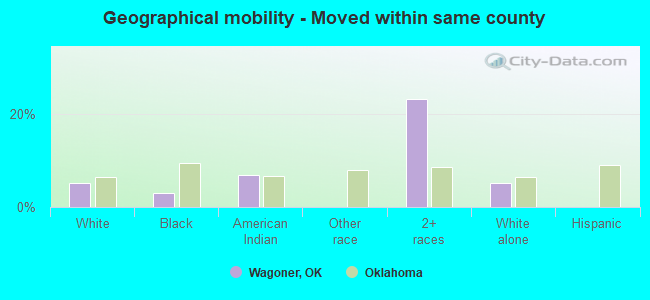
Geographical mobility - Moved within same county (%)
Geographical mobility - Moved within same county (%) - White
Geographical mobility - Moved within same county (%) - Black or African American
Geographical mobility - Moved within same county (%) - Asian
Geographical mobility - Moved within same county (%) - Hispanic or Latino
Geographical mobility - Moved within same county (%) - American Indian and Alaska Native
Geographical mobility - Moved within same county (%) - Multirace
Geographical mobility - Moved within same county (%) - Other Race
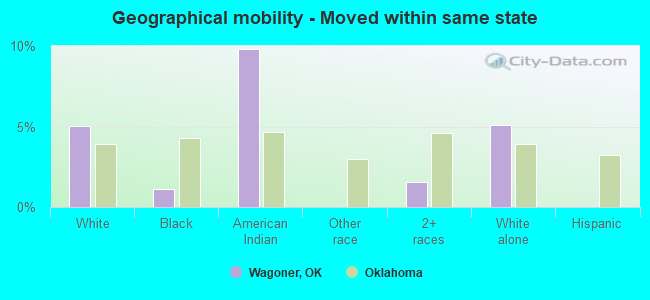
Geographical mobility - Moved from different county within same state (%)
Geographical mobility - Moved from different county within same state (%) - White
Geographical mobility - Moved from different county within same state (%) - Black or African American
Geographical mobility - Moved from different county within same state (%) - Asian
Geographical mobility - Moved from different county within same state (%) - Hispanic or Latino
Geographical mobility - Moved from different county within same state (%) - American Indian and Alaska Native
Geographical mobility - Moved from different county within same state (%) - Multirace
Geographical mobility - Moved from different county within same state (%) - Other Race
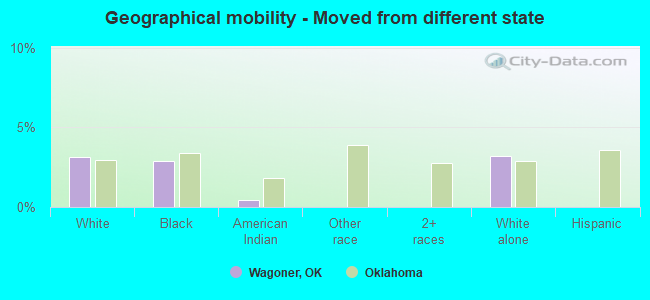
Geographical mobility - Moved from different state (%)
Geographical mobility - Moved from different state (%) - White
Geographical mobility - Moved from different state (%) - Black or African American
Geographical mobility - Moved from different state (%) - Asian
Geographical mobility - Moved from different state (%) - Hispanic or Latino
Geographical mobility - Moved from different state (%) - American Indian and Alaska Native
Geographical mobility - Moved from different state (%) - Multirace
Geographical mobility - Moved from different state (%) - Other Race
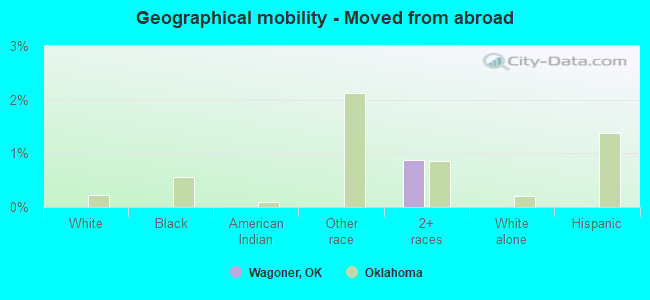
Geographical mobility - Moved from abroad (%)
Geographical mobility - Moved from abroad (%) - White
Geographical mobility - Moved from abroad (%) - Black or African American
Geographical mobility - Moved from abroad (%) - Asian
Geographical mobility - Moved from abroad (%) - Hispanic or Latino
Geographical mobility - Moved from abroad (%) - American Indian and Alaska Native
Geographical mobility - Moved from abroad (%) - Multirace
Geographical mobility - Moved from abroad (%) - Other Race
Place of birth for the foreign-born population - Ireland (%)
Place of birth for the foreign-born population - Denmark (%)
Place of birth for the foreign-born population - Norway (%)
Place of birth for the foreign-born population - Sweden (%)
Place of birth for the foreign-born population - United Kingdom (%)
Place of birth for the foreign-born population - England (%)
Place of birth for the foreign-born population - Scotland (%)
Place of birth for the foreign-born population - Other Northern Europe (%)
Place of birth for the foreign-born population - Austria (%)
Place of birth for the foreign-born population - Belgium (%)
Place of birth for the foreign-born population - France (%)
Place of birth for the foreign-born population - Germany (%)
Place of birth for the foreign-born population - Netherlands (%)
Place of birth for the foreign-born population - Switzerland (%)
Place of birth for the foreign-born population - Other Western Europe (%)
Place of birth for the foreign-born population - Greece (%)
Place of birth for the foreign-born population - Italy (%)
Place of birth for the foreign-born population - Portugal (%)
Place of birth for the foreign-born population - Spain (%)
Place of birth for the foreign-born population - Other Southern Europe (%)
Place of birth for the foreign-born population - Albania (%)
Place of birth for the foreign-born population - Belarus (%)
Place of birth for the foreign-born population - Bosnia and Herzegovina (%)
Place of birth for the foreign-born population - Bulgaria (%)
Place of birth for the foreign-born population - Croatia (%)
Place of birth for the foreign-born population - Czechoslovakia (%)
Place of birth for the foreign-born population - Hungary (%)
Place of birth for the foreign-born population - Latvia (%)
Place of birth for the foreign-born population - Lithuania (%)
Place of birth for the foreign-born population - North Macedonia (Macedonia) (%)
Place of birth for the foreign-born population - Moldova (%)
Place of birth for the foreign-born population - Poland (%)
Place of birth for the foreign-born population - Romania (%)
Place of birth for the foreign-born population - Russia (%)
Place of birth for the foreign-born population - Serbia (%)
Place of birth for the foreign-born population - Ukraine (%)
Place of birth for the foreign-born population - Other Eastern Europe (%)
Place of birth for the foreign-born population - China (%)
Place of birth for the foreign-born population - Hong Kong (%)
Place of birth for the foreign-born population - Taiwan (%)
Place of birth for the foreign-born population - Japan (%)
Place of birth for the foreign-born population - Korea (%)
Place of birth for the foreign-born population - Other Eastern Asia (%)
Place of birth for the foreign-born population - Afghanistan (%)
Place of birth for the foreign-born population - Bangladesh (%)
Place of birth for the foreign-born population - India (%)
Place of birth for the foreign-born population - Iran (%)
Place of birth for the foreign-born population - Kazakhstan (%)
Place of birth for the foreign-born population - Nepal (%)
Place of birth for the foreign-born population - Pakistan (%)
Place of birth for the foreign-born population - Sri Lanka (%)
Place of birth for the foreign-born population - Uzbekistan (%)
Place of birth for the foreign-born population - Other South Central Asia (%)
Place of birth for the foreign-born population - Burma (%)
Place of birth for the foreign-born population - Cambodia (%)
Place of birth for the foreign-born population - Indonesia (%)
Place of birth for the foreign-born population - Laos (%)
Place of birth for the foreign-born population - Malaysia (%)
Place of birth for the foreign-born population - Philippines (%)
Place of birth for the foreign-born population - Singapore (%)
Place of birth for the foreign-born population - Thailand (%)
Place of birth for the foreign-born population - Vietnam (%)
Place of birth for the foreign-born population - Other South Eastern Asia (%)
Place of birth for the foreign-born population - Armenia (%)
Place of birth for the foreign-born population - Iraq (%)
Place of birth for the foreign-born population - Israel (%)
Place of birth for the foreign-born population - Jordan (%)
Place of birth for the foreign-born population - Kuwait (%)
Place of birth for the foreign-born population - Lebanon (%)
Place of birth for the foreign-born population - Saudi Arabia (%)
Place of birth for the foreign-born population - Syria (%)
Place of birth for the foreign-born population - Turkey (%)
Place of birth for the foreign-born population - Yemen (%)
Place of birth for the foreign-born population - Other Western Asia (%)
Place of birth for the foreign-born population - Eritrea (%)
Place of birth for the foreign-born population - Ethiopia (%)
Place of birth for the foreign-born population - Kenya (%)
Place of birth for the foreign-born population - Somalia (%)
Place of birth for the foreign-born population - Uganda (%)
Place of birth for the foreign-born population - Zimbabwe (%)
Place of birth for the foreign-born population - Other Eastern Africa (%)
Place of birth for the foreign-born population - Cameroon (%)
Place of birth for the foreign-born population - Congo (%)
Place of birth for the foreign-born population - Democratic Republic of Congo (Zaire) (%)
Place of birth for the foreign-born population - Other Middle Africa (%)
Place of birth for the foreign-born population - Egypt (%)
Place of birth for the foreign-born population - Morocco (%)
Place of birth for the foreign-born population - Sudan (%)
Place of birth for the foreign-born population - Other Northern Africa (%)
Place of birth for the foreign-born population - South Africa (%)
Place of birth for the foreign-born population - Other Southern Africa (%)
Place of birth for the foreign-born population - Cabo Verde (%)
Place of birth for the foreign-born population - Ghana (%)
Place of birth for the foreign-born population - Liberia (%)
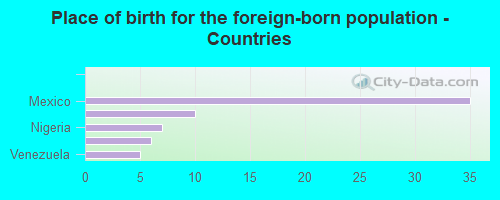
Place of birth for the foreign-born population - Nigeria (%)
Place of birth for the foreign-born population - Senegal (%)
Place of birth for the foreign-born population - Sierra Leone (%)
Place of birth for the foreign-born population - Other Western Africa (%)
Place of birth for the foreign-born population - Australia (%)
Place of birth for the foreign-born population - New Zealand (%)
Place of birth for the foreign-born population - Fiji (%)
Place of birth for the foreign-born population - Micronesia (%)
Place of birth for the foreign-born population - Bahamas (%)
Place of birth for the foreign-born population - Barbados (%)
Place of birth for the foreign-born population - Cuba (%)
Place of birth for the foreign-born population - Dominica (%)
Place of birth for the foreign-born population - Dominican Republic (%)
Place of birth for the foreign-born population - Grenada (%)
Place of birth for the foreign-born population - Haiti (%)
Place of birth for the foreign-born population - Jamaica (%)
Place of birth for the foreign-born population - St. Vincent and the Grenadines (%)
Place of birth for the foreign-born population - Trinidad and Tobago (%)
Place of birth for the foreign-born population - West Indies (%)
Place of birth for the foreign-born population - Other Caribbean (%)
Place of birth for the foreign-born population - Belize (%)
Place of birth for the foreign-born population - Costa Rica (%)
Place of birth for the foreign-born population - El Salvador (%)
Place of birth for the foreign-born population - Guatemala (%)
Place of birth for the foreign-born population - Honduras (%)
Place of birth for the foreign-born population - Mexico (%)
Place of birth for the foreign-born population - Nicaragua (%)
Place of birth for the foreign-born population - Panama (%)
Place of birth for the foreign-born population - Other Central America (%)
Place of birth for the foreign-born population - Argentina (%)
Place of birth for the foreign-born population - Bolivia (%)
Place of birth for the foreign-born population - Brazil (%)
Place of birth for the foreign-born population - Chile (%)
Place of birth for the foreign-born population - Colombia (%)
Place of birth for the foreign-born population - Ecuador (%)
Place of birth for the foreign-born population - Guyana (%)
Place of birth for the foreign-born population - Peru (%)
Place of birth for the foreign-born population - Uruguay (%)
Place of birth for the foreign-born population - Venezuela (%)
Place of birth for the foreign-born population - Other South America (%)
Place of birth for the foreign-born population - Canada (%)
Place of birth for the foreign-born population - Other Northern America (%)
Place of birth for the foreign-born population - Other (%)
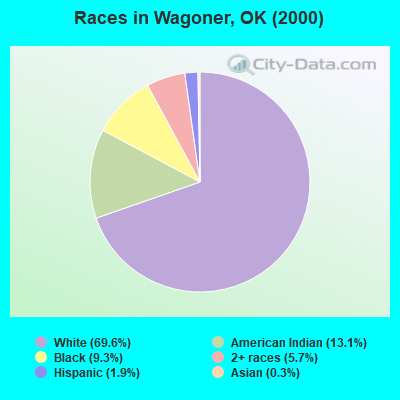
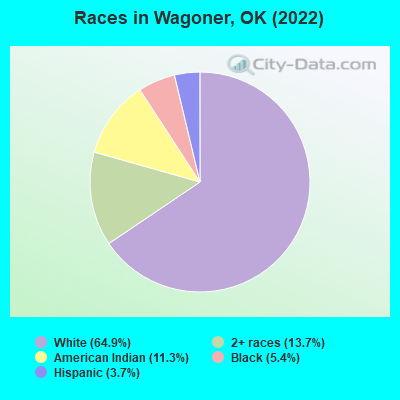
According to 2022 data, the most numerous races in Wagoner, OK are White alone (5,343 residents), Hispanic (303 residents), and Two or more races (1,125 residents). 95.6% of Wagoner residents speak English at home. 0.8% of Wagoner, OK residents are foreign-born , which is 636.8% less than the foreign-born rate of 6.0% across the entire state of Oklahoma.
Race distribution in Wagoner
2000 2022
2,556,368 74.1% White alone 266,158 7.7% American Indian alone 257,981 7.5% Black alone 179,304 5.2% Hispanic 140,249 4.1% Two or more races 46,172 1.3% Asian alone 2,322 0.07% Other race alone 2,100 0.06% Native Hawaiian and Other
2,517,403 62.6% White alone 486,692 12.1% Hispanic 364,453 9.1% Two or more races 273,650 6.8% American Indian alone 268,543 6.7% Black alone 92,672 2.3% Asian alone 10,786 0.3% Other race alone 5,601 0.1% Native Hawaiian and Other
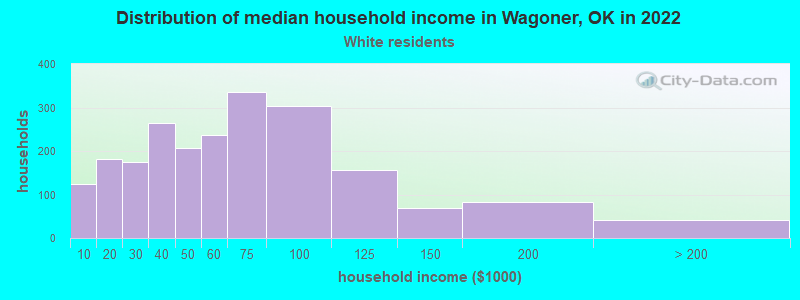
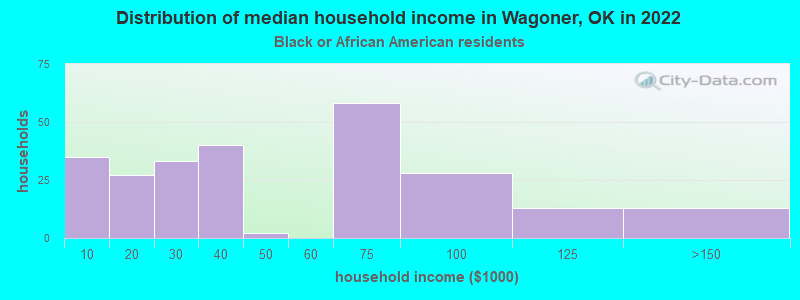
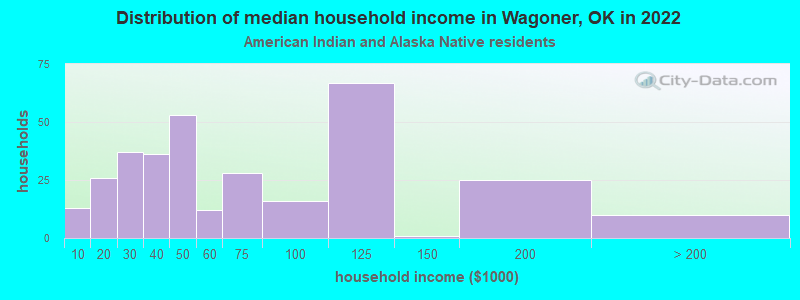
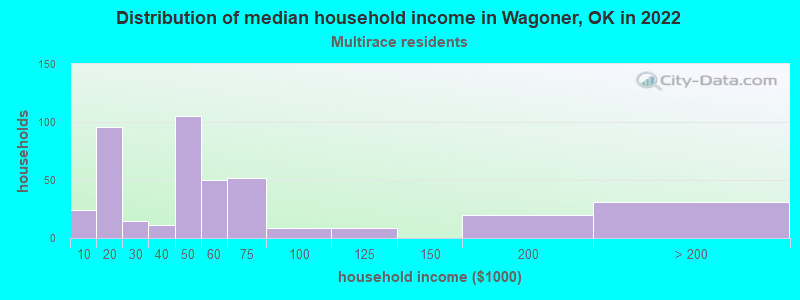
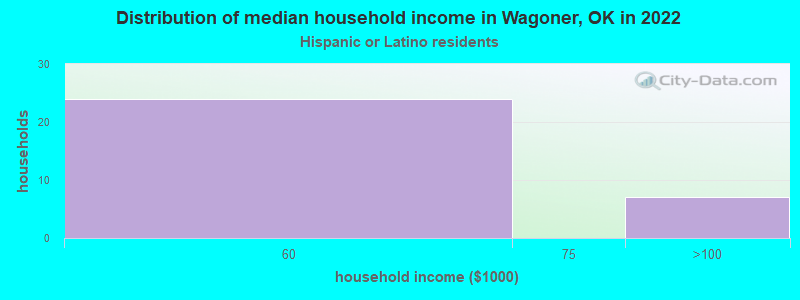
Income and house value in Wagoner Median household income in 2022 $54,868 White non-Hispanic householders$37,646 Black householders$52,110 American Indian and Alaska Native householders$49,669 Two or more races householdersMedian 2022 house value $160,357 White Non-Hispanic householders$148,240 Black or African American householders$137,412 American Indian or Alaska Native householders$206,247 Some other race householders$172,474 Two or more races householders$206,247 Hispanic or Latino householders
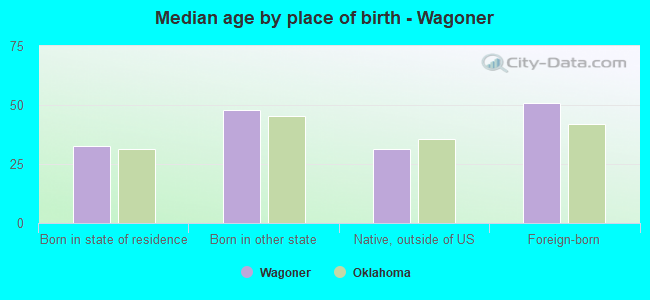
Median age by race in Wagoner
38.6 Median age for White residents39.1 38.0 59.4 Median age for Black or African American residents64.7 61.0 35.9 Median age for American Indian / Alaska Native residents39.3 32.4 -648,526,076.4 Median age for Asian residents-437,735,848.6 -658,119,657.5 -725,225,224.5 Median age for Native Hawaiian / Pacific Islander residents-675,324,674.6 -666,666,666.0 -745,238,094.5 Median age for Other race residents-753,939,393.2 -734,265,733.5 30.7 Median age for Two or more races residents27.3 33.2 39.0 Median age for White alone residents39.6 37.8 37.8 Median age for Hispanic or Latino residents32.2 42.9
Owner/renter occupied households by race in Wagoner
House owners and renters - White residents 1,392 67.4% Owner occupied673 32.6% Renter occupiedHouse owners and renters - Black or African American residents 53 24.7% Owner occupied162 75.3% Renter occupiedHouse owners and renters - American Indian / Alaska Native residents 147 44.4% Owner occupied184 55.6% Renter occupiedHouse owners and renters - Two or more races residents 241 59.7% Owner occupied163 40.3% Renter occupiedHouse owners and renters - White alone residents 1,405 67.4% Owner occupied678 32.6% Renter occupiedHouse owners and renters - Hispanic or Latino residents 36 100.0% Owner occupied
Language usage in Wagoner
English speakers - Total 95.6% of residents of Wagoner speak English at home.
1.2% of residents speak Spanish at home 74 77.9% Speak English very well21 22.1% Speak English less than very well2.3% of residents speak other language at home 163 93.7% Speak English very well11 6.3% Speak English less than very well
English speakers - Born in the United States 99.0% of residents of Wagoner speak English at home.
1.1% of residents speak Spanish at home 26 100.0% Speak English very well0.3% of residents speak other language at home 6 100.0% Speak English very well
English speakers - Native, born elsewhere 69.2% of residents of Wagoner speak English at home.
35.9% of residents speak other language at home 14 100.0% Speak English less than very well
English speakers - Foreign-born 0.0% of residents of Wagoner speak English at home.
60.2% of residents speak Spanish at home 31 58.5% Speak English very well22 41.5% Speak English less than very well28.4% of residents speak other language at home 25 100.0% Speak English very well
White (Caucasian) - Speak another language Native:
1.4% (72)Foreign-born:
100.0% (39)
Two or more races - Speak another language Native:
6.8% (84)Foreign-born:
99.4% (11)
White alone - Speak another language Native:
2.0% (102)Foreign-born:
100.0% (21)
Hispanic or Latino - Speak another language Native:
3.4% (7)Foreign-born:
100.0% (56)
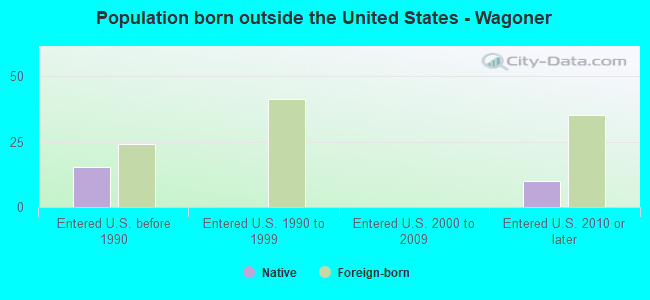
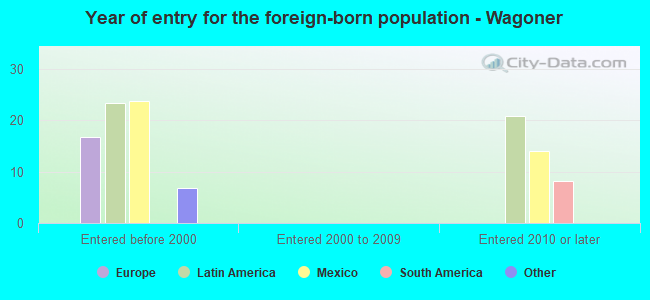
Foreign-born residents in Wagoner 67 residents are foreign born
This city:
0.8%Oklahoma:
6.1%
Marital status for residents in Wagoner Marital status - White (Caucasian) population 15 years and over
Males 27.0% Never married52.9% Now married1.2% Separated3.1% Widowed15.9% DivorcedFemales 21.4% Never married43.7% Now married3.4% Separated13.7% Widowed17.7% DivorcedWomen who gave birth in the past 12 months Now married:
81.7% (80)Unmarried:
18.3% (18)
Women who did not give birth in the past 12 months Now married:
48.2% (605)Unmarried:
51.8% (651)
Marital status - Black or African American population 15 years and over
Males 38.7% Never married47.1% Now married0.0% Separated0.0% Widowed14.2% DivorcedFemales 51.4% Never married29.2% Now married0.9% Separated15.1% Widowed3.3% DivorcedWomen who gave birth in the past 12 months Now married:
0.0% (0)Unmarried:
100.0% (7)
Women who did not give birth in the past 12 months Now married:
13.5% (14)Unmarried:
86.5% (90)
Marital status - American Indian / Alaska Native population 15 years and over
Males 33.2% Never married41.4% Now married1.7% Separated2.5% Widowed21.1% DivorcedFemales 33.8% Never married34.1% Now married0.0% Separated8.9% Widowed23.2% DivorcedWomen who gave birth in the past 12 months Now married:
100.0% (9)Unmarried:
0.0% (0)
Women who did not give birth in the past 12 months Now married:
18.9% (37)Unmarried:
81.1% (160)
Marital status - Two or more races population 15 years and over
Males 34.6% Never married44.8% Now married0.0% Separated6.2% Widowed14.5% DivorcedFemales 31.3% Never married39.8% Now married0.0% Separated11.4% Widowed17.5% DivorcedWomen who gave birth in the past 12 months Now married:
26.7% (5)Unmarried:
73.3% (13)
Women who did not give birth in the past 12 months Now married:
38.3% (114)Unmarried:
61.7% (184)
Marital status - White alone, not Hispanic / Latino population 15 years and over
Males 26.9% Never married52.5% Now married1.2% Separated3.1% Widowed16.2% DivorcedFemales 21.5% Never married43.2% Now married3.5% Separated13.9% Widowed18.0% DivorcedWomen who gave birth in the past 12 months Now married:
81.7% (80)Unmarried:
18.3% (18)
Women who did not give birth in the past 12 months Now married:
48.2% (608)Unmarried:
51.8% (654)
Marital status - Hispanic or Latino population 15 years and over
Males 28.4% Never married46.1% Now married0.0% Separated0.0% Widowed25.5% DivorcedFemales 6.4% Never married65.4% Now married0.0% Separated28.2% Widowed0.0% DivorcedWomen who did not give birth in the past 12 months Now married:
100.0% (30)Unmarried:
0.0% (0)
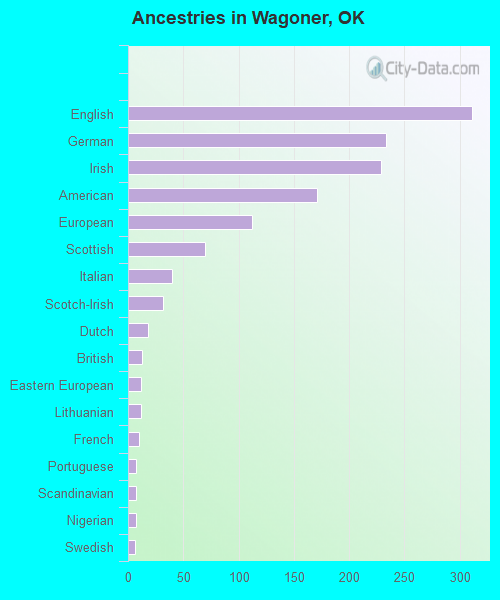
Ancestries in Wagoner
311 10.0% English233 7.5% German229 7.4% Irish171 5.5% American112 3.6% European70 2.3% Scottish40 1.3% Italian32 1.0% Scotch-Irish18 0.6% Dutch13 0.4% British12 0.4% Eastern European12 0.4% Lithuanian10 0.3% French7 0.2% Portuguese7 0.2% Scandinavian7 0.2% Nigerian6 0.2% Swedish
Children Nativity (place of birth) in Wagoner
Children under 6 years - Living with two parents Both parents native 389 100.0% NativeChildren under 6 years - Living with one parent Native parent 158 100.0% Native
Children 6 to 17 years - Living with two parents Both parents native 710 100.0% NativeOne native, one foreign-born parent 8 100.0% NativeChildren 6 to 17 years - Living with one parent Native parent 394 100.0% Native
Grandparents responsible for own grandchildren in Wagoner
Grandparents (30 to 59 years) White / Caucasian 10 13.1% Responsible for grandchildren65 86.9% Not responsible for grandchildrenBlack or African American 6 100.0% Responsible for grandchildrenAmerican Indian / Alaska Native 8 100.0% Responsible for grandchildrenWhite alone, not Hispanic / Latino 10 13.3% Responsible for grandchildren65 86.7% Not responsible for grandchildrenGrandparents (60 years and over) White / Caucasian 11 21.9% Responsible for grandchildren40 78.1% Not responsible for grandchildrenWhite alone, not Hispanic / Latino 11 21.9% Responsible for grandchildren40 78.1% Not responsible for grandchildren