Races in Waller, Washington (WA) Detailed Stats
Ancestries, Foreign-born residents, place of birth
Settings
X


Discuss Waller, Washington races on our local forum with over 2,400,000 registered users
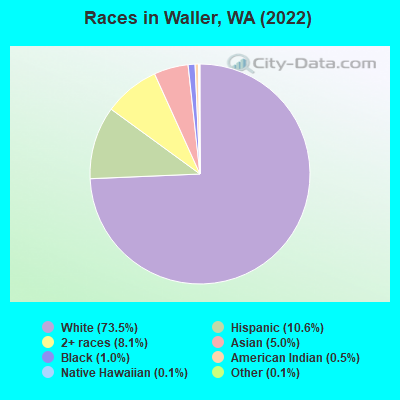
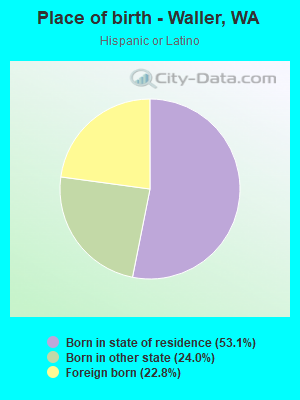
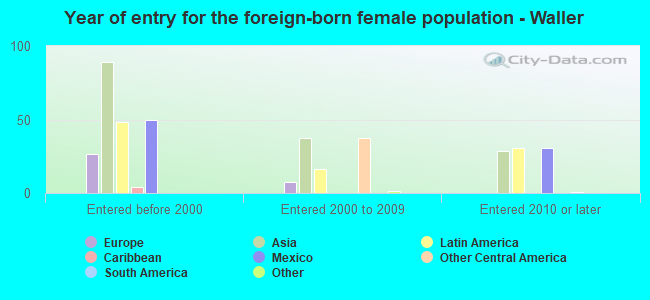
According to 2022 data, the most numerous races in Waller, WA are White alone (5,926 residents), Hispanic (854 residents), and Asian alone (400 residents). 88.0% of Waller residents speak English at home. 6.2% of Waller, WA residents are foreign-born (2.8% born in Asia, 2.4% born in Latin America, 0.7% born in Europe), which is 142.9% less than the foreign-born rate of 15.0% across the entire state of Washington.
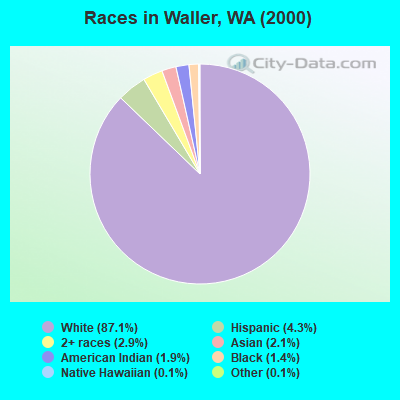
Race distribution in Waller
2000
2022

- 8,01487.1%White alone
- 3984.3%Hispanic
- 2662.9%Two or more races
- 1892.1%Asian alone
- 1761.9%American Indian alone
- 1331.4%Black alone
- 120.1%Native Hawaiian and Other
Pacific Islander alone - 120.1%Other race alone
-
- 5,92673.5%White alone
- 85410.6%Hispanic
- 6538.1%Two or more races
- 4005.0%Asian alone
- 811.0%Black alone
- 410.5%American Indian alone
- 120.1%Native Hawaiian and Other
Pacific Islander alone - 120.1%Other race alone
2000
2022
-
- 4,652,49078.9%White alone
- 441,5097.5%Hispanic
- 319,4015.4%Asian alone
- 184,6313.1%Black alone
- 175,9263.0%Two or more races
- 85,3961.4%American Indian alone
- 22,7790.4%Native Hawaiian and Other
Pacific Islander alone - 11,9890.2%Other race alone

-
- 4,941,45663.5%White alone
- 1,093,31314.0%Hispanic
- 755,8329.7%Asian alone
- 523,4486.7%Two or more races
- 299,5373.8%Black alone
- 69,0240.9%American Indian alone
- 52,2310.7%Native Hawaiian and Other
Pacific Islander alone - 50,9450.7%Other race alone

Income and house value in Waller
- Median household income in 2022
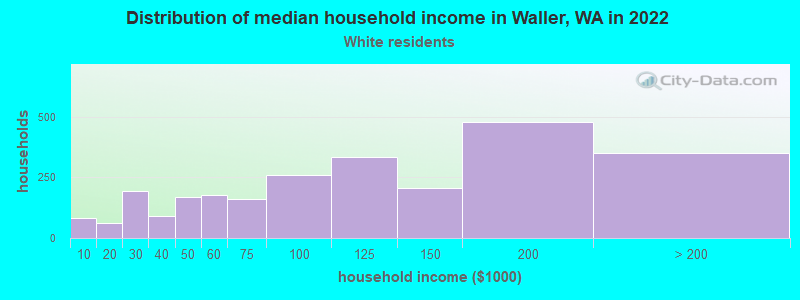
- $112,871White non-Hispanic householders
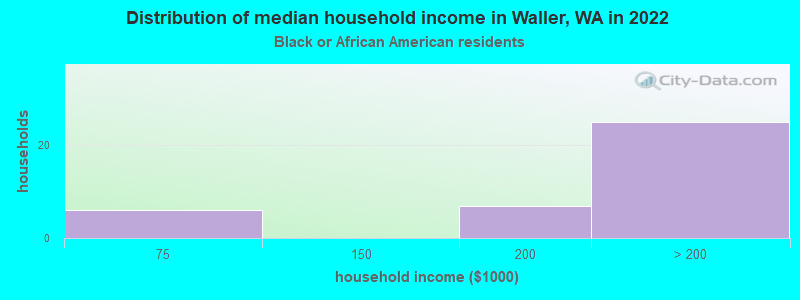
- over $200,000Black householders
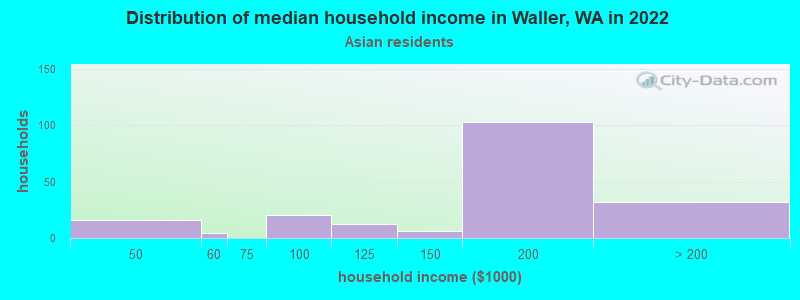
- $160,911Asian householders
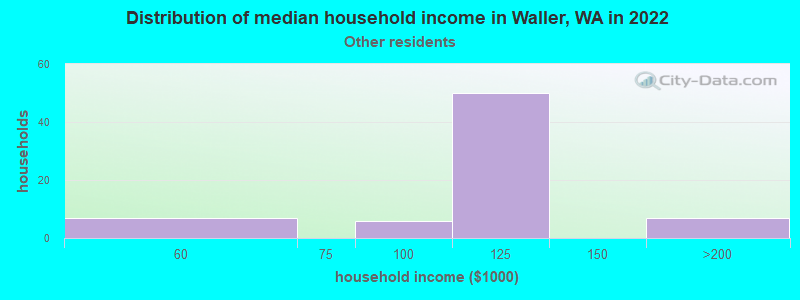
- $107,529Some other race householders
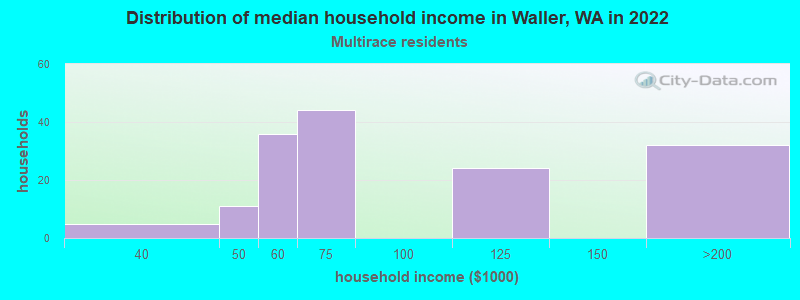
- $78,377Two or more races householders
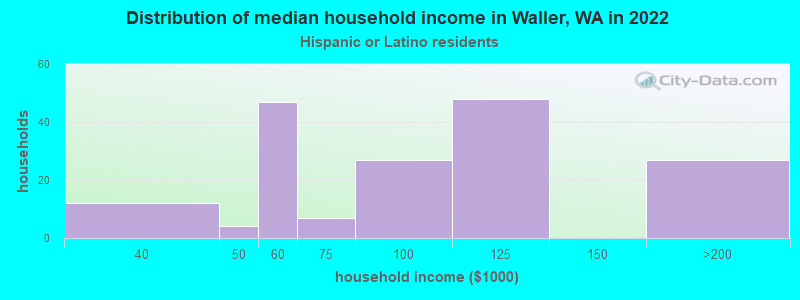
- $107,109Hispanic or Latino race householders
- Median 2022 house value
- $604,604White Non-Hispanic householders
- $545,147Black or African American householders
- $521,364American Indian or Alaska Native householders
- $768,855Asian householders
- $603,861Some other race householders
- $487,920Two or more races householders
- $650,312Hispanic or Latino householders
Household income for White non-Hispanic householders
Household income for Black householders
Household income for Asian householders
Household income for Some other race householders
Household income for Two or more races householders
Household income for Hispanic or Latino race householders
Median age by race in Waller
- 48.3Median age for White residents
- 46.5Males
- 49.8Females
- 44.5Median age for Black or African American residents
- 49.9Males
- 44.4Females
- 43.4Median age for American Indian / Alaska Native residents
- -622,057,000.6Males
- 31.6Females
- 35.5Median age for Asian residents
- 44.5Males
- 34.0Females
- -683,229,813.0Median age for Native Hawaiian / Pacific Islander residents
- -736,612,021.1Males
- -634,538,152.0Females
- 41.5Median age for Other race residents
- 41.5Males
- 24.4Females
- 16.2Median age for Two or more races residents
- 17.7Males
- 16.2Females
- 49.5Median age for White alone residents
- 47.0Males
- 50.4Females
- 22.2Median age for Hispanic or Latino residents
- 25.3Males
- 21.4Females
Owner/renter occupied households by race in Waller
- House owners and renters - White residents
- 2,18485.9%Owner occupied
- 35914.1%Renter occupied
- House owners and renters - Black or African American residents
- 1435.7%Owner occupied
- 2664.3%Renter occupied
- House owners and renters - American Indian / Alaska Native residents
- 2100.0%Renter occupied
- House owners and renters - Asian residents
- 16489.7%Owner occupied
- 1910.3%Renter occupied
- House owners and renters - Other race residents
- 3656.6%Owner occupied
- 2843.4%Renter occupied
- House owners and renters - Two or more races residents
- 10865.3%Owner occupied
- 5734.7%Renter occupied
- House owners and renters - White alone residents
- 2,17486.7%Owner occupied
- 33313.3%Renter occupied
- House owners and renters - Hispanic or Latino residents
- 8046.6%Owner occupied
- 9153.4%Renter occupied
Language usage in Waller
- English speakers - Total
- 88.0% of residents of Waller speak English at home.
- 5.0% of residents speak Spanish at home
- 17847.8%Speak English very well
- 19452.2%Speak English less than very well
- 6.6% of residents speak other language at home
- 35671.6%Speak English very well
- 14128.4%Speak English less than very well
- English speakers - Born in the United States
- 94.2% of residents of Waller speak English at home.
- 4.3% of residents speak Spanish at home
- 7678.4%Speak English very well
- 2121.6%Speak English less than very well
- 1.4% of residents speak other language at home
- 31100.0%Speak English very well
- English speakers - Native, born elsewhere
- 81.7% of residents of Waller speak English at home.
- 20.6% of residents speak other language at home
- 26100.0%Speak English very well
- English speakers - Foreign-born
- 4.7% of residents of Waller speak English at home.
- 36.6% of residents speak Spanish at home
- 6735.6%Speak English very well
- 12164.4%Speak English less than very well
- 57.8% of residents speak other language at home
- 15752.9%Speak English very well
- 14047.1%Speak English less than very well
White (Caucasian) - Speak only English
| Native: | 98.2% (5,526) |
| Foreign-born: | 22.6% (21) |
White (Caucasian) - Speak another language
| Native: | 2.1% (117) |
| Foreign-born: | 78.7% (73) |
Asian - Speak another language
| Native: | 28.6% (39) |
| Foreign-born: | 94.2% (226) |
Other race - Speak another language
| Native: | 65.3% (131) |
| Foreign-born: | 99.0% (79) |
Two or more races - Speak another language
| Native: | 10.2% (79) |
| Foreign-born: | 100.0% (96) |
White alone - Speak only English
| Native: | 97.7% (5,383) |
| Foreign-born: | 31.9% (22) |
White alone - Speak another language
| Native: | 2.2% (124) |
| Foreign-born: | 67.8% (47) |
Hispanic or Latino - Speak another language
| Native: | 36.8% (179) |
| Foreign-born: | 100.0% (201) |
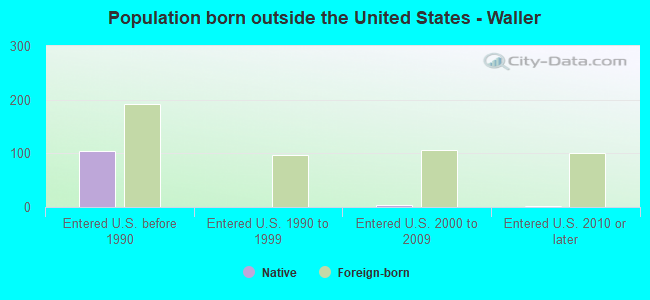
Foreign-born residents in Waller
498 residents are foreign born (2.8% Asia, 2.4% Latin America, 0.7% Europe).
| This city: | 6.2% |
| Washington: | 14.9% |
Marital status for residents in Waller
Marital status - White (Caucasian) population 15 years and over
- Males
- 30.4%Never married
- 53.6%Now married
- 0.6%Separated
- 1.6%Widowed
- 13.7%Divorced
- Females
- 21.8%Never married
- 49.9%Now married
- 2.5%Separated
- 9.7%Widowed
- 16.1%Divorced
Women who gave birth in the past 12 months
| Now married: | 66.7% (9) |
| Unmarried: | 33.3% (5) |
Women who did not give birth in the past 12 months
| Now married: | 52.0% (574) |
| Unmarried: | 48.0% (530) |
Marital status - Black or African American population 15 years and over
- Males
- 38.0%Never married
- 62.0%Now married
- 0.0%Separated
- 0.0%Widowed
- 0.0%Divorced
- Females
- 45.2%Never married
- 29.0%Now married
- 16.1%Separated
- 9.7%Widowed
- 0.0%Divorced
Women who gave birth in the past 12 months
| Now married: | 0.0% (0) |
| Unmarried: | 100.0% (14) |
Women who did not give birth in the past 12 months
| Now married: | 100.0% (5) |
| Unmarried: | 0.0% (0) |
Marital status - American Indian / Alaska Native population 15 years and over
- Males
- 0.0%Never married
- 0.0%Now married
- 0.0%Separated
- 0.0%Widowed
- 100.0%Divorced
- Females
- 8.0%Never married
- 68.0%Now married
- 0.0%Separated
- 0.0%Widowed
- 24.0%Divorced
Women who did not give birth in the past 12 months
| Now married: | 55.6% (10) |
| Unmarried: | 44.4% (8) |
Marital status - Asian population 15 years and over
- Males
- 21.4%Never married
- 68.0%Now married
- 0.0%Separated
- 0.0%Widowed
- 10.7%Divorced
- Females
- 18.4%Never married
- 69.9%Now married
- 0.0%Separated
- 3.3%Widowed
- 8.4%Divorced
Women who did not give birth in the past 12 months
| Now married: | 76.3% (148) |
| Unmarried: | 23.7% (46) |
Marital status - Other race population 15 years and over
- Males
- 25.9%Never married
- 74.1%Now married
- 0.0%Separated
- 0.0%Widowed
- 0.0%Divorced
- Females
- 63.2%Never married
- 36.8%Now married
- 0.0%Separated
- 0.0%Widowed
- 0.0%Divorced
Women who did not give birth in the past 12 months
| Now married: | 20.0% (20) |
| Unmarried: | 80.0% (78) |
Marital status - Two or more races population 15 years and over
- Males
- 50.0%Never married
- 50.0%Now married
- 0.0%Separated
- 0.0%Widowed
- 0.0%Divorced
- Females
- 48.5%Never married
- 31.9%Now married
- 0.0%Separated
- 12.3%Widowed
- 7.4%Divorced
Women who did not give birth in the past 12 months
| Now married: | 34.2% (54) |
| Unmarried: | 65.8% (104) |
Marital status - White alone, not Hispanic / Latino population 15 years and over
- Males
- 30.5%Never married
- 53.1%Now married
- 0.6%Separated
- 1.7%Widowed
- 14.0%Divorced
- Females
- 21.0%Never married
- 50.1%Now married
- 2.6%Separated
- 9.9%Widowed
- 16.4%Divorced
Women who gave birth in the past 12 months
| Now married: | 66.7% (10) |
| Unmarried: | 33.3% (5) |
Women who did not give birth in the past 12 months
| Now married: | 52.7% (559) |
| Unmarried: | 47.3% (502) |
Marital status - Hispanic or Latino population 15 years and over
- Males
- 38.6%Never married
- 59.6%Now married
- 0.0%Separated
- 0.0%Widowed
- 1.8%Divorced
- Females
- 59.2%Never married
- 34.7%Now married
- 0.0%Separated
- 2.3%Widowed
- 3.8%Divorced
Women who did not give birth in the past 12 months
| Now married: | 26.6% (62) |
| Unmarried: | 73.4% (170) |
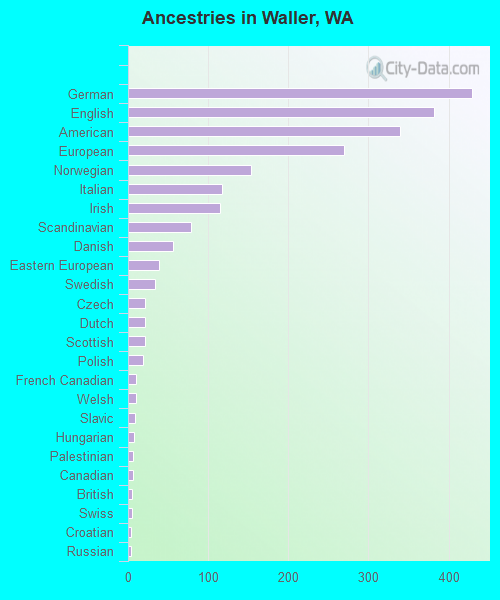
Ancestries in Waller

- 42913.0%German
- 38211.6%English
- 33910.3%American
- 2708.2%European
- 1544.7%Norwegian
- 1173.6%Italian
- 1153.5%Irish
- 782.4%Scandinavian
- 561.7%Danish
- 391.2%Eastern European
- 341.0%Swedish
- 210.6%Czech
- 210.6%Dutch
- 210.6%Scottish
- 190.6%Polish
- 100.3%French Canadian
- 100.3%Welsh
- 90.3%Slavic
- 80.2%Hungarian
- 60.2%Palestinian
- 60.2%Canadian
- 50.2%British
- 50.2%Swiss
- 40.1%Croatian
- 40.1%Russian
- 40.1%Slovene
- 30.09%French
- 30.09%West Indian
- 10.03%Pennsylvania German
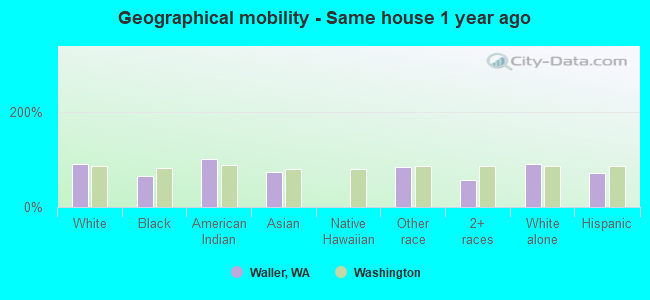
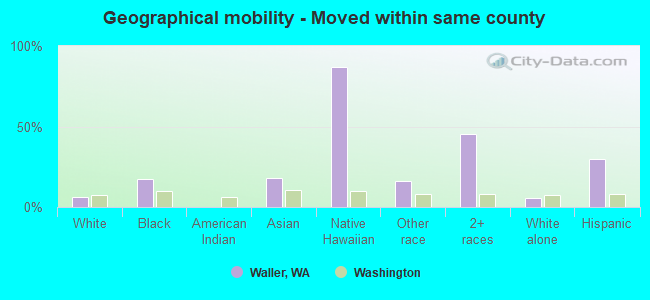
Geographical mobility in Waller

- Same house 1 year ago
- 5,53091.2%White (Caucasian)
- 5465.1%Black or African American
- 45100.0%American Indian / Alaska Native
- 29774.4%Asian
- 25082.9%Other race
- 58555.8%Two or more races
- 5,41991.4%White alone, not Hispanic / Latino
- 61371.3%Hispanic or Latino
-
- Moved within same county
- 3686.1%White / Caucasian
- 1517.5%Black or African American
- 7318.2%Asian
- 1087.0%Native Hawaiian / Pacific Islander
- 4916.3%Other race
- 47545.3%Two or more races
- 3445.8%White alone, not Hispanic / Latino
- 25429.6%Hispanic or Latino
-
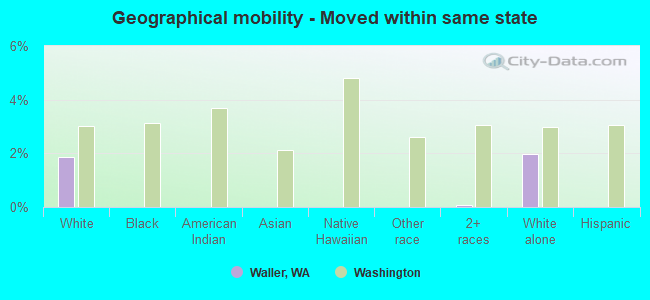
- Moved within same state
- 1131.9%White / Caucasian
- 10.1%Two or more races
- 1182.0%White alone, not Hispanic / Latino
-
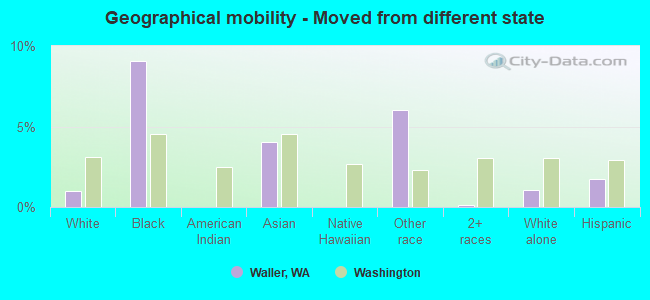
- Moved from different state
- 621.0%White / Caucasian
- 89.1%Black or African American
- 164.0%Asian
- 186.0%Other race
- 10.1%Two or more races
- 611.0%White alone, not Hispanic / Latino
- 151.7%Hispanic or Latino
-
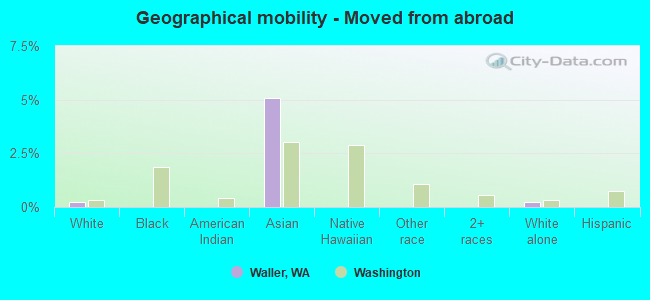
- Moved from abroad
- 150.2%White
- 205.1%Asian
- 150.2%White alone, not Hispanic / Latino
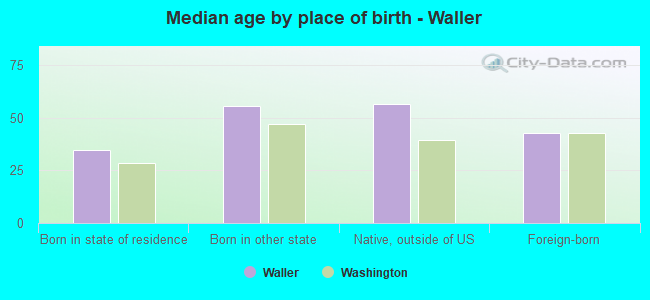
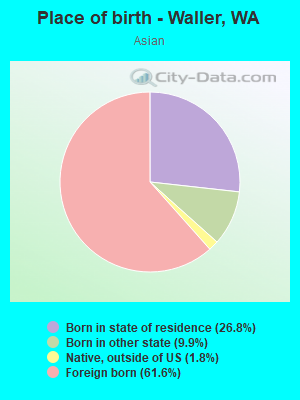
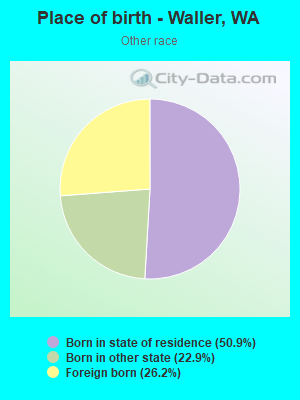
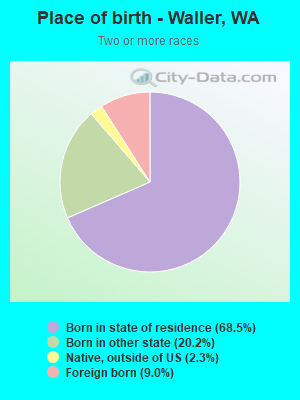
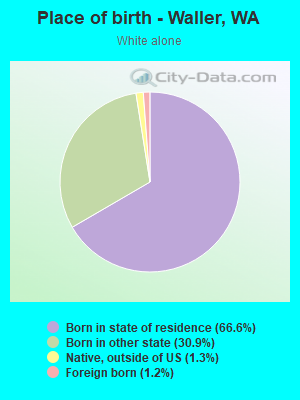
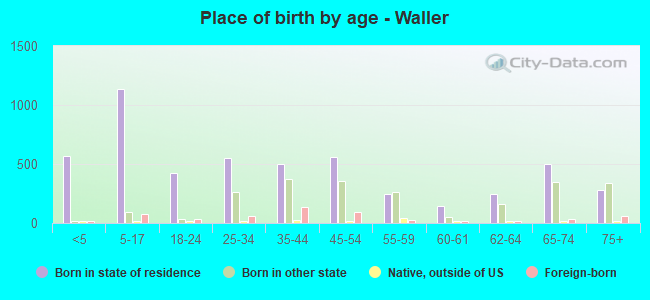
Children Nativity (place of birth) in Waller
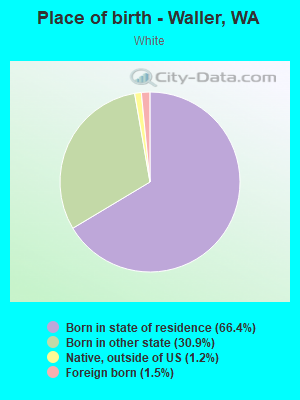
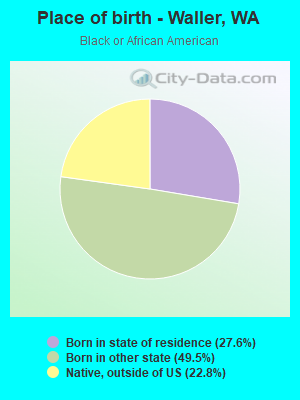
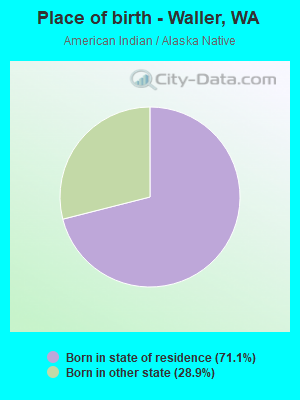
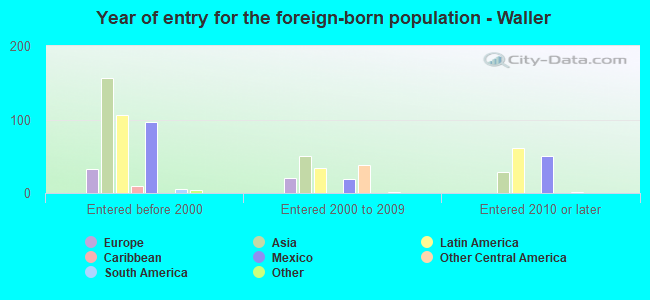
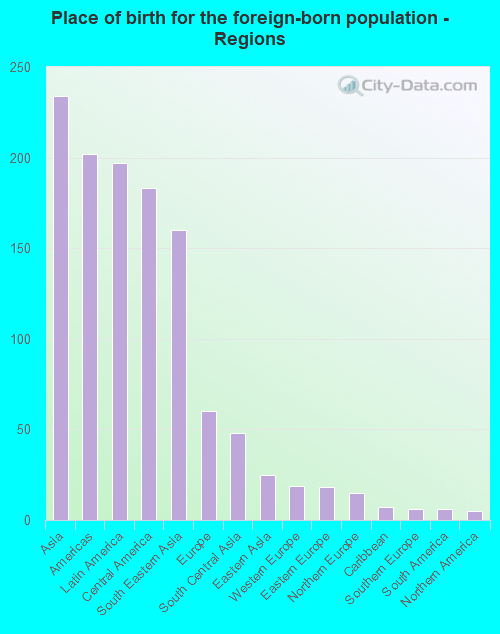
Place of birth for residents in Waller
![Place of birth for the foreign-born population - Regions]()
- 234Asia
- 202Americas
- 197Latin America
- 183Central America
- 160South Eastern Asia
- 60Europe
- 48South Central Asia
- 25Eastern Asia
- 19Western Europe
- 18Eastern Europe
- 15Northern Europe
- 7Caribbean
- 6Southern Europe
- 6South America
- 5Northern America
- 1Oceania
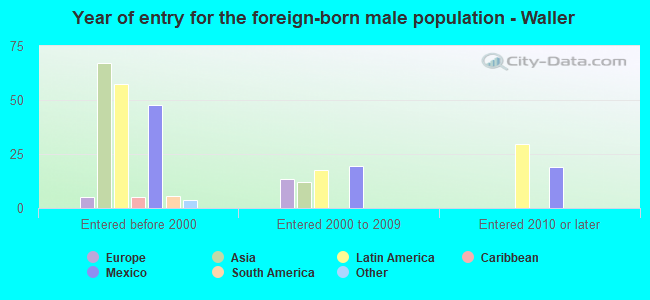
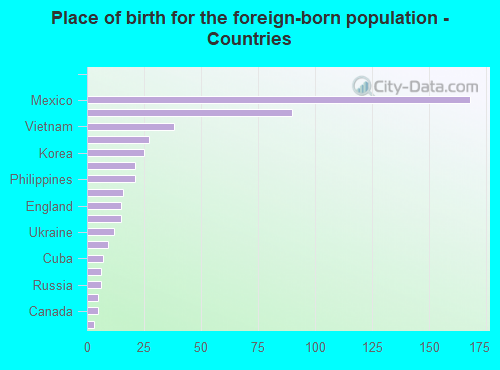
![Place of birth for the foreign-born population - Countries]()
- 168Mexico
- 90Cambodia
- 38Vietnam
- 27Pakistan
- 25Korea
- 21India
- 21Philippines
- 16Germany
- 15England
- 15El Salvador
- 12Ukraine
- 9Thailand
- 7Cuba
- 6Italy
- 6Russia
- 5Chile
- 5Canada
- 3Netherlands
- 1Marshall Islands
- 1Venezuela
Grandparents responsible for own grandchildren in Waller
Zip codes: 98443.