Races in Wallington, New Jersey (NJ) Detailed Stats
Data:
Races - White alone (%)
Races - White alone (% change since 2000)
Races - Black alone (%)
Races - Black alone (% change since 2000)
Races - American Indian alone (%)
Races - American Indian alone (% change since 2000)
Races - Asian alone (%)
Races - Asian alone (% change since 2000)
Races - Hispanic (%)
Races - Hispanic (% change since 2000)
Races - Native Hawaiian and Other Pacific Islander alone (%)
Races - Native Hawaiian and Other Pacific Islander alone (% change since 2000)
Races - Two or more races(%)
Races - Two or more races(% change since 2000)
Races - Other race alone (%)
Races - Other race alone (% change since 2000)
Racial diversity
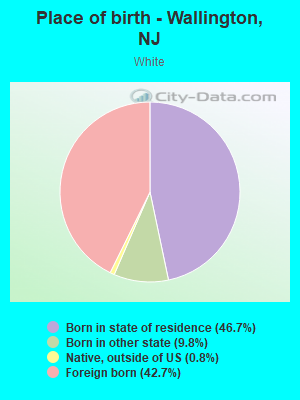
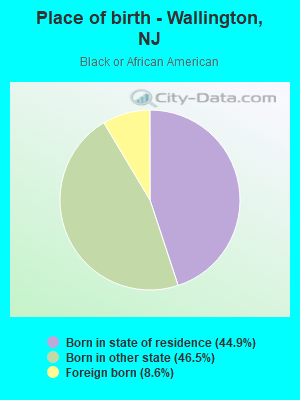
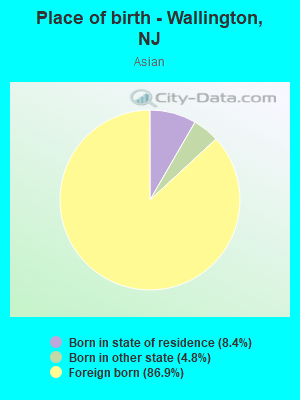
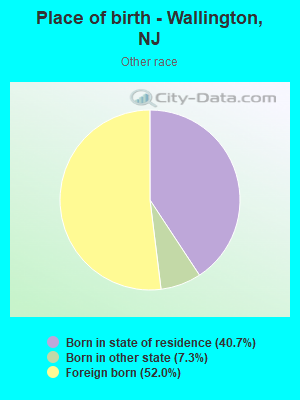
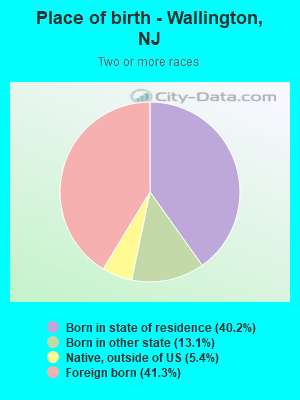
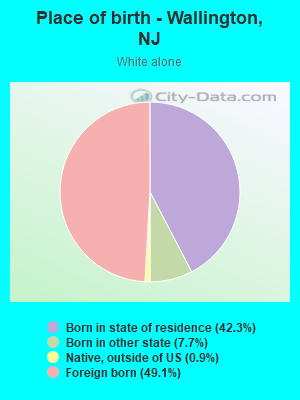
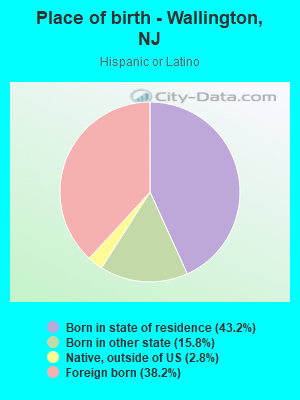
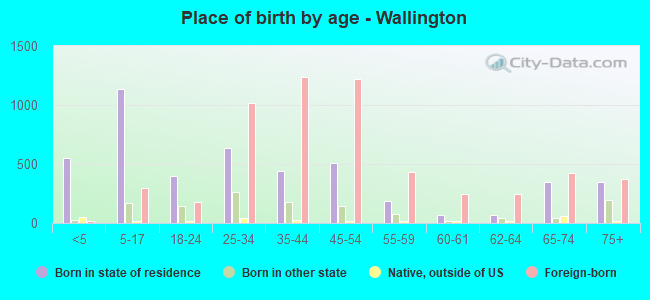
Place of birth - Born in state of residence (%)
Place of birth - Born in state of residence (%) - White
Place of birth - Born in state of residence (%) - Black or African American
Place of birth - Born in state of residence (%) - Asian
Place of birth - Born in state of residence (%) - Hispanic or Latino
Place of birth - Born in state of residence (%) - American Indian and Alaska Native
Place of birth - Born in state of residence (%) - Multirace
Place of birth - Born in state of residence (%) - Other Race
Place of birth - Born in other state (%)
Place of birth - Born in other state (%) - White
Place of birth - Born in other state (%) - Black or African American
Place of birth - Born in other state (%) - Asian
Place of birth - Born in other state (%) - Hispanic or Latino
Place of birth - Born in other state (%) - American Indian and Alaska Native
Place of birth - Born in other state (%) - Multirace
Place of birth - Born in other state (%) - Other Race
Place of birth - Native, outside of US (%)
Place of birth - Native, outside of US (%) - White
Place of birth - Native, outside of US (%) - Black or African American
Place of birth - Native, outside of US (%) - Asian
Place of birth - Native, outside of US (%) - Hispanic or Latino
Place of birth - Native, outside of US (%) - American Indian and Alaska Native
Place of birth - Native, outside of US (%) - Multirace
Place of birth - Native, outside of US (%) - Other Race
Place of birth - Foreign born (%)
Place of birth - Foreign born (%) - White
Place of birth - Foreign born (%) - Black or African American
Place of birth - Foreign born (%) - Asian
Place of birth - Foreign born (%) - Hispanic or Latino
Place of birth - Foreign born (%) - American Indian and Alaska Native
Place of birth - Foreign born (%) - Multirace
Place of birth - Foreign born (%) - Other Race
Residents speaking English at home (%)
Residents speaking English at home - Born in the United States (%)
Residents speaking English at home - Native, born elsewhere (%)
Residents speaking English at home - Foreign born (%)
Residents speaking Spanish at home (%)
Residents speaking Spanish at home - Born in the United States (%)
Residents speaking Spanish at home - Native, born elsewhere (%)
Residents speaking Spanish at home - Foreign born (%)
Residents speaking other language at home (%)
Residents speaking other language at home - Born in the United States (%)
Residents speaking other language at home - Native, born elsewhere (%)
Residents speaking other language at home - Foreign born (%)
Marital status - Never married (%)
Marital status - Now married (%)
Marital status - Separated (%)
Marital status - Widowed (%)
Marital status - Divorced (%)
Ancestries Reported - Arab (%)
Ancestries Reported - Czech (%)
Ancestries Reported - Danish (%)
Ancestries Reported - Dutch (%)
Ancestries Reported - English (%)
Ancestries Reported - French (%)
Ancestries Reported - French Canadian (%)
Ancestries Reported - German (%)
Ancestries Reported - Greek (%)
Ancestries Reported - Hungarian (%)
Ancestries Reported - Irish (%)
Ancestries Reported - Italian (%)
Ancestries Reported - Lithuanian (%)
Ancestries Reported - Norwegian (%)
Ancestries Reported - Polish (%)
Ancestries Reported - Portuguese (%)
Ancestries Reported - Russian (%)
Ancestries Reported - Scotch-Irish (%)
Ancestries Reported - Scottish (%)
Ancestries Reported - Slovak (%)
Ancestries Reported - Subsaharan African (%)
Ancestries Reported - Swedish (%)
Ancestries Reported - Swiss (%)
Ancestries Reported - Ukrainian (%)
Ancestries Reported - United States (%)
Ancestries Reported - Welsh (%)
Ancestries Reported - West Indian (%)
Ancestries Reported - Other (%)
Geographical mobility - Same house 1 year ago (%)
Geographical mobility - Same house 1 year ago (%) - White
Geographical mobility - Same house 1 year ago (%) - Black or African American
Geographical mobility - Same house 1 year ago (%) - Asian
Geographical mobility - Same house 1 year ago (%) - Hispanic or Latino
Geographical mobility - Same house 1 year ago (%) - American Indian and Alaska Native
Geographical mobility - Same house 1 year ago (%) - Multirace
Geographical mobility - Same house 1 year ago (%) - Other Race
Geographical mobility - Moved within same county (%)
Geographical mobility - Moved within same county (%) - White
Geographical mobility - Moved within same county (%) - Black or African American
Geographical mobility - Moved within same county (%) - Asian
Geographical mobility - Moved within same county (%) - Hispanic or Latino
Geographical mobility - Moved within same county (%) - American Indian and Alaska Native
Geographical mobility - Moved within same county (%) - Multirace
Geographical mobility - Moved within same county (%) - Other Race
Geographical mobility - Moved from different county within same state (%)
Geographical mobility - Moved from different county within same state (%) - White
Geographical mobility - Moved from different county within same state (%) - Black or African American
Geographical mobility - Moved from different county within same state (%) - Asian
Geographical mobility - Moved from different county within same state (%) - Hispanic or Latino
Geographical mobility - Moved from different county within same state (%) - American Indian and Alaska Native
Geographical mobility - Moved from different county within same state (%) - Multirace
Geographical mobility - Moved from different county within same state (%) - Other Race
Geographical mobility - Moved from different state (%)
Geographical mobility - Moved from different state (%) - White
Geographical mobility - Moved from different state (%) - Black or African American
Geographical mobility - Moved from different state (%) - Asian
Geographical mobility - Moved from different state (%) - Hispanic or Latino
Geographical mobility - Moved from different state (%) - American Indian and Alaska Native
Geographical mobility - Moved from different state (%) - Multirace
Geographical mobility - Moved from different state (%) - Other Race
Geographical mobility - Moved from abroad (%)
Geographical mobility - Moved from abroad (%) - White
Geographical mobility - Moved from abroad (%) - Black or African American
Geographical mobility - Moved from abroad (%) - Asian
Geographical mobility - Moved from abroad (%) - Hispanic or Latino
Geographical mobility - Moved from abroad (%) - American Indian and Alaska Native
Geographical mobility - Moved from abroad (%) - Multirace
Geographical mobility - Moved from abroad (%) - Other Race
Place of birth for the foreign-born population - Ireland (%)
Place of birth for the foreign-born population - Denmark (%)
Place of birth for the foreign-born population - Norway (%)
Place of birth for the foreign-born population - Sweden (%)
Place of birth for the foreign-born population - United Kingdom (%)
Place of birth for the foreign-born population - England (%)
Place of birth for the foreign-born population - Scotland (%)
Place of birth for the foreign-born population - Other Northern Europe (%)
Place of birth for the foreign-born population - Austria (%)
Place of birth for the foreign-born population - Belgium (%)
Place of birth for the foreign-born population - France (%)
Place of birth for the foreign-born population - Germany (%)
Place of birth for the foreign-born population - Netherlands (%)
Place of birth for the foreign-born population - Switzerland (%)
Place of birth for the foreign-born population - Other Western Europe (%)
Place of birth for the foreign-born population - Greece (%)
Place of birth for the foreign-born population - Italy (%)
Place of birth for the foreign-born population - Portugal (%)
Place of birth for the foreign-born population - Spain (%)
Place of birth for the foreign-born population - Other Southern Europe (%)
Place of birth for the foreign-born population - Albania (%)
Place of birth for the foreign-born population - Belarus (%)
Place of birth for the foreign-born population - Bosnia and Herzegovina (%)
Place of birth for the foreign-born population - Bulgaria (%)
Place of birth for the foreign-born population - Croatia (%)
Place of birth for the foreign-born population - Czechoslovakia (%)
Place of birth for the foreign-born population - Hungary (%)
Place of birth for the foreign-born population - Latvia (%)
Place of birth for the foreign-born population - Lithuania (%)
Place of birth for the foreign-born population - North Macedonia (Macedonia) (%)
Place of birth for the foreign-born population - Moldova (%)
Place of birth for the foreign-born population - Poland (%)
Place of birth for the foreign-born population - Romania (%)
Place of birth for the foreign-born population - Russia (%)
Place of birth for the foreign-born population - Serbia (%)
Place of birth for the foreign-born population - Ukraine (%)
Place of birth for the foreign-born population - Other Eastern Europe (%)
Place of birth for the foreign-born population - China (%)
Place of birth for the foreign-born population - Hong Kong (%)
Place of birth for the foreign-born population - Taiwan (%)
Place of birth for the foreign-born population - Japan (%)
Place of birth for the foreign-born population - Korea (%)
Place of birth for the foreign-born population - Other Eastern Asia (%)
Place of birth for the foreign-born population - Afghanistan (%)
Place of birth for the foreign-born population - Bangladesh (%)
Place of birth for the foreign-born population - India (%)
Place of birth for the foreign-born population - Iran (%)
Place of birth for the foreign-born population - Kazakhstan (%)
Place of birth for the foreign-born population - Nepal (%)
Place of birth for the foreign-born population - Pakistan (%)
Place of birth for the foreign-born population - Sri Lanka (%)
Place of birth for the foreign-born population - Uzbekistan (%)
Place of birth for the foreign-born population - Other South Central Asia (%)
Place of birth for the foreign-born population - Burma (%)
Place of birth for the foreign-born population - Cambodia (%)
Place of birth for the foreign-born population - Indonesia (%)
Place of birth for the foreign-born population - Laos (%)
Place of birth for the foreign-born population - Malaysia (%)
Place of birth for the foreign-born population - Philippines (%)
Place of birth for the foreign-born population - Singapore (%)
Place of birth for the foreign-born population - Thailand (%)
Place of birth for the foreign-born population - Vietnam (%)
Place of birth for the foreign-born population - Other South Eastern Asia (%)
Place of birth for the foreign-born population - Armenia (%)
Place of birth for the foreign-born population - Iraq (%)
Place of birth for the foreign-born population - Israel (%)
Place of birth for the foreign-born population - Jordan (%)
Place of birth for the foreign-born population - Kuwait (%)
Place of birth for the foreign-born population - Lebanon (%)
Place of birth for the foreign-born population - Saudi Arabia (%)
Place of birth for the foreign-born population - Syria (%)
Place of birth for the foreign-born population - Turkey (%)
Place of birth for the foreign-born population - Yemen (%)
Place of birth for the foreign-born population - Other Western Asia (%)
Place of birth for the foreign-born population - Eritrea (%)
Place of birth for the foreign-born population - Ethiopia (%)
Place of birth for the foreign-born population - Kenya (%)
Place of birth for the foreign-born population - Somalia (%)
Place of birth for the foreign-born population - Uganda (%)
Place of birth for the foreign-born population - Zimbabwe (%)
Place of birth for the foreign-born population - Other Eastern Africa (%)
Place of birth for the foreign-born population - Cameroon (%)
Place of birth for the foreign-born population - Congo (%)
Place of birth for the foreign-born population - Democratic Republic of Congo (Zaire) (%)
Place of birth for the foreign-born population - Other Middle Africa (%)
Place of birth for the foreign-born population - Egypt (%)
Place of birth for the foreign-born population - Morocco (%)
Place of birth for the foreign-born population - Sudan (%)
Place of birth for the foreign-born population - Other Northern Africa (%)
Place of birth for the foreign-born population - South Africa (%)
Place of birth for the foreign-born population - Other Southern Africa (%)
Place of birth for the foreign-born population - Cabo Verde (%)
Place of birth for the foreign-born population - Ghana (%)
Place of birth for the foreign-born population - Liberia (%)
Place of birth for the foreign-born population - Nigeria (%)
Place of birth for the foreign-born population - Senegal (%)
Place of birth for the foreign-born population - Sierra Leone (%)
Place of birth for the foreign-born population - Other Western Africa (%)
Place of birth for the foreign-born population - Australia (%)
Place of birth for the foreign-born population - New Zealand (%)
Place of birth for the foreign-born population - Fiji (%)
Place of birth for the foreign-born population - Micronesia (%)
Place of birth for the foreign-born population - Bahamas (%)
Place of birth for the foreign-born population - Barbados (%)
Place of birth for the foreign-born population - Cuba (%)
Place of birth for the foreign-born population - Dominica (%)
Place of birth for the foreign-born population - Dominican Republic (%)
Place of birth for the foreign-born population - Grenada (%)
Place of birth for the foreign-born population - Haiti (%)
Place of birth for the foreign-born population - Jamaica (%)
Place of birth for the foreign-born population - St. Vincent and the Grenadines (%)
Place of birth for the foreign-born population - Trinidad and Tobago (%)
Place of birth for the foreign-born population - West Indies (%)
Place of birth for the foreign-born population - Other Caribbean (%)
Place of birth for the foreign-born population - Belize (%)
Place of birth for the foreign-born population - Costa Rica (%)
Place of birth for the foreign-born population - El Salvador (%)
Place of birth for the foreign-born population - Guatemala (%)
Place of birth for the foreign-born population - Honduras (%)
Place of birth for the foreign-born population - Mexico (%)
Place of birth for the foreign-born population - Nicaragua (%)
Place of birth for the foreign-born population - Panama (%)
Place of birth for the foreign-born population - Other Central America (%)
Place of birth for the foreign-born population - Argentina (%)
Place of birth for the foreign-born population - Bolivia (%)
Place of birth for the foreign-born population - Brazil (%)
Place of birth for the foreign-born population - Chile (%)
Place of birth for the foreign-born population - Colombia (%)
Place of birth for the foreign-born population - Ecuador (%)
Place of birth for the foreign-born population - Guyana (%)
Place of birth for the foreign-born population - Peru (%)
Place of birth for the foreign-born population - Uruguay (%)
Place of birth for the foreign-born population - Venezuela (%)
Place of birth for the foreign-born population - Other South America (%)
Place of birth for the foreign-born population - Canada (%)
Place of birth for the foreign-born population - Other Northern America (%)
Place of birth for the foreign-born population - Other (%)
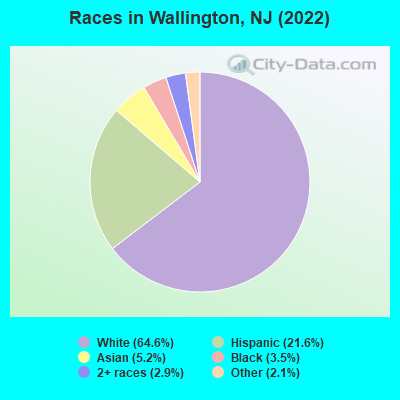
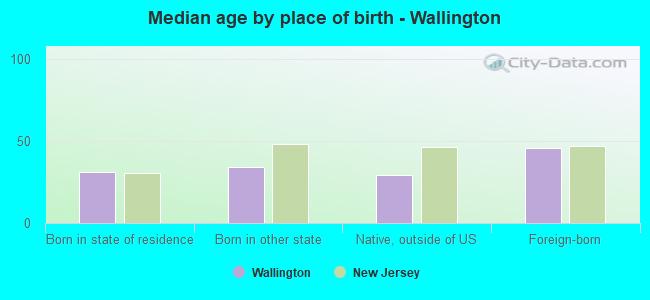
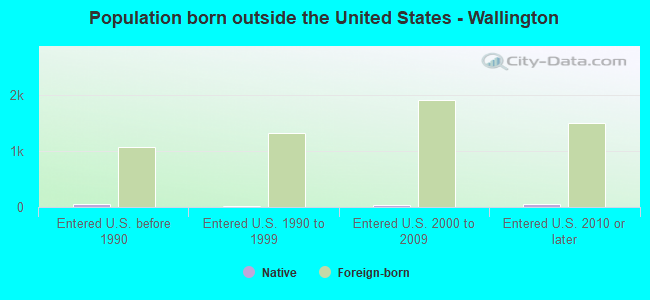
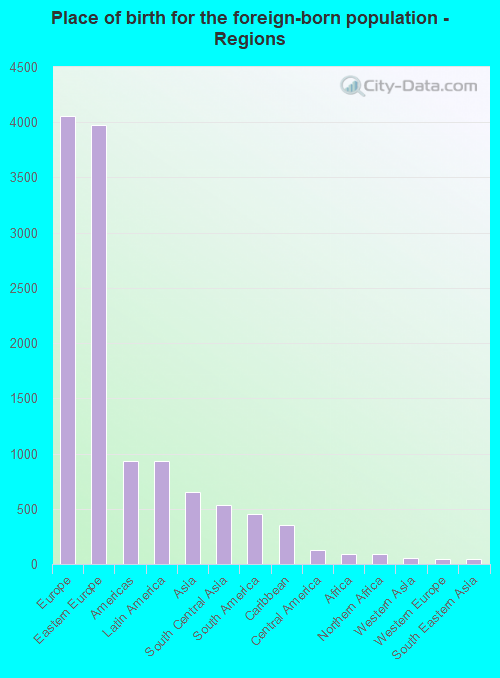
According to 2022 data, the most numerous races in Wallington, NJ are White alone (7,649 residents), Hispanic (2,556 residents), and Black alone (418 residents). 32.8% of Wallington residents speak English at home. 48.5% of Wallington, NJ residents are foreign-born (33.4% born in Europe, 7.7% born in Latin America, 5.4% born in Asia), which is 52.6% greater than the foreign-born rate of 23.0% across the entire state of New Jersey.
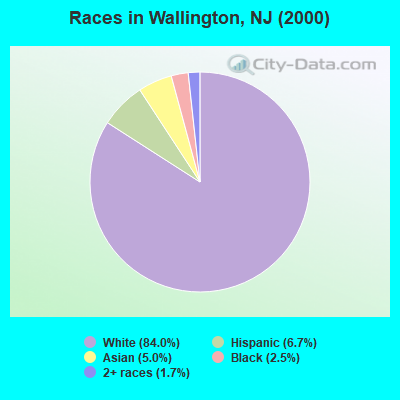
Race distribution in Wallington
2000 2022
5,557,209 66.0% White alone 1,117,191 13.3% Hispanic 1,096,171 13.0% Black alone 477,012 5.7% Asian alone 133,689 1.6% Two or more races 19,565 0.2% Other race alone 11,338 0.1% American Indian alone 2,175 0.03% Native Hawaiian and Other
4,766,476 51.5% White alone 2,028,470 21.9% Hispanic 1,111,632 12.0% Black alone 923,546 10.0% Asian alone 332,237 3.6% Two or more races 89,847 1.0% Other race alone 8,557 0.09% American Indian alone 934 0.01% Native Hawaiian and Other
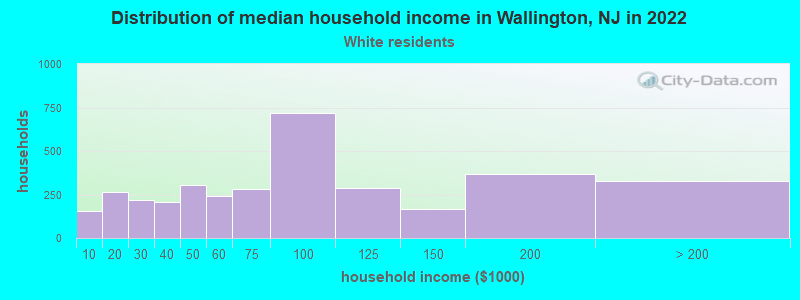
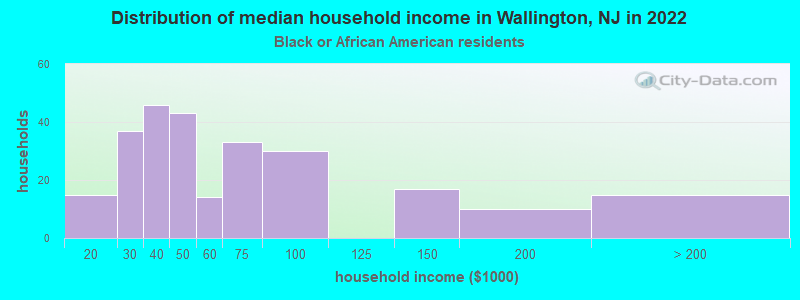
Income and house value in Wallington Median household income in 2022 $76,611 White non-Hispanic householders$64,825 Black householders$103,753 Asian householders$69,456 Some other race householders$84,095 Two or more races householders$77,214 Hispanic or Latino race householdersMedian 2022 house value $465,513 White Non-Hispanic householders$314,536 Black or African American householders $514,695 Asian householders$428,913 Two or more races householders$314,536 Hispanic or Latino householders
Median age by race in Wallington
44.7 Median age for White residents40.1 46.7 27.2 Median age for Black or African American residents23.6 45.5 -766,197,182.3 Median age for American Indian / Alaska Native residents-686,322,685.6 -753,722,794.2 34.9 Median age for Asian residents36.3 33.6 -510,460,250.5 Median age for Native Hawaiian / Pacific Islander residents-514,767,932.0 -713,070,378.3 30.1 Median age for Other race residents29.3 34.4 37.9 Median age for Two or more races residents33.6 38.7 44.5 Median age for White alone residents40.5 45.9 34.4 Median age for Hispanic or Latino residents34.4 32.5
Owner/renter occupied households by race in Wallington
House owners and renters - White residents 1,469 43.0% Owner occupied1,949 57.0% Renter occupiedHouse owners and renters - Black or African American residents 23 10.3% Owner occupied205 89.7% Renter occupiedHouse owners and renters - Asian residents 60 20.3% Owner occupied236 79.7% Renter occupiedHouse owners and renters - Other race residents 63 14.4% Owner occupied374 85.6% Renter occupiedHouse owners and renters - Two or more races residents 83 18.9% Owner occupied357 81.1% Renter occupiedHouse owners and renters - White alone residents 1,460 41.6% Owner occupied2,048 58.4% Renter occupiedHouse owners and renters - Hispanic or Latino residents 220 23.7% Owner occupied708 76.3% Renter occupied
Language usage in Wallington
English speakers - Total 32.8% of residents of Wallington speak English at home.
16.2% of residents speak Spanish at home 1,168 64.4% Speak English very well647 35.6% Speak English less than very well51.7% of residents speak other language at home 2,773 47.9% Speak English very well3,013 52.1% Speak English less than very well
English speakers - Born in the United States 67.9% of residents of Wallington speak English at home.
15.3% of residents speak Spanish at home 151 80.3% Speak English very well37 19.7% Speak English less than very well17.8% of residents speak other language at home 192 87.7% Speak English very well27 12.3% Speak English less than very well
English speakers - Native, born elsewhere 12.7% of residents of Wallington speak English at home.
56.8% of residents speak Spanish at home 31 46.3% Speak English very well36 53.7% Speak English less than very well43.2% of residents speak other language at home 13 25.5% Speak English very well38 74.5% Speak English less than very well
English speakers - Foreign-born 5.4% of residents of Wallington speak English at home.
15.4% of residents speak Spanish at home 387 44.1% Speak English very well491 55.9% Speak English less than very well79.2% of residents speak other language at home 1,645 36.4% Speak English very well2,878 63.6% Speak English less than very well
White (Caucasian) - Speak only English Native:
68.3% (2,582)Foreign-born:
5.8% (179)
White (Caucasian) - Speak another language Native:
26.5% (1,000)Foreign-born:
90.5% (2,797)
Black or African American - Speak only English Native:
90.4% (400)Foreign-born:
69.6% (24)
Black or African American - Speak another language Native:
9.6% (43)Foreign-born:
31.4% (11)
Asian - Speak only English Native:
26.8% (24)Foreign-born:
8.3% (47)
Asian - Speak another language Native:
72.3% (65)Foreign-born:
91.8% (512)
Other race - Speak only English Native:
10.4% (58)Foreign-born:
0.8% (5)
Other race - Speak another language Native:
94.5% (525)Foreign-born:
100.0% (642)
Two or more races - Speak only English Native:
40.5% (312)Foreign-born:
8.9% (63)
Two or more races - Speak another language Native:
61.8% (477)Foreign-born:
91.5% (641)
White alone - Speak only English Native:
67.8% (2,385)Foreign-born:
4.7% (178)
White alone - Speak another language Native:
30.9% (1,087)Foreign-born:
95.8% (3,594)
Hispanic or Latino - Speak only English Native:
30.0% (401)Foreign-born:
6.5% (63)
Hispanic or Latino - Speak another language Native:
71.8% (958)Foreign-born:
93.1% (895)
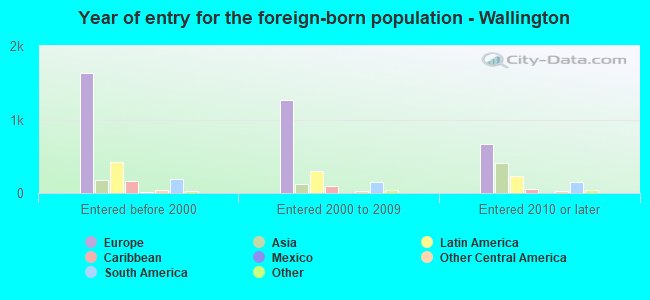
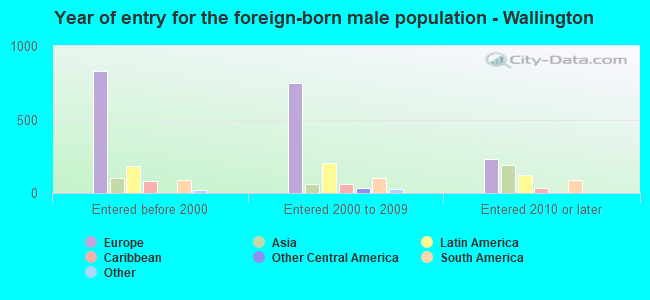
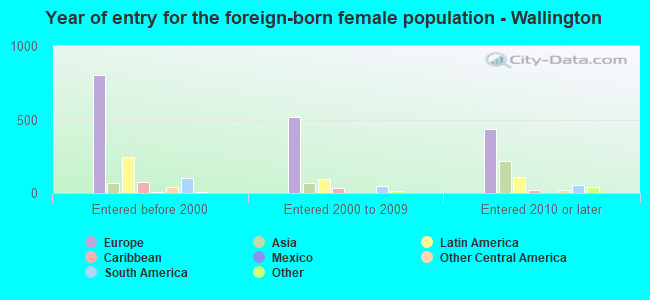
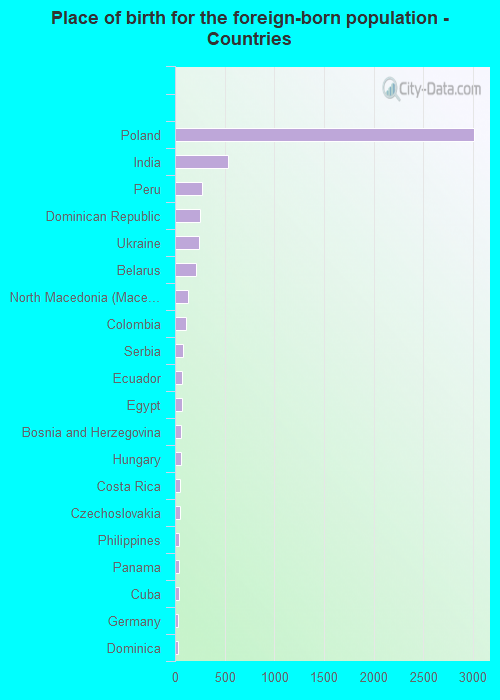
Foreign-born residents in Wallington 5,739 residents are foreign born (33.4% Europe , 7.7% Latin America , 5.4% Asia ).
This city:
48.5%New Jersey:
23.2%
Marital status for residents in Wallington Marital status - White (Caucasian) population 15 years and over
Males 32.1% Never married51.8% Now married1.9% Separated1.7% Widowed12.5% DivorcedFemales 20.8% Never married53.0% Now married1.3% Separated16.3% Widowed8.6% DivorcedWomen who gave birth in the past 12 months Now married:
64.1% (81)Unmarried:
35.9% (45)
Women who did not give birth in the past 12 months Now married:
58.8% (944)Unmarried:
41.2% (660)
Marital status - Black or African American population 15 years and over
Males 63.2% Never married36.8% Now married0.0% Separated0.0% Widowed0.0% DivorcedFemales 61.9% Never married11.2% Now married3.7% Separated10.1% Widowed13.1% DivorcedWomen who did not give birth in the past 12 months Now married:
15.2% (23)Unmarried:
84.8% (127)
Marital status - Asian population 15 years and over
Males 8.1% Never married91.9% Now married0.0% Separated0.0% Widowed0.0% DivorcedFemales 14.0% Never married66.1% Now married0.0% Separated16.4% Widowed3.4% DivorcedWomen who did not give birth in the past 12 months Now married:
76.3% (160)Unmarried:
23.7% (50)
Marital status - Other race population 15 years and over
Males 21.2% Never married78.8% Now married0.0% Separated0.0% Widowed0.0% DivorcedFemales 11.5% Never married71.0% Now married4.4% Separated0.0% Widowed13.1% DivorcedWomen who gave birth in the past 12 months Now married:
0.0% (0)Unmarried:
100.0% (39)
Women who did not give birth in the past 12 months Now married:
79.4% (272)Unmarried:
20.6% (71)
Marital status - Two or more races population 15 years and over
Males 31.3% Never married59.2% Now married0.0% Separated3.2% Widowed6.4% DivorcedFemales 22.1% Never married59.8% Now married0.0% Separated10.0% Widowed8.1% DivorcedWomen who gave birth in the past 12 months Now married:
100.0% (66)Unmarried:
0.0% (0)
Women who did not give birth in the past 12 months Now married:
46.5% (98)Unmarried:
53.5% (112)
Marital status - White alone, not Hispanic / Latino population 15 years and over
Males 31.2% Never married51.5% Now married2.2% Separated1.9% Widowed13.3% DivorcedFemales 19.9% Never married52.5% Now married1.0% Separated17.5% Widowed9.1% DivorcedWomen who gave birth in the past 12 months Now married:
54.5% (63)Unmarried:
45.5% (52)
Women who did not give birth in the past 12 months Now married:
59.7% (991)Unmarried:
40.3% (668)
Marital status - Hispanic or Latino population 15 years and over
Males 29.6% Never married65.9% Now married0.0% Separated0.0% Widowed4.6% DivorcedFemales 24.9% Never married62.9% Now married2.9% Separated3.9% Widowed5.3% DivorcedWomen who gave birth in the past 12 months Now married:
100.0% (81)Unmarried:
0.0% (0)
Women who did not give birth in the past 12 months Now married:
58.7% (340)Unmarried:
41.3% (239)
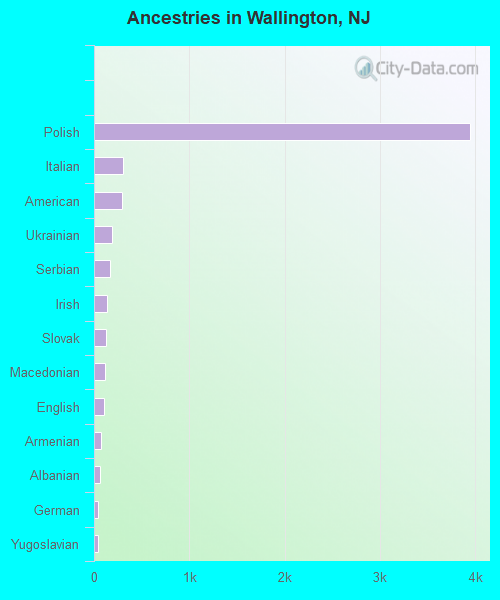
Ancestries in Wallington
3,947 48.4% Polish309 3.8% Italian289 3.5% American188 2.3% Ukrainian168 2.1% Serbian139 1.7% Irish125 1.5% Slovak117 1.4% Macedonian103 1.3% English71 0.9% Armenian58 0.7% Albanian44 0.5% German39 0.5% Yugoslavian32 0.4% African29 0.4% Egyptian25 0.3% Czech22 0.3% Lithuanian20 0.2% Russian12 0.1% Jamaican11 0.1% Greek10 0.1% Hungarian10 0.1% Portuguese5 0.06% Austrian5 0.06% European4 0.05% Scottish
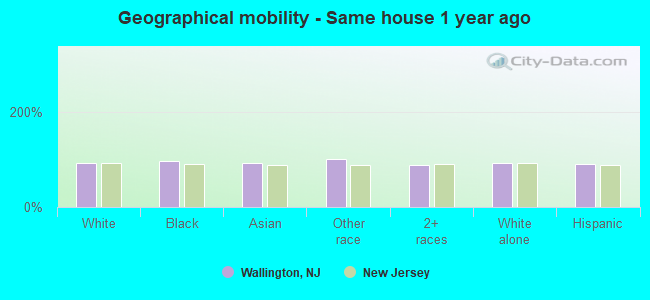
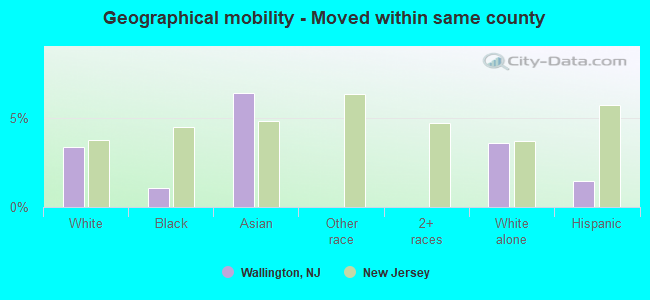
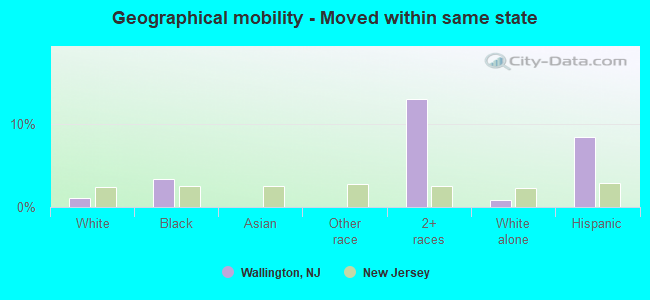
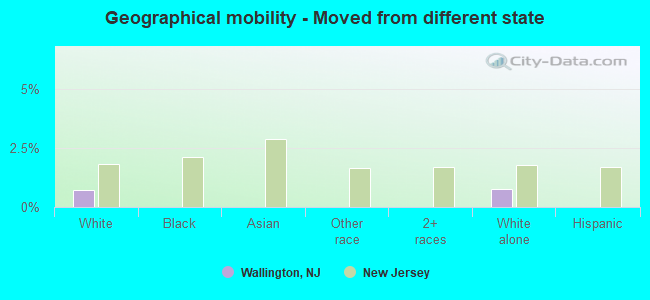
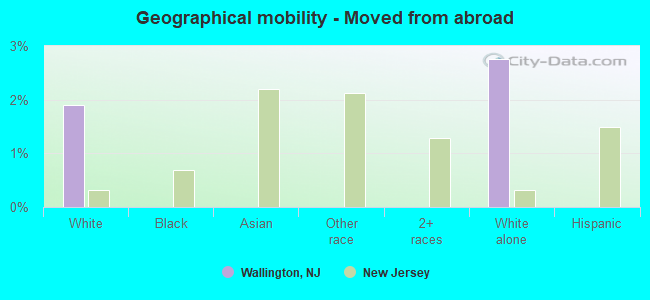
Geographical mobility in Wallington Same house 1 year ago 7,050 93.0% White (Caucasian)465 97.1% Black or African American592 91.9% Asian1,290 100.0% Other race1,456 88.7% Two or more races7,017 92.6% White alone, not Hispanic / Latino2,307 91.3% Hispanic or LatinoMoved within same county 253 3.3% White / Caucasian5 1.1% Black or African American41 6.4% Asian272 3.6% White alone, not Hispanic / Latino36 1.4% Hispanic or LatinoMoved within same state 78 1.0% White / Caucasian16 3.4% Black or African American215 13.1% Two or more races66 0.9% White alone, not Hispanic / Latino216 8.5% Hispanic or LatinoMoved from different state 54 0.7% White / Caucasian59 0.8% White alone, not Hispanic / LatinoMoved from abroad 145 1.9% White209 2.8% White alone, not Hispanic / Latino
Children Nativity (place of birth) in Wallington
Children under 6 years - Living with two parents Both parents native 211 100.0% NativeBoth parents foreign-born 245 82.4% Native52 17.6% Foreign-bornOne native, one foreign-born parent 69 100.0% NativeChildren under 6 years - Living with one parent Native parent 48 100.0% NativeForeign-born parent 82 100.0% NativeChildren 6 to 17 years - Living with two parents Both parents native 94 92.5% Native8 7.5% Foreign-bornBoth parents foreign-born 706 87.7% Native99 12.3% Foreign-bornOne native, one foreign-born parent 85 100.0% NativeChildren 6 to 17 years - Living with one parent Foreign-born parent 353 65.6% Native185 34.4% Foreign-born
Grandparents responsible for own grandchildren in Wallington
Grandparents (30 to 59 years) White / Caucasian 10 23.6% Responsible for grandchildren34 76.4% Not responsible for grandchildrenOther race 27 100.0% Not responsible for grandchildrenWhite alone, not Hispanic / Latino 12 22.3% Responsible for grandchildren41 77.7% Not responsible for grandchildren
Grandparents (60 years and over) White / Caucasian 23 100.0% Not responsible for grandchildrenOther race 35 100.0% Not responsible for grandchildrenWhite alone, not Hispanic / Latino 26 100.0% Not responsible for grandchildren