Races in Wanaque, New Jersey (NJ) Detailed Stats
Data:
Races - White alone (%)
Races - White alone (% change since 2000)
Races - Black alone (%)
Races - Black alone (% change since 2000)
Races - American Indian alone (%)
Races - American Indian alone (% change since 2000)
Races - Asian alone (%)
Races - Asian alone (% change since 2000)
Races - Hispanic (%)
Races - Hispanic (% change since 2000)
Races - Native Hawaiian and Other Pacific Islander alone (%)
Races - Native Hawaiian and Other Pacific Islander alone (% change since 2000)
Races - Two or more races(%)
Races - Two or more races(% change since 2000)
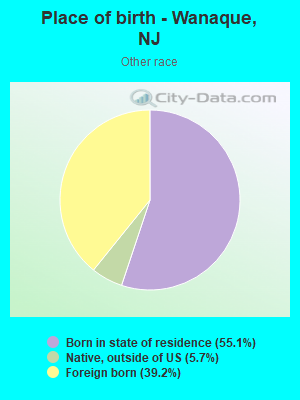
Races - Other race alone (%)
Races - Other race alone (% change since 2000)
Racial diversity
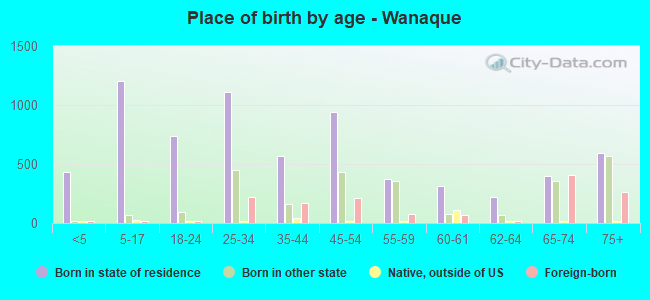
Place of birth - Born in state of residence (%)
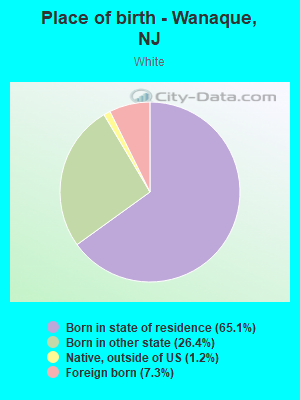
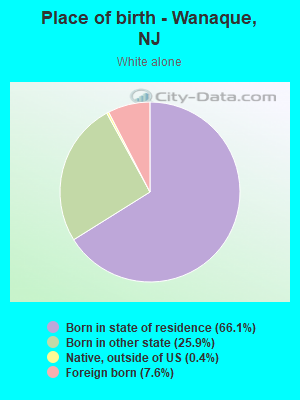
Place of birth - Born in state of residence (%) - White
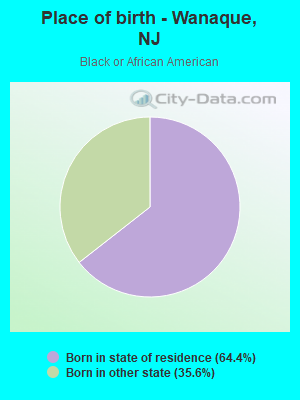
Place of birth - Born in state of residence (%) - Black or African American
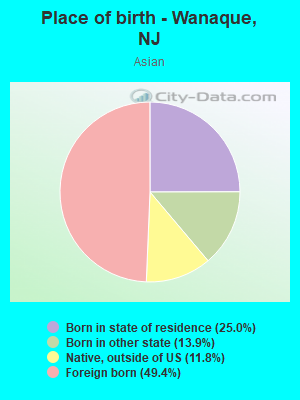
Place of birth - Born in state of residence (%) - Asian
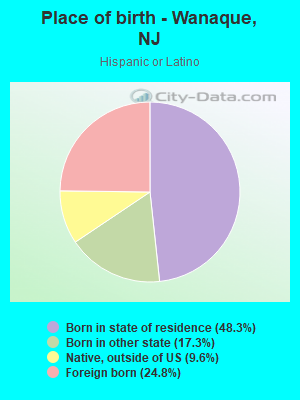
Place of birth - Born in state of residence (%) - Hispanic or Latino
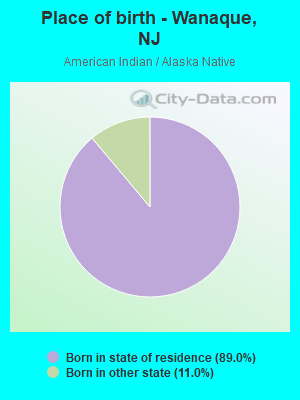
Place of birth - Born in state of residence (%) - American Indian and Alaska Native
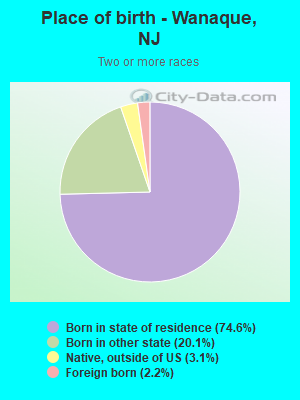
Place of birth - Born in state of residence (%) - Multirace
Place of birth - Born in state of residence (%) - Other Race
Place of birth - Born in other state (%)
Place of birth - Born in other state (%) - White
Place of birth - Born in other state (%) - Black or African American
Place of birth - Born in other state (%) - Asian
Place of birth - Born in other state (%) - Hispanic or Latino
Place of birth - Born in other state (%) - American Indian and Alaska Native
Place of birth - Born in other state (%) - Multirace
Place of birth - Born in other state (%) - Other Race
Place of birth - Native, outside of US (%)
Place of birth - Native, outside of US (%) - White
Place of birth - Native, outside of US (%) - Black or African American
Place of birth - Native, outside of US (%) - Asian
Place of birth - Native, outside of US (%) - Hispanic or Latino
Place of birth - Native, outside of US (%) - American Indian and Alaska Native
Place of birth - Native, outside of US (%) - Multirace
Place of birth - Native, outside of US (%) - Other Race
Place of birth - Foreign born (%)
Place of birth - Foreign born (%) - White
Place of birth - Foreign born (%) - Black or African American
Place of birth - Foreign born (%) - Asian
Place of birth - Foreign born (%) - Hispanic or Latino
Place of birth - Foreign born (%) - American Indian and Alaska Native
Place of birth - Foreign born (%) - Multirace
Place of birth - Foreign born (%) - Other Race
Residents speaking English at home (%)
Residents speaking English at home - Born in the United States (%)
Residents speaking English at home - Native, born elsewhere (%)
Residents speaking English at home - Foreign born (%)
Residents speaking Spanish at home (%)
Residents speaking Spanish at home - Born in the United States (%)
Residents speaking Spanish at home - Native, born elsewhere (%)
Residents speaking Spanish at home - Foreign born (%)
Residents speaking other language at home (%)
Residents speaking other language at home - Born in the United States (%)
Residents speaking other language at home - Native, born elsewhere (%)
Residents speaking other language at home - Foreign born (%)
Marital status - Never married (%)
Marital status - Now married (%)
Marital status - Separated (%)
Marital status - Widowed (%)
Marital status - Divorced (%)
Ancestries Reported - Arab (%)
Ancestries Reported - Czech (%)
Ancestries Reported - Danish (%)
Ancestries Reported - Dutch (%)
Ancestries Reported - English (%)
Ancestries Reported - French (%)
Ancestries Reported - French Canadian (%)
Ancestries Reported - German (%)
Ancestries Reported - Greek (%)
Ancestries Reported - Hungarian (%)
Ancestries Reported - Irish (%)
Ancestries Reported - Italian (%)
Ancestries Reported - Lithuanian (%)
Ancestries Reported - Norwegian (%)
Ancestries Reported - Polish (%)
Ancestries Reported - Portuguese (%)
Ancestries Reported - Russian (%)
Ancestries Reported - Scotch-Irish (%)
Ancestries Reported - Scottish (%)
Ancestries Reported - Slovak (%)
Ancestries Reported - Subsaharan African (%)
Ancestries Reported - Swedish (%)
Ancestries Reported - Swiss (%)
Ancestries Reported - Ukrainian (%)
Ancestries Reported - United States (%)
Ancestries Reported - Welsh (%)
Ancestries Reported - West Indian (%)
Ancestries Reported - Other (%)
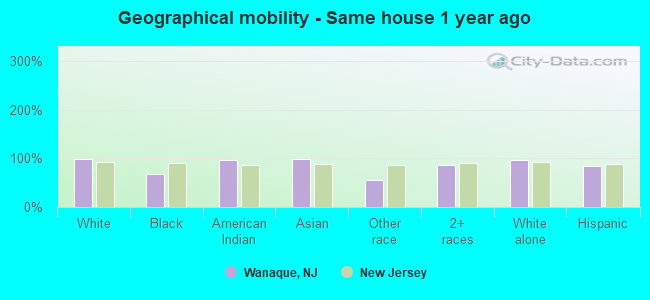
Geographical mobility - Same house 1 year ago (%)
Geographical mobility - Same house 1 year ago (%) - White
Geographical mobility - Same house 1 year ago (%) - Black or African American
Geographical mobility - Same house 1 year ago (%) - Asian
Geographical mobility - Same house 1 year ago (%) - Hispanic or Latino
Geographical mobility - Same house 1 year ago (%) - American Indian and Alaska Native
Geographical mobility - Same house 1 year ago (%) - Multirace
Geographical mobility - Same house 1 year ago (%) - Other Race
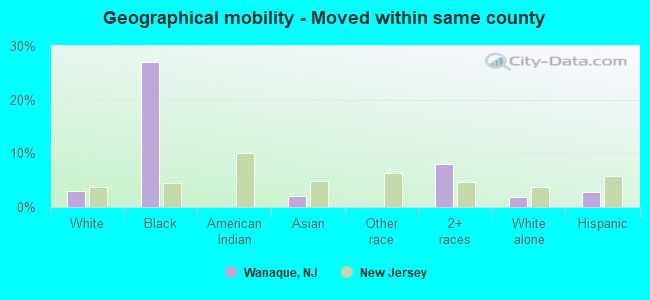
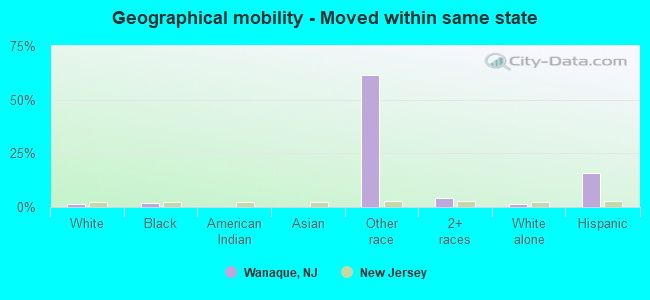
Geographical mobility - Moved within same county (%)
Geographical mobility - Moved within same county (%) - White
Geographical mobility - Moved within same county (%) - Black or African American
Geographical mobility - Moved within same county (%) - Asian
Geographical mobility - Moved within same county (%) - Hispanic or Latino
Geographical mobility - Moved within same county (%) - American Indian and Alaska Native
Geographical mobility - Moved within same county (%) - Multirace
Geographical mobility - Moved within same county (%) - Other Race
Geographical mobility - Moved from different county within same state (%)
Geographical mobility - Moved from different county within same state (%) - White
Geographical mobility - Moved from different county within same state (%) - Black or African American
Geographical mobility - Moved from different county within same state (%) - Asian
Geographical mobility - Moved from different county within same state (%) - Hispanic or Latino
Geographical mobility - Moved from different county within same state (%) - American Indian and Alaska Native
Geographical mobility - Moved from different county within same state (%) - Multirace
Geographical mobility - Moved from different county within same state (%) - Other Race
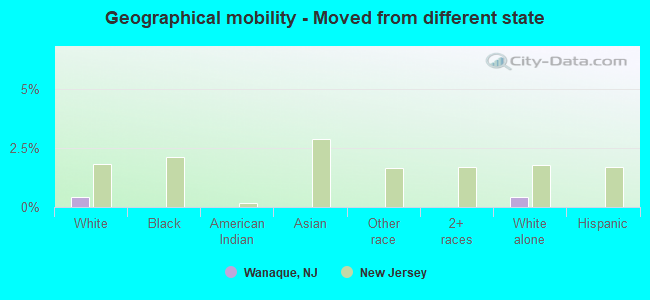
Geographical mobility - Moved from different state (%)
Geographical mobility - Moved from different state (%) - White
Geographical mobility - Moved from different state (%) - Black or African American
Geographical mobility - Moved from different state (%) - Asian
Geographical mobility - Moved from different state (%) - Hispanic or Latino
Geographical mobility - Moved from different state (%) - American Indian and Alaska Native
Geographical mobility - Moved from different state (%) - Multirace
Geographical mobility - Moved from different state (%) - Other Race
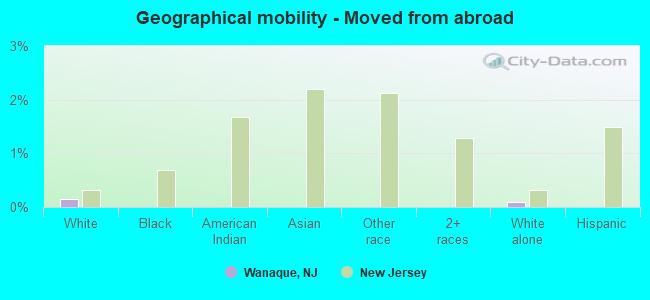
Geographical mobility - Moved from abroad (%)
Geographical mobility - Moved from abroad (%) - White
Geographical mobility - Moved from abroad (%) - Black or African American
Geographical mobility - Moved from abroad (%) - Asian
Geographical mobility - Moved from abroad (%) - Hispanic or Latino
Geographical mobility - Moved from abroad (%) - American Indian and Alaska Native
Geographical mobility - Moved from abroad (%) - Multirace
Geographical mobility - Moved from abroad (%) - Other Race
Place of birth for the foreign-born population - Ireland (%)
Place of birth for the foreign-born population - Denmark (%)
Place of birth for the foreign-born population - Norway (%)
Place of birth for the foreign-born population - Sweden (%)
Place of birth for the foreign-born population - United Kingdom (%)
Place of birth for the foreign-born population - England (%)
Place of birth for the foreign-born population - Scotland (%)
Place of birth for the foreign-born population - Other Northern Europe (%)
Place of birth for the foreign-born population - Austria (%)
Place of birth for the foreign-born population - Belgium (%)
Place of birth for the foreign-born population - France (%)
Place of birth for the foreign-born population - Germany (%)
Place of birth for the foreign-born population - Netherlands (%)
Place of birth for the foreign-born population - Switzerland (%)
Place of birth for the foreign-born population - Other Western Europe (%)
Place of birth for the foreign-born population - Greece (%)
Place of birth for the foreign-born population - Italy (%)
Place of birth for the foreign-born population - Portugal (%)
Place of birth for the foreign-born population - Spain (%)
Place of birth for the foreign-born population - Other Southern Europe (%)
Place of birth for the foreign-born population - Albania (%)
Place of birth for the foreign-born population - Belarus (%)
Place of birth for the foreign-born population - Bosnia and Herzegovina (%)
Place of birth for the foreign-born population - Bulgaria (%)
Place of birth for the foreign-born population - Croatia (%)
Place of birth for the foreign-born population - Czechoslovakia (%)
Place of birth for the foreign-born population - Hungary (%)
Place of birth for the foreign-born population - Latvia (%)
Place of birth for the foreign-born population - Lithuania (%)
Place of birth for the foreign-born population - North Macedonia (Macedonia) (%)
Place of birth for the foreign-born population - Moldova (%)
Place of birth for the foreign-born population - Poland (%)
Place of birth for the foreign-born population - Romania (%)
Place of birth for the foreign-born population - Russia (%)
Place of birth for the foreign-born population - Serbia (%)
Place of birth for the foreign-born population - Ukraine (%)
Place of birth for the foreign-born population - Other Eastern Europe (%)
Place of birth for the foreign-born population - China (%)
Place of birth for the foreign-born population - Hong Kong (%)
Place of birth for the foreign-born population - Taiwan (%)
Place of birth for the foreign-born population - Japan (%)
Place of birth for the foreign-born population - Korea (%)
Place of birth for the foreign-born population - Other Eastern Asia (%)
Place of birth for the foreign-born population - Afghanistan (%)
Place of birth for the foreign-born population - Bangladesh (%)
Place of birth for the foreign-born population - India (%)
Place of birth for the foreign-born population - Iran (%)
Place of birth for the foreign-born population - Kazakhstan (%)
Place of birth for the foreign-born population - Nepal (%)
Place of birth for the foreign-born population - Pakistan (%)
Place of birth for the foreign-born population - Sri Lanka (%)
Place of birth for the foreign-born population - Uzbekistan (%)
Place of birth for the foreign-born population - Other South Central Asia (%)
Place of birth for the foreign-born population - Burma (%)
Place of birth for the foreign-born population - Cambodia (%)
Place of birth for the foreign-born population - Indonesia (%)
Place of birth for the foreign-born population - Laos (%)
Place of birth for the foreign-born population - Malaysia (%)
Place of birth for the foreign-born population - Philippines (%)
Place of birth for the foreign-born population - Singapore (%)
Place of birth for the foreign-born population - Thailand (%)
Place of birth for the foreign-born population - Vietnam (%)
Place of birth for the foreign-born population - Other South Eastern Asia (%)
Place of birth for the foreign-born population - Armenia (%)
Place of birth for the foreign-born population - Iraq (%)
Place of birth for the foreign-born population - Israel (%)
Place of birth for the foreign-born population - Jordan (%)
Place of birth for the foreign-born population - Kuwait (%)
Place of birth for the foreign-born population - Lebanon (%)
Place of birth for the foreign-born population - Saudi Arabia (%)
Place of birth for the foreign-born population - Syria (%)
Place of birth for the foreign-born population - Turkey (%)
Place of birth for the foreign-born population - Yemen (%)
Place of birth for the foreign-born population - Other Western Asia (%)
Place of birth for the foreign-born population - Eritrea (%)
Place of birth for the foreign-born population - Ethiopia (%)
Place of birth for the foreign-born population - Kenya (%)
Place of birth for the foreign-born population - Somalia (%)
Place of birth for the foreign-born population - Uganda (%)
Place of birth for the foreign-born population - Zimbabwe (%)
Place of birth for the foreign-born population - Other Eastern Africa (%)
Place of birth for the foreign-born population - Cameroon (%)
Place of birth for the foreign-born population - Congo (%)
Place of birth for the foreign-born population - Democratic Republic of Congo (Zaire) (%)
Place of birth for the foreign-born population - Other Middle Africa (%)
Place of birth for the foreign-born population - Egypt (%)
Place of birth for the foreign-born population - Morocco (%)
Place of birth for the foreign-born population - Sudan (%)
Place of birth for the foreign-born population - Other Northern Africa (%)
Place of birth for the foreign-born population - South Africa (%)
Place of birth for the foreign-born population - Other Southern Africa (%)
Place of birth for the foreign-born population - Cabo Verde (%)
Place of birth for the foreign-born population - Ghana (%)
Place of birth for the foreign-born population - Liberia (%)
Place of birth for the foreign-born population - Nigeria (%)
Place of birth for the foreign-born population - Senegal (%)
Place of birth for the foreign-born population - Sierra Leone (%)
Place of birth for the foreign-born population - Other Western Africa (%)
Place of birth for the foreign-born population - Australia (%)
Place of birth for the foreign-born population - New Zealand (%)
Place of birth for the foreign-born population - Fiji (%)
Place of birth for the foreign-born population - Micronesia (%)
Place of birth for the foreign-born population - Bahamas (%)
Place of birth for the foreign-born population - Barbados (%)
Place of birth for the foreign-born population - Cuba (%)
Place of birth for the foreign-born population - Dominica (%)
Place of birth for the foreign-born population - Dominican Republic (%)
Place of birth for the foreign-born population - Grenada (%)
Place of birth for the foreign-born population - Haiti (%)
Place of birth for the foreign-born population - Jamaica (%)
Place of birth for the foreign-born population - St. Vincent and the Grenadines (%)
Place of birth for the foreign-born population - Trinidad and Tobago (%)
Place of birth for the foreign-born population - West Indies (%)
Place of birth for the foreign-born population - Other Caribbean (%)
Place of birth for the foreign-born population - Belize (%)
Place of birth for the foreign-born population - Costa Rica (%)
Place of birth for the foreign-born population - El Salvador (%)
Place of birth for the foreign-born population - Guatemala (%)
Place of birth for the foreign-born population - Honduras (%)
Place of birth for the foreign-born population - Mexico (%)
Place of birth for the foreign-born population - Nicaragua (%)
Place of birth for the foreign-born population - Panama (%)
Place of birth for the foreign-born population - Other Central America (%)
Place of birth for the foreign-born population - Argentina (%)
Place of birth for the foreign-born population - Bolivia (%)
Place of birth for the foreign-born population - Brazil (%)
Place of birth for the foreign-born population - Chile (%)
Place of birth for the foreign-born population - Colombia (%)
Place of birth for the foreign-born population - Ecuador (%)
Place of birth for the foreign-born population - Guyana (%)
Place of birth for the foreign-born population - Peru (%)
Place of birth for the foreign-born population - Uruguay (%)
Place of birth for the foreign-born population - Venezuela (%)
Place of birth for the foreign-born population - Other South America (%)
Place of birth for the foreign-born population - Canada (%)
Place of birth for the foreign-born population - Other Northern America (%)
Place of birth for the foreign-born population - Other (%)
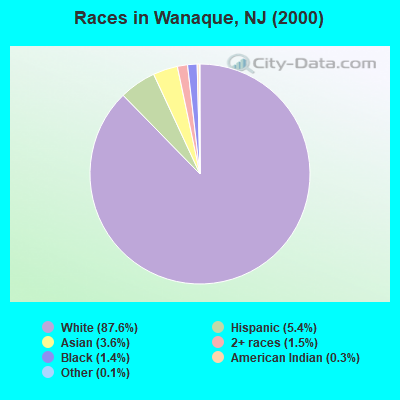
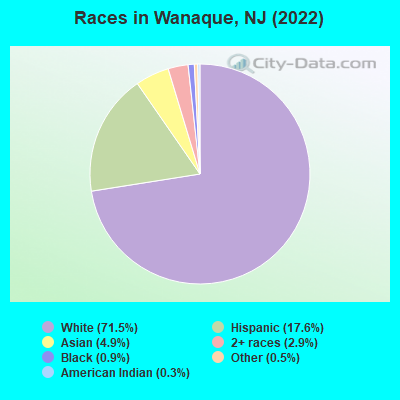
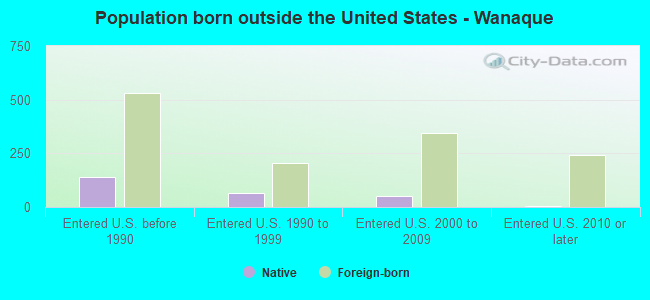
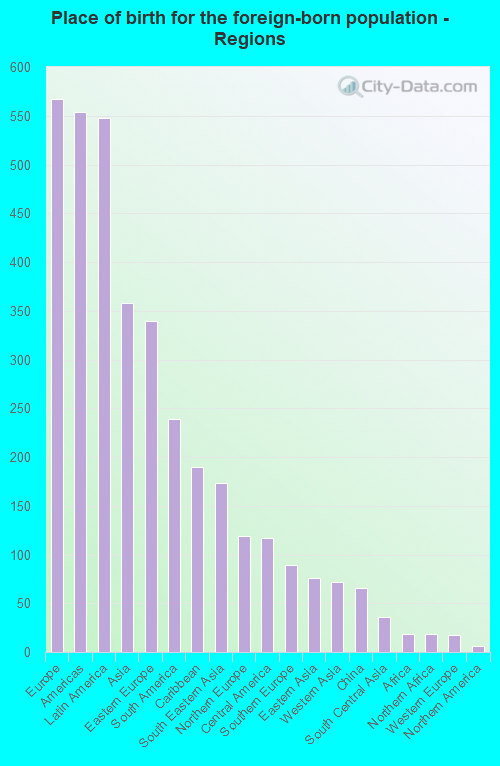
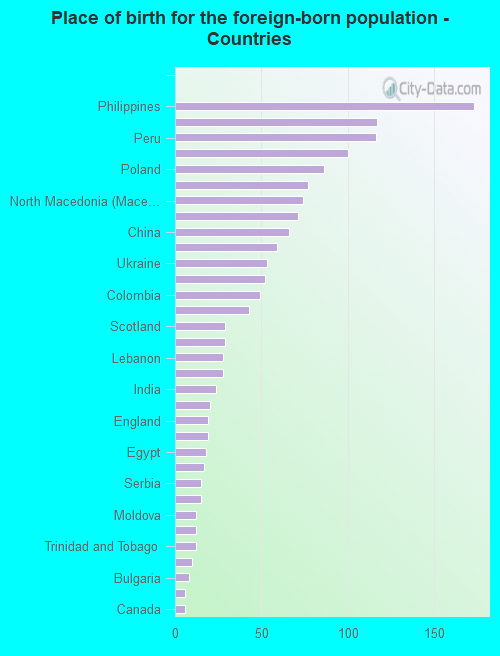
According to 2022 data, the most numerous races in Wanaque, NJ are White alone (7,922 residents), Hispanic (1,956 residents), and Black alone (104 residents). 78.1% of Wanaque residents speak English at home. 13.5% of Wanaque, NJ residents are foreign-born (5.0% born in Europe, 4.8% born in Latin America, 3.1% born in Asia), which is 70.2% less than the foreign-born rate of 23.0% across the entire state of New Jersey.
Race distribution in Wanaque
2000 2022
5,557,209 66.0% White alone 1,117,191 13.3% Hispanic 1,096,171 13.0% Black alone 477,012 5.7% Asian alone 133,689 1.6% Two or more races 19,565 0.2% Other race alone 11,338 0.1% American Indian alone 2,175 0.03% Native Hawaiian and Other
4,766,476 51.5% White alone 2,028,470 21.9% Hispanic 1,111,632 12.0% Black alone 923,546 10.0% Asian alone 332,237 3.6% Two or more races 89,847 1.0% Other race alone 8,557 0.09% American Indian alone 934 0.01% Native Hawaiian and Other
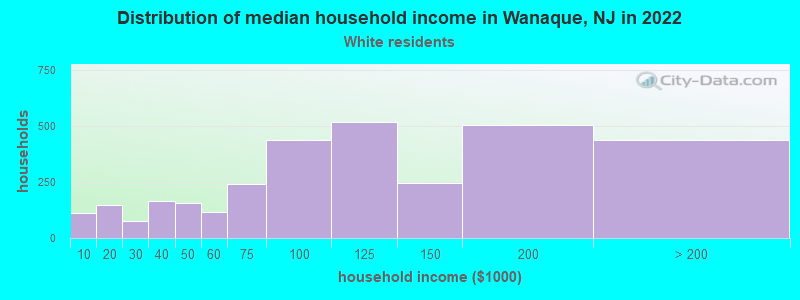
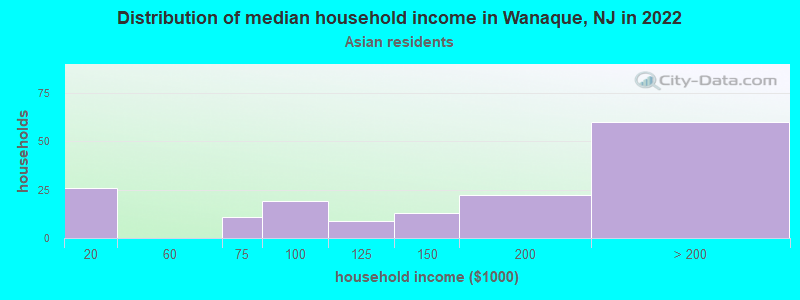
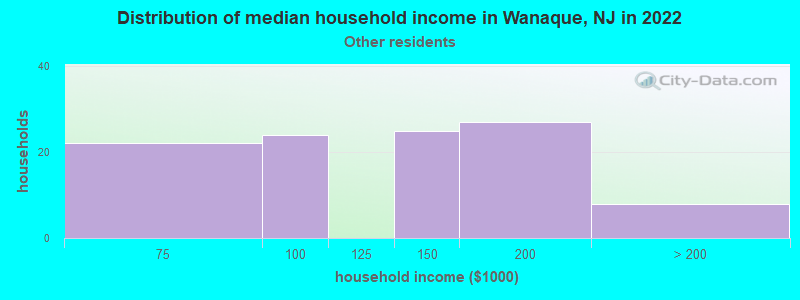
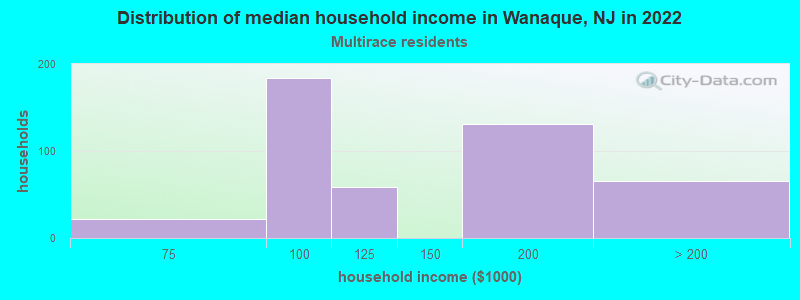
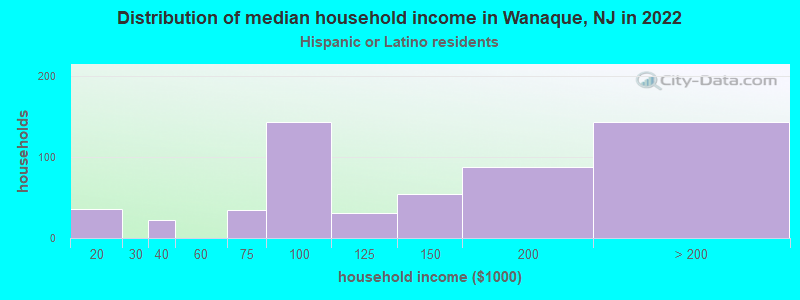
Income and house value in Wanaque Median household income in 2022 $100,532 White non-Hispanic householders$199,625 Asian householders$118,250 Some other race householders$140,831 Two or more races householders$133,895 Hispanic or Latino race householdersMedian 2022 house value $365,413 White Non-Hispanic householders$292,628 Black or African American householders$478,847 American Indian or Alaska Native householders $387,972 Asian householders$379,034 Some other race householders$292,628 Two or more races householders$384,780 Hispanic or Latino householders
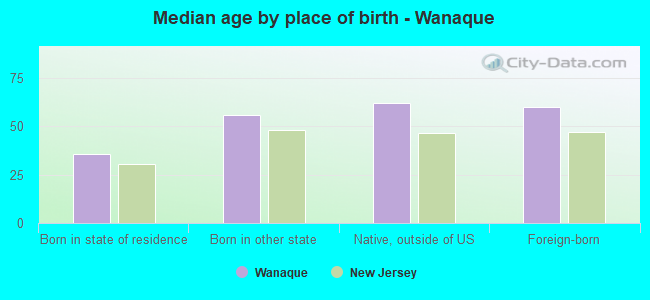
Median age by race in Wanaque
54.6 Median age for White residents51.0 57.4 59.9 Median age for Black or African American residents73.2 49.6 84.0 Median age for American Indian / Alaska Native residents-655,394,524.3 -944,444,443.5 40.2 Median age for Asian residents43.9 39.3 -804,177,544.9 Median age for Native Hawaiian / Pacific Islander residents-860,335,194.7 -713,070,378.3 31.5 Median age for Other race residents26.4 34.6 30.5 Median age for Two or more races residents32.9 18.2 51.7 Median age for White alone residents49.4 53.4 32.3 Median age for Hispanic or Latino residents31.4 36.3
Owner/renter occupied households by race in Wanaque
House owners and renters - White residents 2,679 82.9% Owner occupied554 17.1% Renter occupiedHouse owners and renters - Black or African American residents 23 100.0% Owner occupiedHouse owners and renters - American Indian / Alaska Native residents 6 100.0% Owner occupiedHouse owners and renters - Asian residents 142 82.3% Owner occupied30 17.7% Renter occupiedHouse owners and renters - Other race residents 131 100.0% Owner occupiedHouse owners and renters - Two or more races residents 322 62.1% Owner occupied197 37.9% Renter occupiedHouse owners and renters - White alone residents 2,645 79.2% Owner occupied696 20.8% Renter occupiedHouse owners and renters - Hispanic or Latino residents 466 73.1% Owner occupied172 26.9% Renter occupied
Language usage in Wanaque
English speakers - Total 78.1% of residents of Wanaque speak English at home.
12.4% of residents speak Spanish at home 1,070 81.0% Speak English very well251 19.0% Speak English less than very well8.4% of residents speak other language at home 582 64.7% Speak English very well318 35.3% Speak English less than very well
English speakers - Born in the United States 87.4% of residents of Wanaque speak English at home.
10.0% of residents speak Spanish at home 262 100.0% Speak English very well1.2% of residents speak other language at home 32 100.0% Speak English less than very well
English speakers - Native, born elsewhere 16.7% of residents of Wanaque speak English at home.
74.6% of residents speak Spanish at home 67 34.0% Speak English very well130 66.0% Speak English less than very well8.7% of residents speak other language at home 23 100.0% Speak English very well
English speakers - Foreign-born 17.0% of residents of Wanaque speak English at home.
29.9% of residents speak Spanish at home 306 72.2% Speak English very well118 27.8% Speak English less than very well48.9% of residents speak other language at home 407 58.7% Speak English very well286 41.3% Speak English less than very well
White (Caucasian) - Speak only English Native:
98.5% (6,888)Foreign-born:
32.0% (181)
White (Caucasian) - Speak another language Native:
5.3% (370)Foreign-born:
69.7% (396)
Asian - Speak only English Native:
97.0% (178)Foreign-born:
6.1% (18)
Asian - Speak another language Native:
16.8% (31)Foreign-born:
94.4% (274)
Other race - Speak another language Native:
29.0% (69)Foreign-born:
98.3% (181)
Two or more races - Speak another language Native:
51.9% (594)Foreign-born:
100.0% (29)
White alone - Speak only English Native:
96.5% (6,932)Foreign-born:
26.7% (162)
White alone - Speak another language Native:
2.8% (203)Foreign-born:
66.6% (403)
Hispanic or Latino - Speak only English Native:
33.2% (437)Foreign-born:
7.6% (37)
Hispanic or Latino - Speak another language Native:
67.2% (884)Foreign-born:
92.8% (454)
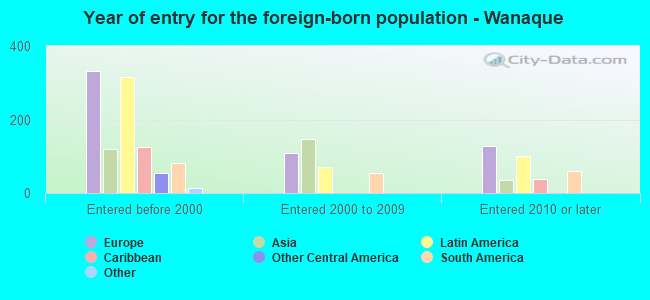
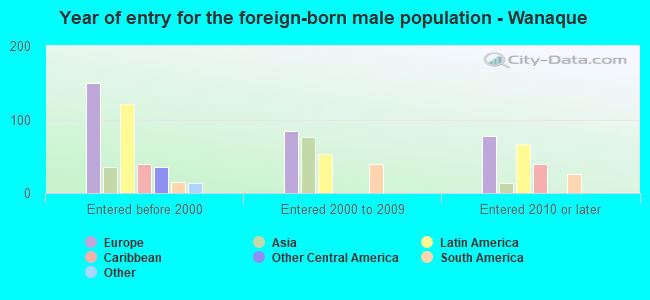
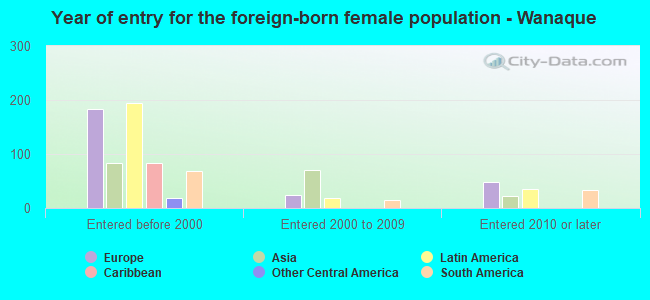
Foreign-born residents in Wanaque 1,498 residents are foreign born (5.0% Europe , 4.8% Latin America , 3.1% Asia ).
This city:
13.5%New Jersey:
23.2%
Marital status for residents in Wanaque Marital status - White (Caucasian) population 15 years and over
Males 39.6% Never married48.2% Now married0.5% Separated2.0% Widowed9.7% DivorcedFemales 28.8% Never married46.0% Now married0.6% Separated14.5% Widowed10.1% DivorcedWomen who gave birth in the past 12 months Now married:
93.8% (47)Unmarried:
6.2% (3)
Women who did not give birth in the past 12 months Now married:
34.7% (436)Unmarried:
65.3% (820)
Marital status - Black or African American population 15 years and over
Males 68.8% Never married0.0% Now married0.0% Separated0.0% Widowed31.2% DivorcedFemales 52.6% Never married0.0% Now married0.0% Separated15.4% Widowed32.1% DivorcedWomen who did not give birth in the past 12 months Now married:
0.0% (0)Unmarried:
100.0% (37)
Marital status - American Indian / Alaska Native population 15 years and over
Males 100.0% Never married0.0% Now married0.0% Separated0.0% Widowed0.0% DivorcedFemales 100.0% Never married0.0% Now married0.0% Separated0.0% Widowed0.0% DivorcedWomen who did not give birth in the past 12 months Now married:
0.0% (0)Unmarried:
100.0% (5)
Marital status - Asian population 15 years and over
Males 14.6% Never married69.3% Now married12.1% Separated4.0% Widowed0.0% DivorcedFemales 18.0% Never married76.5% Now married5.5% Separated0.0% Widowed0.0% DivorcedWomen who gave birth in the past 12 months Now married:
100.0% (14)Unmarried:
0.0% (0)
Women who did not give birth in the past 12 months Now married:
67.3% (72)Unmarried:
32.7% (35)
Marital status - Other race population 15 years and over
Males 28.3% Never married68.8% Now married0.0% Separated0.0% Widowed2.9% DivorcedFemales 18.7% Never married64.5% Now married0.0% Separated7.5% Widowed9.3% DivorcedWomen who did not give birth in the past 12 months Now married:
69.7% (47)Unmarried:
30.3% (21)
Marital status - Two or more races population 15 years and over
Males 42.0% Never married58.0% Now married0.0% Separated0.0% Widowed0.0% DivorcedFemales 50.5% Never married43.2% Now married0.0% Separated6.3% Widowed0.0% DivorcedWomen who gave birth in the past 12 months Now married:
0.0% (0)Unmarried:
100.0% (11)
Women who did not give birth in the past 12 months Now married:
47.7% (112)Unmarried:
52.3% (123)
Marital status - White alone, not Hispanic / Latino population 15 years and over
Males 39.6% Never married47.9% Now married0.4% Separated2.2% Widowed9.9% DivorcedFemales 29.8% Never married45.4% Now married0.7% Separated15.5% Widowed8.7% DivorcedWomen who gave birth in the past 12 months Now married:
93.8% (58)Unmarried:
6.2% (4)
Women who did not give birth in the past 12 months Now married:
34.7% (510)Unmarried:
65.3% (958)
Marital status - Hispanic or Latino population 15 years and over
Males 34.8% Never married59.8% Now married1.0% Separated0.0% Widowed4.3% DivorcedFemales 24.5% Never married53.8% Now married0.0% Separated5.9% Widowed15.8% DivorcedWomen who gave birth in the past 12 months Now married:
0.0% (0)Unmarried:
100.0% (7)
Women who did not give birth in the past 12 months Now married:
53.4% (151)Unmarried:
46.6% (132)
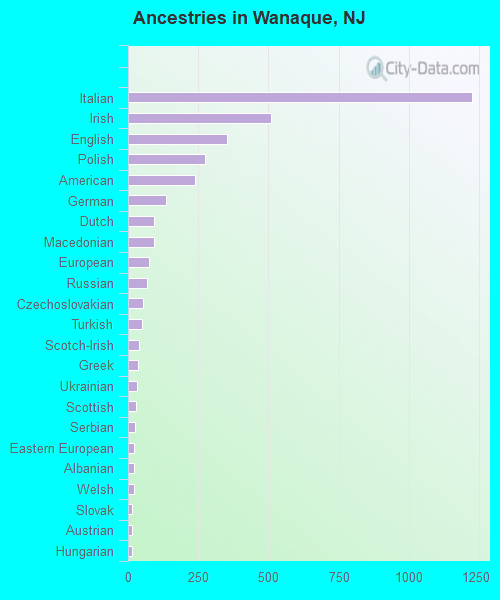
Ancestries in Wanaque
1,224 21.3% Italian509 8.9% Irish354 6.2% English274 4.8% Polish239 4.2% American134 2.3% German94 1.6% Dutch93 1.6% Macedonian73 1.3% European67 1.2% Russian55 1.0% Czechoslovakian49 0.9% Turkish38 0.7% Scotch-Irish34 0.6% Greek31 0.5% Ukrainian28 0.5% Scottish26 0.5% Serbian21 0.4% Eastern European20 0.3% Albanian20 0.3% Welsh16 0.3% Slovak13 0.2% Austrian13 0.2% Hungarian10 0.2% Lebanese10 0.2% Norwegian9 0.2% Czech8 0.1% Scandinavian6 0.1% Bulgarian6 0.1% Romanian
Children Nativity (place of birth) in Wanaque
Children under 6 years - Living with two parents Both parents native 350 100.0% NativeBoth parents foreign-born 68 100.0% NativeOne native, one foreign-born parent 171 100.0% NativeChildren under 6 years - Living with one parent Native parent 87 100.0% NativeChildren 6 to 17 years - Living with two parents Both parents native 523 100.0% NativeBoth parents foreign-born 98 100.0% NativeOne native, one foreign-born parent 189 100.0% NativeChildren 6 to 17 years - Living with one parent Native parent 191 100.0% NativeForeign-born parent 35 52.3% Native32 47.7% Foreign-born
Grandparents responsible for own grandchildren in Wanaque
Grandparents (30 to 59 years) White / Caucasian 7 11.6% Responsible for grandchildren53 88.4% Not responsible for grandchildrenWhite alone, not Hispanic / Latino 8 10.6% Responsible for grandchildren70 89.4% Not responsible for grandchildrenGrandparents (60 years and over) White / Caucasian 50 86.1% Responsible for grandchildren8 13.9% Not responsible for grandchildrenWhite alone, not Hispanic / Latino 57 86.4% Responsible for grandchildren9 13.6% Not responsible for grandchildren