Races in Warrenville, Illinois (IL) Detailed Stats
Data:
Races - White alone (%)
Races - White alone (% change since 2000)
Races - Black alone (%)
Races - Black alone (% change since 2000)
Races - American Indian alone (%)
Races - American Indian alone (% change since 2000)
Races - Asian alone (%)
Races - Asian alone (% change since 2000)
Races - Hispanic (%)
Races - Hispanic (% change since 2000)
Races - Native Hawaiian and Other Pacific Islander alone (%)
Races - Native Hawaiian and Other Pacific Islander alone (% change since 2000)
Races - Two or more races(%)
Races - Two or more races(% change since 2000)
Races - Other race alone (%)
Races - Other race alone (% change since 2000)
Racial diversity
Place of birth - Born in state of residence (%)
Place of birth - Born in state of residence (%) - White
Place of birth - Born in state of residence (%) - Black or African American
Place of birth - Born in state of residence (%) - Asian
Place of birth - Born in state of residence (%) - Hispanic or Latino
Place of birth - Born in state of residence (%) - American Indian and Alaska Native
Place of birth - Born in state of residence (%) - Multirace
Place of birth - Born in state of residence (%) - Other Race
Place of birth - Born in other state (%)
Place of birth - Born in other state (%) - White
Place of birth - Born in other state (%) - Black or African American
Place of birth - Born in other state (%) - Asian
Place of birth - Born in other state (%) - Hispanic or Latino
Place of birth - Born in other state (%) - American Indian and Alaska Native
Place of birth - Born in other state (%) - Multirace
Place of birth - Born in other state (%) - Other Race
Place of birth - Native, outside of US (%)
Place of birth - Native, outside of US (%) - White
Place of birth - Native, outside of US (%) - Black or African American
Place of birth - Native, outside of US (%) - Asian
Place of birth - Native, outside of US (%) - Hispanic or Latino
Place of birth - Native, outside of US (%) - American Indian and Alaska Native
Place of birth - Native, outside of US (%) - Multirace
Place of birth - Native, outside of US (%) - Other Race
Place of birth - Foreign born (%)
Place of birth - Foreign born (%) - White
Place of birth - Foreign born (%) - Black or African American
Place of birth - Foreign born (%) - Asian
Place of birth - Foreign born (%) - Hispanic or Latino
Place of birth - Foreign born (%) - American Indian and Alaska Native
Place of birth - Foreign born (%) - Multirace
Place of birth - Foreign born (%) - Other Race
Residents speaking English at home (%)
Residents speaking English at home - Born in the United States (%)
Residents speaking English at home - Native, born elsewhere (%)
Residents speaking English at home - Foreign born (%)
Residents speaking Spanish at home (%)
Residents speaking Spanish at home - Born in the United States (%)
Residents speaking Spanish at home - Native, born elsewhere (%)
Residents speaking Spanish at home - Foreign born (%)
Residents speaking other language at home (%)
Residents speaking other language at home - Born in the United States (%)
Residents speaking other language at home - Native, born elsewhere (%)
Residents speaking other language at home - Foreign born (%)
Marital status - Never married (%)
Marital status - Now married (%)
Marital status - Separated (%)
Marital status - Widowed (%)
Marital status - Divorced (%)
Ancestries Reported - Arab (%)
Ancestries Reported - Czech (%)
Ancestries Reported - Danish (%)
Ancestries Reported - Dutch (%)
Ancestries Reported - English (%)
Ancestries Reported - French (%)
Ancestries Reported - French Canadian (%)
Ancestries Reported - German (%)
Ancestries Reported - Greek (%)
Ancestries Reported - Hungarian (%)
Ancestries Reported - Irish (%)
Ancestries Reported - Italian (%)
Ancestries Reported - Lithuanian (%)
Ancestries Reported - Norwegian (%)
Ancestries Reported - Polish (%)
Ancestries Reported - Portuguese (%)
Ancestries Reported - Russian (%)
Ancestries Reported - Scotch-Irish (%)
Ancestries Reported - Scottish (%)
Ancestries Reported - Slovak (%)
Ancestries Reported - Subsaharan African (%)
Ancestries Reported - Swedish (%)
Ancestries Reported - Swiss (%)
Ancestries Reported - Ukrainian (%)
Ancestries Reported - United States (%)
Ancestries Reported - Welsh (%)
Ancestries Reported - West Indian (%)
Ancestries Reported - Other (%)
Geographical mobility - Same house 1 year ago (%)
Geographical mobility - Same house 1 year ago (%) - White
Geographical mobility - Same house 1 year ago (%) - Black or African American
Geographical mobility - Same house 1 year ago (%) - Asian
Geographical mobility - Same house 1 year ago (%) - Hispanic or Latino
Geographical mobility - Same house 1 year ago (%) - American Indian and Alaska Native
Geographical mobility - Same house 1 year ago (%) - Multirace
Geographical mobility - Same house 1 year ago (%) - Other Race
Geographical mobility - Moved within same county (%)
Geographical mobility - Moved within same county (%) - White
Geographical mobility - Moved within same county (%) - Black or African American
Geographical mobility - Moved within same county (%) - Asian
Geographical mobility - Moved within same county (%) - Hispanic or Latino
Geographical mobility - Moved within same county (%) - American Indian and Alaska Native
Geographical mobility - Moved within same county (%) - Multirace
Geographical mobility - Moved within same county (%) - Other Race
Geographical mobility - Moved from different county within same state (%)
Geographical mobility - Moved from different county within same state (%) - White
Geographical mobility - Moved from different county within same state (%) - Black or African American
Geographical mobility - Moved from different county within same state (%) - Asian
Geographical mobility - Moved from different county within same state (%) - Hispanic or Latino
Geographical mobility - Moved from different county within same state (%) - American Indian and Alaska Native
Geographical mobility - Moved from different county within same state (%) - Multirace
Geographical mobility - Moved from different county within same state (%) - Other Race
Geographical mobility - Moved from different state (%)
Geographical mobility - Moved from different state (%) - White
Geographical mobility - Moved from different state (%) - Black or African American
Geographical mobility - Moved from different state (%) - Asian
Geographical mobility - Moved from different state (%) - Hispanic or Latino
Geographical mobility - Moved from different state (%) - American Indian and Alaska Native
Geographical mobility - Moved from different state (%) - Multirace
Geographical mobility - Moved from different state (%) - Other Race
Geographical mobility - Moved from abroad (%)
Geographical mobility - Moved from abroad (%) - White
Geographical mobility - Moved from abroad (%) - Black or African American
Geographical mobility - Moved from abroad (%) - Asian
Geographical mobility - Moved from abroad (%) - Hispanic or Latino
Geographical mobility - Moved from abroad (%) - American Indian and Alaska Native
Geographical mobility - Moved from abroad (%) - Multirace
Geographical mobility - Moved from abroad (%) - Other Race
Place of birth for the foreign-born population - Ireland (%)
Place of birth for the foreign-born population - Denmark (%)
Place of birth for the foreign-born population - Norway (%)
Place of birth for the foreign-born population - Sweden (%)
Place of birth for the foreign-born population - United Kingdom (%)
Place of birth for the foreign-born population - England (%)
Place of birth for the foreign-born population - Scotland (%)
Place of birth for the foreign-born population - Other Northern Europe (%)
Place of birth for the foreign-born population - Austria (%)
Place of birth for the foreign-born population - Belgium (%)
Place of birth for the foreign-born population - France (%)
Place of birth for the foreign-born population - Germany (%)
Place of birth for the foreign-born population - Netherlands (%)
Place of birth for the foreign-born population - Switzerland (%)
Place of birth for the foreign-born population - Other Western Europe (%)
Place of birth for the foreign-born population - Greece (%)
Place of birth for the foreign-born population - Italy (%)
Place of birth for the foreign-born population - Portugal (%)
Place of birth for the foreign-born population - Spain (%)
Place of birth for the foreign-born population - Other Southern Europe (%)
Place of birth for the foreign-born population - Albania (%)
Place of birth for the foreign-born population - Belarus (%)
Place of birth for the foreign-born population - Bosnia and Herzegovina (%)
Place of birth for the foreign-born population - Bulgaria (%)
Place of birth for the foreign-born population - Croatia (%)
Place of birth for the foreign-born population - Czechoslovakia (%)
Place of birth for the foreign-born population - Hungary (%)
Place of birth for the foreign-born population - Latvia (%)
Place of birth for the foreign-born population - Lithuania (%)
Place of birth for the foreign-born population - North Macedonia (Macedonia) (%)
Place of birth for the foreign-born population - Moldova (%)
Place of birth for the foreign-born population - Poland (%)
Place of birth for the foreign-born population - Romania (%)
Place of birth for the foreign-born population - Russia (%)
Place of birth for the foreign-born population - Serbia (%)
Place of birth for the foreign-born population - Ukraine (%)
Place of birth for the foreign-born population - Other Eastern Europe (%)
Place of birth for the foreign-born population - China (%)
Place of birth for the foreign-born population - Hong Kong (%)
Place of birth for the foreign-born population - Taiwan (%)
Place of birth for the foreign-born population - Japan (%)
Place of birth for the foreign-born population - Korea (%)
Place of birth for the foreign-born population - Other Eastern Asia (%)
Place of birth for the foreign-born population - Afghanistan (%)
Place of birth for the foreign-born population - Bangladesh (%)
Place of birth for the foreign-born population - India (%)
Place of birth for the foreign-born population - Iran (%)
Place of birth for the foreign-born population - Kazakhstan (%)
Place of birth for the foreign-born population - Nepal (%)
Place of birth for the foreign-born population - Pakistan (%)
Place of birth for the foreign-born population - Sri Lanka (%)
Place of birth for the foreign-born population - Uzbekistan (%)
Place of birth for the foreign-born population - Other South Central Asia (%)
Place of birth for the foreign-born population - Burma (%)
Place of birth for the foreign-born population - Cambodia (%)
Place of birth for the foreign-born population - Indonesia (%)
Place of birth for the foreign-born population - Laos (%)
Place of birth for the foreign-born population - Malaysia (%)
Place of birth for the foreign-born population - Philippines (%)
Place of birth for the foreign-born population - Singapore (%)
Place of birth for the foreign-born population - Thailand (%)
Place of birth for the foreign-born population - Vietnam (%)
Place of birth for the foreign-born population - Other South Eastern Asia (%)
Place of birth for the foreign-born population - Armenia (%)
Place of birth for the foreign-born population - Iraq (%)
Place of birth for the foreign-born population - Israel (%)
Place of birth for the foreign-born population - Jordan (%)
Place of birth for the foreign-born population - Kuwait (%)
Place of birth for the foreign-born population - Lebanon (%)
Place of birth for the foreign-born population - Saudi Arabia (%)
Place of birth for the foreign-born population - Syria (%)
Place of birth for the foreign-born population - Turkey (%)
Place of birth for the foreign-born population - Yemen (%)
Place of birth for the foreign-born population - Other Western Asia (%)
Place of birth for the foreign-born population - Eritrea (%)
Place of birth for the foreign-born population - Ethiopia (%)
Place of birth for the foreign-born population - Kenya (%)
Place of birth for the foreign-born population - Somalia (%)
Place of birth for the foreign-born population - Uganda (%)
Place of birth for the foreign-born population - Zimbabwe (%)
Place of birth for the foreign-born population - Other Eastern Africa (%)
Place of birth for the foreign-born population - Cameroon (%)
Place of birth for the foreign-born population - Congo (%)
Place of birth for the foreign-born population - Democratic Republic of Congo (Zaire) (%)
Place of birth for the foreign-born population - Other Middle Africa (%)
Place of birth for the foreign-born population - Egypt (%)
Place of birth for the foreign-born population - Morocco (%)
Place of birth for the foreign-born population - Sudan (%)
Place of birth for the foreign-born population - Other Northern Africa (%)
Place of birth for the foreign-born population - South Africa (%)
Place of birth for the foreign-born population - Other Southern Africa (%)
Place of birth for the foreign-born population - Cabo Verde (%)
Place of birth for the foreign-born population - Ghana (%)
Place of birth for the foreign-born population - Liberia (%)
Place of birth for the foreign-born population - Nigeria (%)
Place of birth for the foreign-born population - Senegal (%)
Place of birth for the foreign-born population - Sierra Leone (%)
Place of birth for the foreign-born population - Other Western Africa (%)
Place of birth for the foreign-born population - Australia (%)
Place of birth for the foreign-born population - New Zealand (%)
Place of birth for the foreign-born population - Fiji (%)
Place of birth for the foreign-born population - Micronesia (%)
Place of birth for the foreign-born population - Bahamas (%)
Place of birth for the foreign-born population - Barbados (%)
Place of birth for the foreign-born population - Cuba (%)
Place of birth for the foreign-born population - Dominica (%)
Place of birth for the foreign-born population - Dominican Republic (%)
Place of birth for the foreign-born population - Grenada (%)
Place of birth for the foreign-born population - Haiti (%)
Place of birth for the foreign-born population - Jamaica (%)
Place of birth for the foreign-born population - St. Vincent and the Grenadines (%)
Place of birth for the foreign-born population - Trinidad and Tobago (%)
Place of birth for the foreign-born population - West Indies (%)
Place of birth for the foreign-born population - Other Caribbean (%)
Place of birth for the foreign-born population - Belize (%)
Place of birth for the foreign-born population - Costa Rica (%)
Place of birth for the foreign-born population - El Salvador (%)
Place of birth for the foreign-born population - Guatemala (%)
Place of birth for the foreign-born population - Honduras (%)
Place of birth for the foreign-born population - Mexico (%)
Place of birth for the foreign-born population - Nicaragua (%)
Place of birth for the foreign-born population - Panama (%)
Place of birth for the foreign-born population - Other Central America (%)
Place of birth for the foreign-born population - Argentina (%)
Place of birth for the foreign-born population - Bolivia (%)
Place of birth for the foreign-born population - Brazil (%)
Place of birth for the foreign-born population - Chile (%)
Place of birth for the foreign-born population - Colombia (%)
Place of birth for the foreign-born population - Ecuador (%)
Place of birth for the foreign-born population - Guyana (%)
Place of birth for the foreign-born population - Peru (%)
Place of birth for the foreign-born population - Uruguay (%)
Place of birth for the foreign-born population - Venezuela (%)
Place of birth for the foreign-born population - Other South America (%)
Place of birth for the foreign-born population - Canada (%)
Place of birth for the foreign-born population - Other Northern America (%)
Place of birth for the foreign-born population - Other (%)
Latest news about races in Warrenville, IL collected exclusively by city-data.com from local newspapers, TV, and radio stations
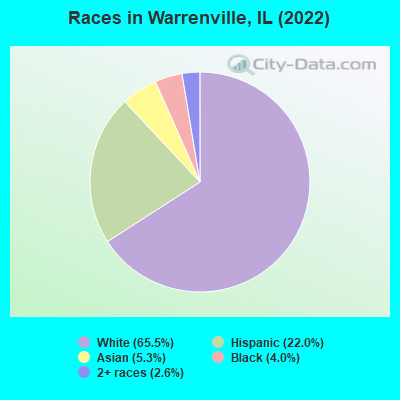
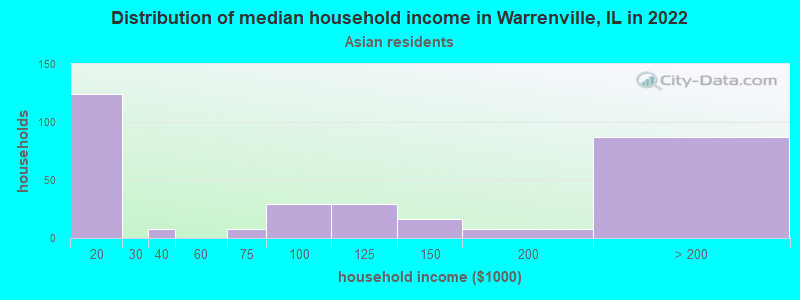
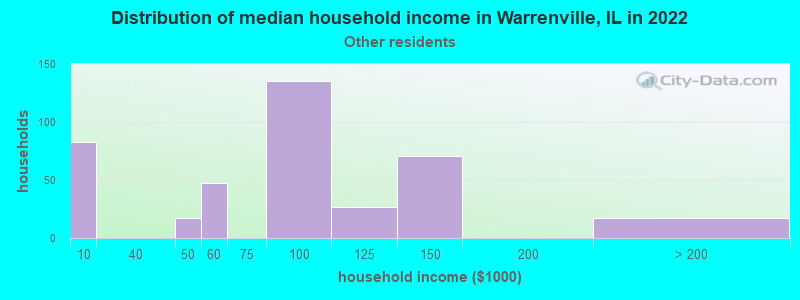
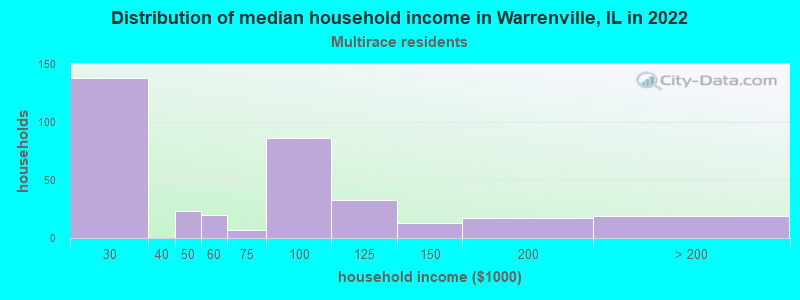
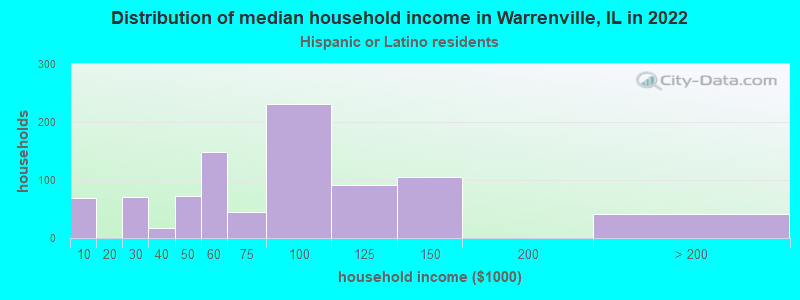
According to 2022 data, the most numerous races in Warrenville, IL are White alone (9,044 residents), Hispanic (3,041 residents), and Black alone (549 residents). 75.9% of Warrenville residents speak English at home. 16.0% of Warrenville, IL residents are foreign-born (9.3% born in Latin America, 3.1% born in Asia, 2.6% born in Europe), which is 12.3% greater than the foreign-born rate of 14.0% across the entire state of Illinois.
Race distribution in Warrenville
2000 2022
8,424,140 67.8% White alone 1,856,152 14.9% Black alone 1,530,262 12.3% Hispanic 419,916 3.4% Asian alone 153,996 1.2% Two or more races 13,479 0.1% Other race alone 18,232 0.1% American Indian alone 3,116 0.03% Native Hawaiian and Other
7,356,301 58.5% White alone 2,299,726 18.3% Hispanic 1,660,423 13.2% Black alone 747,296 5.9% Asian alone 458,599 3.6% Two or more races 45,386 0.4% Other race alone 10,405 0.08% American Indian alone 3,896 0.03% Native Hawaiian and Other
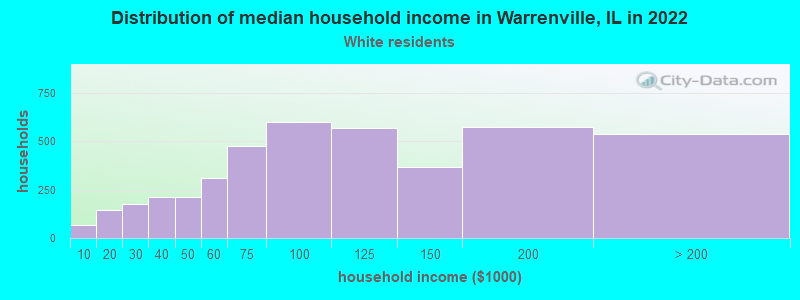
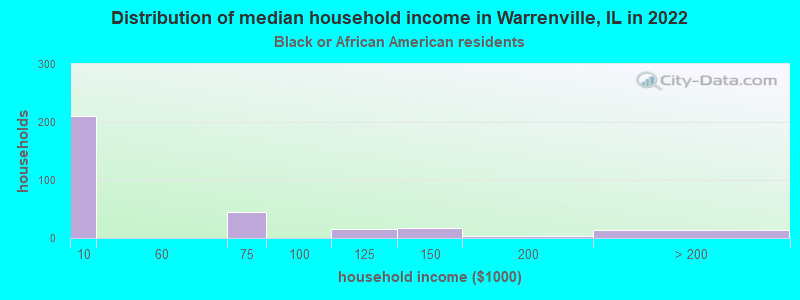
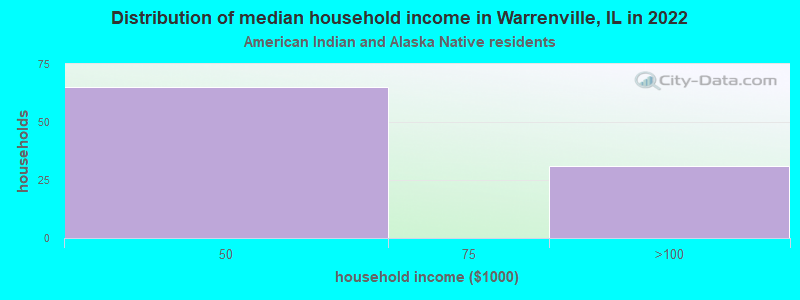
Income and house value in Warrenville Median household income in 2022 $98,830 White non-Hispanic householders$37,213 American Indian and Alaska Native householders$108,442 Asian householders$77,123 Some other race householders$94,948 Two or more races householders$73,727 Hispanic or Latino race householdersMedian 2022 house value $259,337 White Non-Hispanic householders$239,913 Black or African American householders$284,360 American Indian or Alaska Native householders $340,533 Asian householders$268,436 Some other race householdersover $1,000,000 Two or more races householders$243,588 Hispanic or Latino householders
Median age by race in Warrenville
41.7 Median age for White residents41.3 42.3 26.9 Median age for Black or African American residents18.4 26.8 57.3 Median age for American Indian / Alaska Native residents52.0 44.7 34.0 Median age for Asian residents31.6 39.2 -593,236,714.4 Median age for Native Hawaiian / Pacific Islander residents-658,536,584.7 -576,015,108.0 29.2 Median age for Other race residents28.3 41.8 27.5 Median age for Two or more races residents40.1 24.9 42.0 Median age for White alone residents41.3 44.1 31.8 Median age for Hispanic or Latino residents30.4 32.3
Owner/renter occupied households by race in Warrenville
House owners and renters - White residents 3,660 86.0% Owner occupied595 14.0% Renter occupiedHouse owners and renters - Black or African American residents 93 44.8% Owner occupied114 55.2% Renter occupiedHouse owners and renters - American Indian / Alaska Native residents 54 100.0% Owner occupiedHouse owners and renters - Asian residents 247 96.8% Owner occupied8 3.2% Renter occupiedHouse owners and renters - Other race residents 147 34.8% Owner occupied276 65.2% Renter occupiedHouse owners and renters - Two or more races residents 182 55.7% Owner occupied145 44.3% Renter occupiedHouse owners and renters - White alone residents 3,475 86.5% Owner occupied544 13.5% Renter occupiedHouse owners and renters - Hispanic or Latino residents 544 57.5% Owner occupied402 42.5% Renter occupied
Language usage in Warrenville
English speakers - Total 75.9% of residents of Warrenville speak English at home.
17.8% of residents speak Spanish at home 1,273 53.6% Speak English very well1,101 46.4% Speak English less than very well7.1% of residents speak other language at home 577 61.2% Speak English very well366 38.8% Speak English less than very well
English speakers - Born in the United States 97.1% of residents of Warrenville speak English at home.
1.0% of residents speak Spanish at home 23 100.0% Speak English very well1.7% of residents speak other language at home 40 100.0% Speak English very well
English speakers - Native, born elsewhere 80.1% of residents of Warrenville speak English at home.
11.7% of residents speak Spanish at home 20 100.0% Speak English very well7.6% of residents speak other language at home 13 100.0% Speak English very well
English speakers - Foreign-born 16.0% of residents of Warrenville speak English at home.
58.7% of residents speak Spanish at home 347 26.9% Speak English very well941 73.1% Speak English less than very well28.1% of residents speak other language at home 346 56.2% Speak English very well270 43.8% Speak English less than very well
White (Caucasian) - Speak only English Native:
96.6% (8,353)Foreign-born:
29.8% (206)
White (Caucasian) - Speak another language Native:
4.0% (347)Foreign-born:
71.9% (499)
Black or African American - Speak only English Native:
92.7% (585)Foreign-born:
20.2% (4)
Black or African American - Speak another language Native:
6.2% (39)Foreign-born:
100.0% (19)
American Indian / Alaska Native - Speak only English Native:
11.0% (3)Foreign-born:
5.1% (10)
American Indian / Alaska Native - Speak another language Native:
95.3% (22)Foreign-born:
100.0% (190)
Asian - Speak only English Native:
37.3% (132)Foreign-born:
22.4% (80)
Asian - Speak another language Native:
57.7% (204)Foreign-born:
75.4% (271)
Other race - Speak only English Native:
11.3% (48)Foreign-born:
6.1% (48)
Other race - Speak another language Native:
83.6% (354)Foreign-born:
93.9% (748)
Two or more races - Speak only English Native:
52.0% (524)Foreign-born:
4.7% (17)
Two or more races - Speak another language Native:
50.5% (509)Foreign-born:
96.5% (338)
White alone - Speak only English Native:
97.7% (8,083)Foreign-born:
32.9% (160)
White alone - Speak another language Native:
2.5% (206)Foreign-born:
67.7% (330)
Hispanic or Latino - Speak only English Native:
39.0% (637)Foreign-born:
8.8% (120)
Hispanic or Latino - Speak another language Native:
61.1% (998)Foreign-born:
91.0% (1,237)
Foreign-born residents in Warrenville 2,203 residents are foreign born (9.3% Latin America , 3.1% Asia , 2.6% Europe ).
This city:
16.0%Illinois:
14.1%
Marital status for residents in Warrenville Marital status - White (Caucasian) population 15 years and over
Males 35.4% Never married52.9% Now married0.0% Separated3.3% Widowed8.4% DivorcedFemales 29.7% Never married46.9% Now married1.7% Separated7.0% Widowed14.7% DivorcedWomen who gave birth in the past 12 months Now married:
100.0% (78)Unmarried:
0.0% (0)
Women who did not give birth in the past 12 months Now married:
41.7% (887)Unmarried:
58.3% (1,240)
Marital status - Black or African American population 15 years and over
Males 50.0% Never married50.0% Now married0.0% Separated0.0% Widowed0.0% DivorcedFemales 75.5% Never married10.1% Now married11.6% Separated0.0% Widowed2.7% DivorcedWomen who gave birth in the past 12 months Now married:
100.0% (10)Unmarried:
0.0% (0)
Women who did not give birth in the past 12 months Now married:
8.3% (22)Unmarried:
91.7% (248)
Marital status - American Indian / Alaska Native population 15 years and over
Males 5.1% Never married94.9% Now married0.0% Separated0.0% Widowed0.0% DivorcedFemales 8.3% Never married52.1% Now married0.0% Separated39.6% Widowed0.0% DivorcedWomen who did not give birth in the past 12 months Now married:
61.9% (22)Unmarried:
38.1% (13)
Marital status - Asian population 15 years and over
Males 14.1% Never married80.2% Now married0.0% Separated0.0% Widowed5.6% DivorcedFemales 16.5% Never married77.8% Now married0.0% Separated0.0% Widowed5.7% DivorcedWomen who gave birth in the past 12 months Now married:
100.0% (29)Unmarried:
0.0% (0)
Women who did not give birth in the past 12 months Now married:
75.3% (203)Unmarried:
24.7% (67)
Marital status - Other race population 15 years and over
Males 63.1% Never married36.9% Now married0.0% Separated0.0% Widowed0.0% DivorcedFemales 32.9% Never married50.6% Now married0.0% Separated0.0% Widowed16.5% DivorcedWomen who did not give birth in the past 12 months Now married:
32.8% (80)Unmarried:
67.2% (163)
Marital status - Two or more races population 15 years and over
Males 45.4% Never married28.1% Now married14.7% Separated0.0% Widowed11.9% DivorcedFemales 57.1% Never married31.5% Now married7.9% Separated3.5% Widowed0.0% DivorcedWomen who did not give birth in the past 12 months Now married:
22.5% (87)Unmarried:
77.5% (299)
Marital status - White alone, not Hispanic / Latino population 15 years and over
Males 34.5% Never married53.1% Now married0.0% Separated3.6% Widowed8.8% DivorcedFemales 27.4% Never married47.8% Now married2.0% Separated7.7% Widowed15.1% DivorcedWomen who gave birth in the past 12 months Now married:
100.0% (83)Unmarried:
0.0% (0)
Women who did not give birth in the past 12 months Now married:
42.7% (818)Unmarried:
57.3% (1,099)
Marital status - Hispanic or Latino population 15 years and over
Males 51.6% Never married39.5% Now married4.4% Separated0.0% Widowed4.5% DivorcedFemales 45.0% Never married39.3% Now married2.5% Separated4.2% Widowed9.0% DivorcedWomen who did not give birth in the past 12 months Now married:
30.1% (245)Unmarried:
69.9% (569)
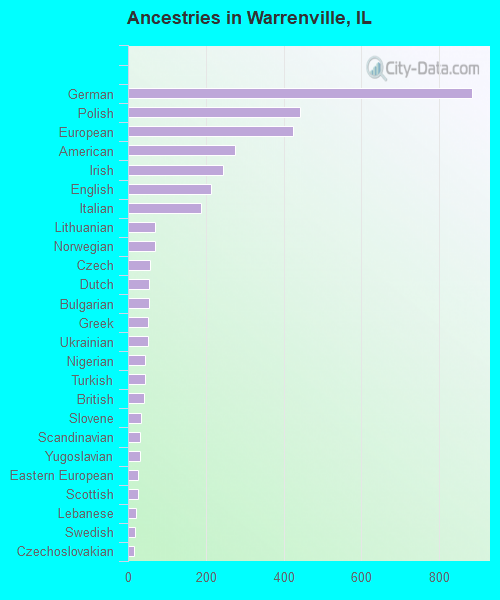
Ancestries in Warrenville
884 13.7% German443 6.9% Polish423 6.6% European275 4.3% American244 3.8% Irish213 3.3% English187 2.9% Italian70 1.1% Lithuanian69 1.1% Norwegian57 0.9% Czech55 0.9% Dutch53 0.8% Bulgarian52 0.8% Greek51 0.8% Ukrainian43 0.7% Nigerian43 0.7% Turkish41 0.6% British34 0.5% Slovene31 0.5% Scandinavian30 0.5% Yugoslavian26 0.4% Eastern European26 0.4% Scottish21 0.3% Lebanese18 0.3% Swedish15 0.2% Czechoslovakian14 0.2% Croatian10 0.2% Arab9 0.1% Russian8 0.1% Armenian8 0.1% Scotch-Irish7 0.1% Moroccan7 0.1% Hungarian7 0.1% Israeli6 0.09% French Canadian6 0.09% Slovak5 0.08% French5 0.08% Serbian4 0.06% Albanian3 0.05% Northern European
Geographical mobility in Warrenville Same house 1 year ago 8,642 90.8% White (Caucasian)584 92.4% Black or African American270 99.7% American Indian / Alaska Native699 95.4% Asian1,182 98.0% Other race1,224 87.9% Two or more races8,124 90.7% White alone, not Hispanic / Latino2,810 92.7% Hispanic or LatinoMoved within same county 608 6.4% White / Caucasian65 10.2% Black or African American13 1.8% Asian7 0.6% Other race113 8.1% Two or more races565 6.3% White alone, not Hispanic / Latino129 4.2% Hispanic or LatinoMoved within same state 150 1.6% White / Caucasian1 0.1% Black or African American30 2.2% Two or more races143 1.6% White alone, not Hispanic / Latino31 1.0% Hispanic or LatinoMoved from different state 23 0.2% White / Caucasian24 0.3% White alone, not Hispanic / LatinoMoved from abroad 11 0.1% White10 1.3% Asian12 0.1% White alone, not Hispanic / Latino
Children Nativity (place of birth) in Warrenville
Children under 6 years - Living with two parents Both parents native 389 99.9% Native0 0.1% Foreign-bornBoth parents foreign-born 76 91.3% Native7 8.7% Foreign-bornOne native, one foreign-born parent 77 100.0% NativeChildren under 6 years - Living with one parent Native parent 69 100.0% NativeChildren 6 to 17 years - Living with two parents Both parents native 925 99.5% Native5 0.5% Foreign-bornBoth parents foreign-born 264 80.9% Native62 19.1% Foreign-bornOne native, one foreign-born parent 94 100.0% NativeChildren 6 to 17 years - Living with one parent Native parent 690 100.0% NativeForeign-born parent 38 48.1% Native41 51.9% Foreign-born
Grandparents responsible for own grandchildren in Warrenville
Grandparents (30 to 59 years) White / Caucasian 10 100.0% Not responsible for grandchildrenWhite alone, not Hispanic / Latino 11 100.0% Not responsible for grandchildrenGrandparents (60 years and over) White / Caucasian 20 14.9% Responsible for grandchildren115 85.1% Not responsible for grandchildrenWhite alone, not Hispanic / Latino 22 16.2% Responsible for grandchildren115 83.8% Not responsible for grandchildren