Races in Warsaw, Indiana (IN) Detailed Stats
Data:
Races - White alone (%)
Races - White alone (% change since 2000)
Races - Black alone (%)
Races - Black alone (% change since 2000)
Races - American Indian alone (%)
Races - American Indian alone (% change since 2000)
Races - Asian alone (%)
Races - Asian alone (% change since 2000)
Races - Hispanic (%)
Races - Hispanic (% change since 2000)
Races - Native Hawaiian and Other Pacific Islander alone (%)
Races - Native Hawaiian and Other Pacific Islander alone (% change since 2000)
Races - Two or more races(%)
Races - Two or more races(% change since 2000)
Races - Other race alone (%)
Races - Other race alone (% change since 2000)
Racial diversity
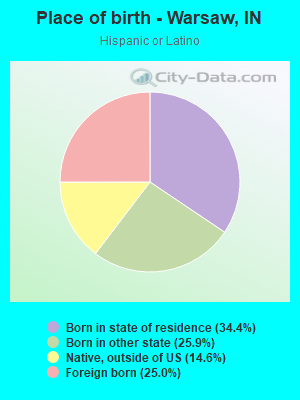
Place of birth - Born in state of residence (%)
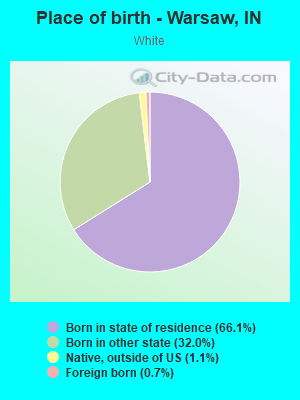
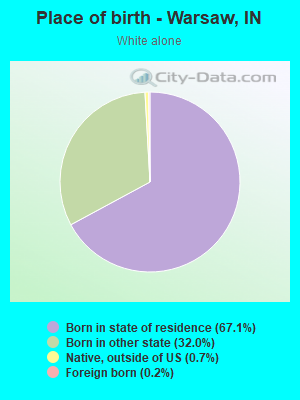
Place of birth - Born in state of residence (%) - White
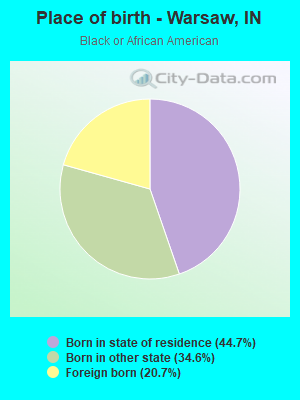
Place of birth - Born in state of residence (%) - Black or African American
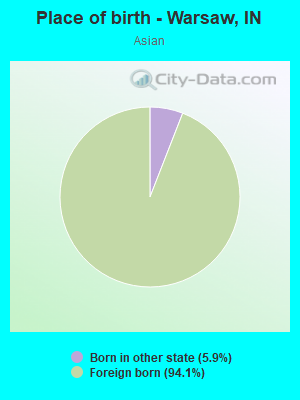
Place of birth - Born in state of residence (%) - Asian
Place of birth - Born in state of residence (%) - Hispanic or Latino
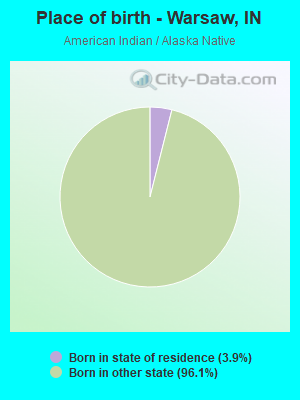
Place of birth - Born in state of residence (%) - American Indian and Alaska Native
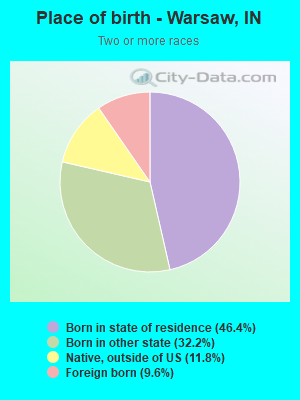
Place of birth - Born in state of residence (%) - Multirace
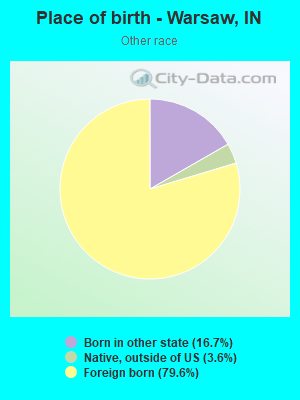
Place of birth - Born in state of residence (%) - Other Race
Place of birth - Born in other state (%)
Place of birth - Born in other state (%) - White
Place of birth - Born in other state (%) - Black or African American
Place of birth - Born in other state (%) - Asian
Place of birth - Born in other state (%) - Hispanic or Latino
Place of birth - Born in other state (%) - American Indian and Alaska Native
Place of birth - Born in other state (%) - Multirace
Place of birth - Born in other state (%) - Other Race
Place of birth - Native, outside of US (%)
Place of birth - Native, outside of US (%) - White
Place of birth - Native, outside of US (%) - Black or African American
Place of birth - Native, outside of US (%) - Asian
Place of birth - Native, outside of US (%) - Hispanic or Latino
Place of birth - Native, outside of US (%) - American Indian and Alaska Native
Place of birth - Native, outside of US (%) - Multirace
Place of birth - Native, outside of US (%) - Other Race
Place of birth - Foreign born (%)
Place of birth - Foreign born (%) - White
Place of birth - Foreign born (%) - Black or African American
Place of birth - Foreign born (%) - Asian
Place of birth - Foreign born (%) - Hispanic or Latino
Place of birth - Foreign born (%) - American Indian and Alaska Native
Place of birth - Foreign born (%) - Multirace
Place of birth - Foreign born (%) - Other Race
Residents speaking English at home (%)
Residents speaking English at home - Born in the United States (%)
Residents speaking English at home - Native, born elsewhere (%)
Residents speaking English at home - Foreign born (%)
Residents speaking Spanish at home (%)
Residents speaking Spanish at home - Born in the United States (%)
Residents speaking Spanish at home - Native, born elsewhere (%)
Residents speaking Spanish at home - Foreign born (%)
Residents speaking other language at home (%)
Residents speaking other language at home - Born in the United States (%)
Residents speaking other language at home - Native, born elsewhere (%)
Residents speaking other language at home - Foreign born (%)
Marital status - Never married (%)
Marital status - Now married (%)
Marital status - Separated (%)
Marital status - Widowed (%)
Marital status - Divorced (%)
Ancestries Reported - Arab (%)
Ancestries Reported - Czech (%)
Ancestries Reported - Danish (%)
Ancestries Reported - Dutch (%)
Ancestries Reported - English (%)
Ancestries Reported - French (%)
Ancestries Reported - French Canadian (%)
Ancestries Reported - German (%)
Ancestries Reported - Greek (%)
Ancestries Reported - Hungarian (%)
Ancestries Reported - Irish (%)
Ancestries Reported - Italian (%)
Ancestries Reported - Lithuanian (%)
Ancestries Reported - Norwegian (%)
Ancestries Reported - Polish (%)
Ancestries Reported - Portuguese (%)
Ancestries Reported - Russian (%)
Ancestries Reported - Scotch-Irish (%)
Ancestries Reported - Scottish (%)
Ancestries Reported - Slovak (%)
Ancestries Reported - Subsaharan African (%)
Ancestries Reported - Swedish (%)
Ancestries Reported - Swiss (%)
Ancestries Reported - Ukrainian (%)
Ancestries Reported - United States (%)
Ancestries Reported - Welsh (%)
Ancestries Reported - West Indian (%)
Ancestries Reported - Other (%)
Geographical mobility - Same house 1 year ago (%)
Geographical mobility - Same house 1 year ago (%) - White
Geographical mobility - Same house 1 year ago (%) - Black or African American
Geographical mobility - Same house 1 year ago (%) - Asian
Geographical mobility - Same house 1 year ago (%) - Hispanic or Latino
Geographical mobility - Same house 1 year ago (%) - American Indian and Alaska Native
Geographical mobility - Same house 1 year ago (%) - Multirace
Geographical mobility - Same house 1 year ago (%) - Other Race
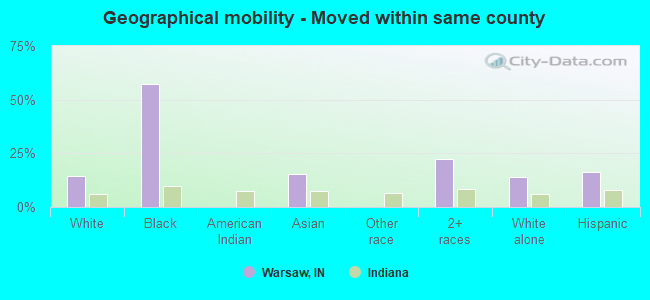
Geographical mobility - Moved within same county (%)
Geographical mobility - Moved within same county (%) - White
Geographical mobility - Moved within same county (%) - Black or African American
Geographical mobility - Moved within same county (%) - Asian
Geographical mobility - Moved within same county (%) - Hispanic or Latino
Geographical mobility - Moved within same county (%) - American Indian and Alaska Native
Geographical mobility - Moved within same county (%) - Multirace
Geographical mobility - Moved within same county (%) - Other Race
Geographical mobility - Moved from different county within same state (%)
Geographical mobility - Moved from different county within same state (%) - White
Geographical mobility - Moved from different county within same state (%) - Black or African American
Geographical mobility - Moved from different county within same state (%) - Asian
Geographical mobility - Moved from different county within same state (%) - Hispanic or Latino
Geographical mobility - Moved from different county within same state (%) - American Indian and Alaska Native
Geographical mobility - Moved from different county within same state (%) - Multirace
Geographical mobility - Moved from different county within same state (%) - Other Race
Geographical mobility - Moved from different state (%)
Geographical mobility - Moved from different state (%) - White
Geographical mobility - Moved from different state (%) - Black or African American
Geographical mobility - Moved from different state (%) - Asian
Geographical mobility - Moved from different state (%) - Hispanic or Latino
Geographical mobility - Moved from different state (%) - American Indian and Alaska Native
Geographical mobility - Moved from different state (%) - Multirace
Geographical mobility - Moved from different state (%) - Other Race
Geographical mobility - Moved from abroad (%)
Geographical mobility - Moved from abroad (%) - White
Geographical mobility - Moved from abroad (%) - Black or African American
Geographical mobility - Moved from abroad (%) - Asian
Geographical mobility - Moved from abroad (%) - Hispanic or Latino
Geographical mobility - Moved from abroad (%) - American Indian and Alaska Native
Geographical mobility - Moved from abroad (%) - Multirace
Geographical mobility - Moved from abroad (%) - Other Race
Place of birth for the foreign-born population - Ireland (%)
Place of birth for the foreign-born population - Denmark (%)
Place of birth for the foreign-born population - Norway (%)
Place of birth for the foreign-born population - Sweden (%)
Place of birth for the foreign-born population - United Kingdom (%)
Place of birth for the foreign-born population - England (%)
Place of birth for the foreign-born population - Scotland (%)
Place of birth for the foreign-born population - Other Northern Europe (%)
Place of birth for the foreign-born population - Austria (%)
Place of birth for the foreign-born population - Belgium (%)
Place of birth for the foreign-born population - France (%)
Place of birth for the foreign-born population - Germany (%)
Place of birth for the foreign-born population - Netherlands (%)
Place of birth for the foreign-born population - Switzerland (%)
Place of birth for the foreign-born population - Other Western Europe (%)
Place of birth for the foreign-born population - Greece (%)
Place of birth for the foreign-born population - Italy (%)
Place of birth for the foreign-born population - Portugal (%)
Place of birth for the foreign-born population - Spain (%)
Place of birth for the foreign-born population - Other Southern Europe (%)
Place of birth for the foreign-born population - Albania (%)
Place of birth for the foreign-born population - Belarus (%)
Place of birth for the foreign-born population - Bosnia and Herzegovina (%)
Place of birth for the foreign-born population - Bulgaria (%)
Place of birth for the foreign-born population - Croatia (%)
Place of birth for the foreign-born population - Czechoslovakia (%)
Place of birth for the foreign-born population - Hungary (%)
Place of birth for the foreign-born population - Latvia (%)
Place of birth for the foreign-born population - Lithuania (%)
Place of birth for the foreign-born population - North Macedonia (Macedonia) (%)
Place of birth for the foreign-born population - Moldova (%)
Place of birth for the foreign-born population - Poland (%)
Place of birth for the foreign-born population - Romania (%)
Place of birth for the foreign-born population - Russia (%)
Place of birth for the foreign-born population - Serbia (%)
Place of birth for the foreign-born population - Ukraine (%)
Place of birth for the foreign-born population - Other Eastern Europe (%)
Place of birth for the foreign-born population - China (%)
Place of birth for the foreign-born population - Hong Kong (%)
Place of birth for the foreign-born population - Taiwan (%)
Place of birth for the foreign-born population - Japan (%)
Place of birth for the foreign-born population - Korea (%)
Place of birth for the foreign-born population - Other Eastern Asia (%)
Place of birth for the foreign-born population - Afghanistan (%)
Place of birth for the foreign-born population - Bangladesh (%)
Place of birth for the foreign-born population - India (%)
Place of birth for the foreign-born population - Iran (%)
Place of birth for the foreign-born population - Kazakhstan (%)
Place of birth for the foreign-born population - Nepal (%)
Place of birth for the foreign-born population - Pakistan (%)
Place of birth for the foreign-born population - Sri Lanka (%)
Place of birth for the foreign-born population - Uzbekistan (%)
Place of birth for the foreign-born population - Other South Central Asia (%)
Place of birth for the foreign-born population - Burma (%)
Place of birth for the foreign-born population - Cambodia (%)
Place of birth for the foreign-born population - Indonesia (%)
Place of birth for the foreign-born population - Laos (%)
Place of birth for the foreign-born population - Malaysia (%)
Place of birth for the foreign-born population - Philippines (%)
Place of birth for the foreign-born population - Singapore (%)
Place of birth for the foreign-born population - Thailand (%)
Place of birth for the foreign-born population - Vietnam (%)
Place of birth for the foreign-born population - Other South Eastern Asia (%)
Place of birth for the foreign-born population - Armenia (%)
Place of birth for the foreign-born population - Iraq (%)
Place of birth for the foreign-born population - Israel (%)
Place of birth for the foreign-born population - Jordan (%)
Place of birth for the foreign-born population - Kuwait (%)
Place of birth for the foreign-born population - Lebanon (%)
Place of birth for the foreign-born population - Saudi Arabia (%)
Place of birth for the foreign-born population - Syria (%)
Place of birth for the foreign-born population - Turkey (%)
Place of birth for the foreign-born population - Yemen (%)
Place of birth for the foreign-born population - Other Western Asia (%)
Place of birth for the foreign-born population - Eritrea (%)
Place of birth for the foreign-born population - Ethiopia (%)
Place of birth for the foreign-born population - Kenya (%)
Place of birth for the foreign-born population - Somalia (%)
Place of birth for the foreign-born population - Uganda (%)
Place of birth for the foreign-born population - Zimbabwe (%)
Place of birth for the foreign-born population - Other Eastern Africa (%)
Place of birth for the foreign-born population - Cameroon (%)
Place of birth for the foreign-born population - Congo (%)
Place of birth for the foreign-born population - Democratic Republic of Congo (Zaire) (%)
Place of birth for the foreign-born population - Other Middle Africa (%)
Place of birth for the foreign-born population - Egypt (%)
Place of birth for the foreign-born population - Morocco (%)
Place of birth for the foreign-born population - Sudan (%)
Place of birth for the foreign-born population - Other Northern Africa (%)
Place of birth for the foreign-born population - South Africa (%)
Place of birth for the foreign-born population - Other Southern Africa (%)
Place of birth for the foreign-born population - Cabo Verde (%)
Place of birth for the foreign-born population - Ghana (%)
Place of birth for the foreign-born population - Liberia (%)
Place of birth for the foreign-born population - Nigeria (%)
Place of birth for the foreign-born population - Senegal (%)
Place of birth for the foreign-born population - Sierra Leone (%)
Place of birth for the foreign-born population - Other Western Africa (%)
Place of birth for the foreign-born population - Australia (%)
Place of birth for the foreign-born population - New Zealand (%)
Place of birth for the foreign-born population - Fiji (%)
Place of birth for the foreign-born population - Micronesia (%)
Place of birth for the foreign-born population - Bahamas (%)
Place of birth for the foreign-born population - Barbados (%)
Place of birth for the foreign-born population - Cuba (%)
Place of birth for the foreign-born population - Dominica (%)
Place of birth for the foreign-born population - Dominican Republic (%)
Place of birth for the foreign-born population - Grenada (%)
Place of birth for the foreign-born population - Haiti (%)
Place of birth for the foreign-born population - Jamaica (%)
Place of birth for the foreign-born population - St. Vincent and the Grenadines (%)
Place of birth for the foreign-born population - Trinidad and Tobago (%)
Place of birth for the foreign-born population - West Indies (%)
Place of birth for the foreign-born population - Other Caribbean (%)
Place of birth for the foreign-born population - Belize (%)
Place of birth for the foreign-born population - Costa Rica (%)
Place of birth for the foreign-born population - El Salvador (%)
Place of birth for the foreign-born population - Guatemala (%)
Place of birth for the foreign-born population - Honduras (%)
Place of birth for the foreign-born population - Mexico (%)
Place of birth for the foreign-born population - Nicaragua (%)
Place of birth for the foreign-born population - Panama (%)
Place of birth for the foreign-born population - Other Central America (%)
Place of birth for the foreign-born population - Argentina (%)
Place of birth for the foreign-born population - Bolivia (%)
Place of birth for the foreign-born population - Brazil (%)
Place of birth for the foreign-born population - Chile (%)
Place of birth for the foreign-born population - Colombia (%)
Place of birth for the foreign-born population - Ecuador (%)
Place of birth for the foreign-born population - Guyana (%)
Place of birth for the foreign-born population - Peru (%)
Place of birth for the foreign-born population - Uruguay (%)
Place of birth for the foreign-born population - Venezuela (%)
Place of birth for the foreign-born population - Other South America (%)
Place of birth for the foreign-born population - Canada (%)
Place of birth for the foreign-born population - Other Northern America (%)
Place of birth for the foreign-born population - Other (%)
Latest news about races in Warsaw, IN collected exclusively by city-data.com from local newspapers, TV, and radio stations
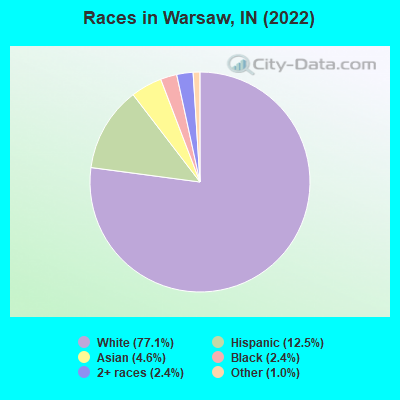
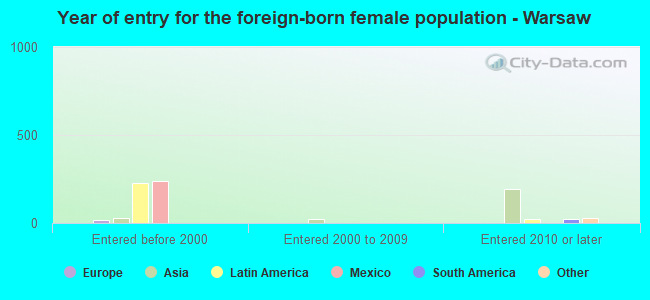
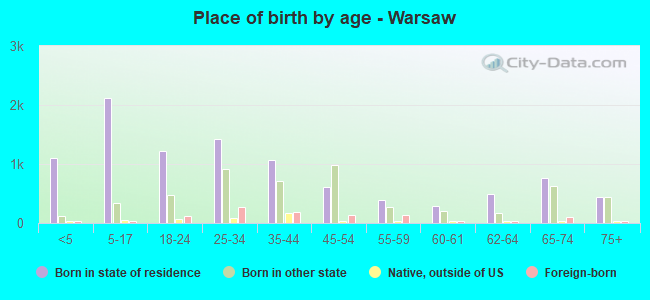
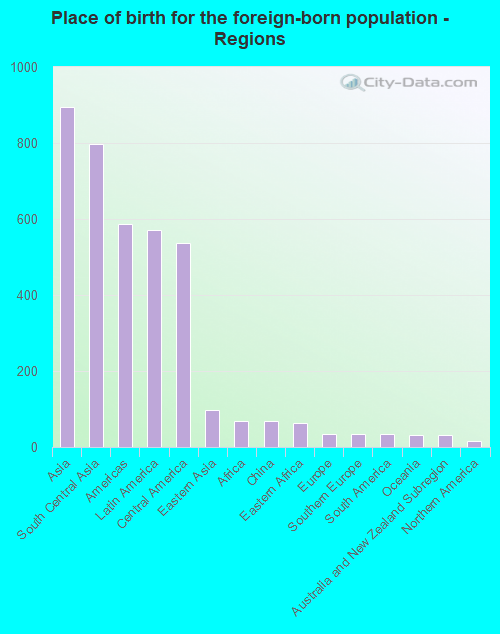
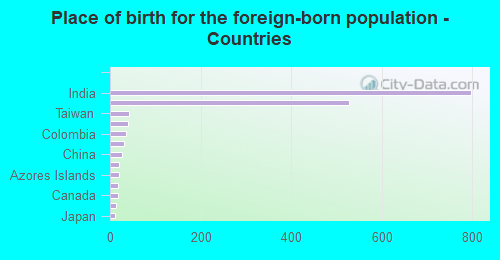
According to 2022 data, the most numerous races in Warsaw, IN are White alone (12,786 residents), Black alone (402 residents), and Hispanic (2,081 residents). 86.6% of Warsaw residents speak English at home. 9.8% of Warsaw, IN residents are foreign-born (4.9% born in Asia, 3.2% born in Latin America), which is 38.7% greater than the foreign-born rate of 6.0% across the entire state of Indiana.
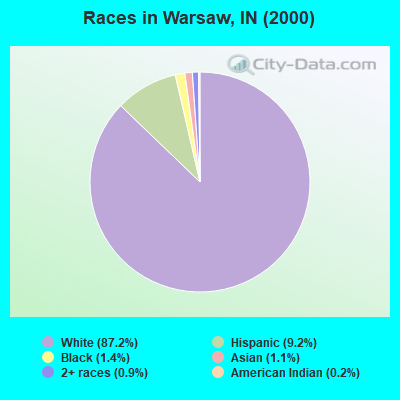
Race distribution in Warsaw
2000 2022
5,219,373 85.8% White alone 505,462 8.3% Black alone 214,536 3.5% Hispanic 61,115 1.0% Two or more races 58,424 1.0% Asian alone 13,654 0.2% American Indian alone 6,348 0.1% Other race alone 1,573 0.03% Native Hawaiian and Other
5,192,455 76.0% White alone 628,054 9.2% Black alone 534,528 7.8% Hispanic 263,242 3.9% Two or more races 172,880 2.5% Asian alone 33,467 0.5% Other race alone 5,866 0.09% American Indian alone 2,545 0.04% Native Hawaiian and Other
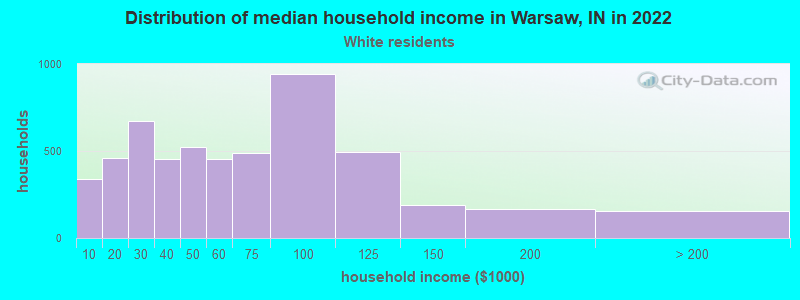
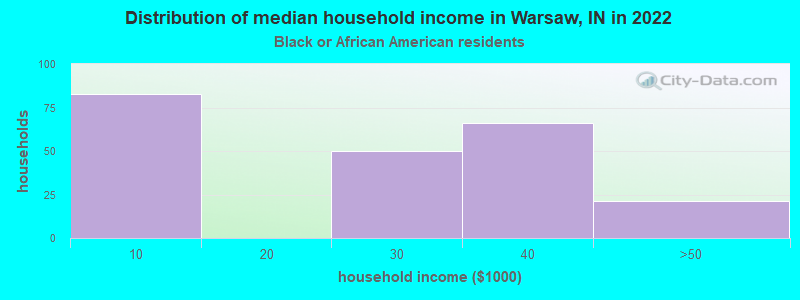
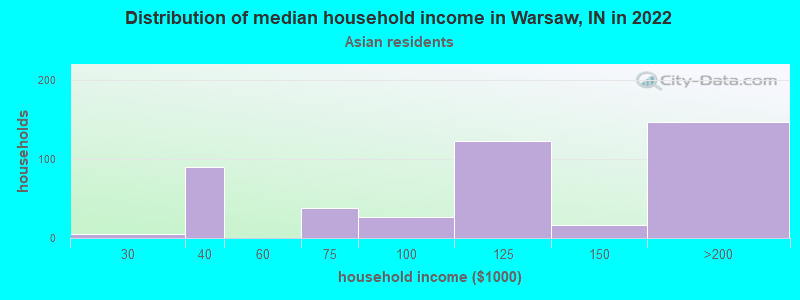
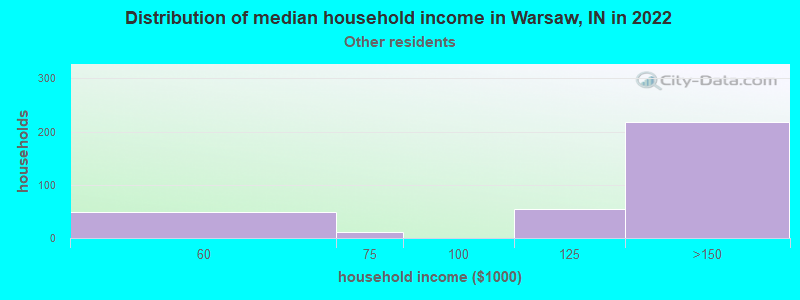
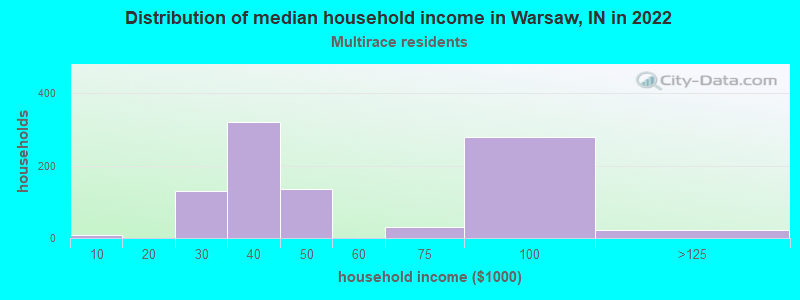
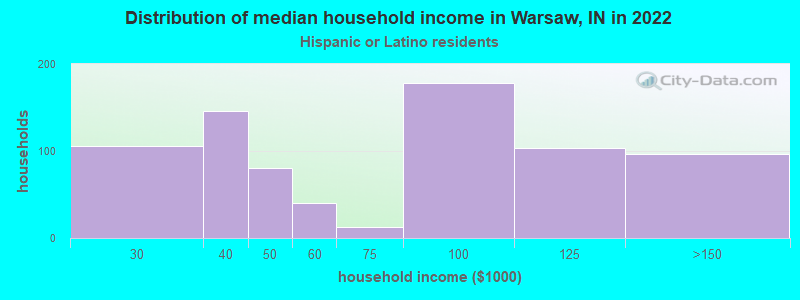
Income and house value in Warsaw Median household income in 2022 $54,386 White non-Hispanic householders$121,189 Asian householdersover $200,000 Some other race householders$42,216 Two or more races householders$100,779 Hispanic or Latino race householdersMedian 2022 house value $187,535 White Non-Hispanic householders$210,838 Black or African American householders$210,838 American Indian or Alaska Native householders $232,588 Asian householders$152,691 Some other race householders$131,607 Two or more races householders$163,344 Hispanic or Latino householders
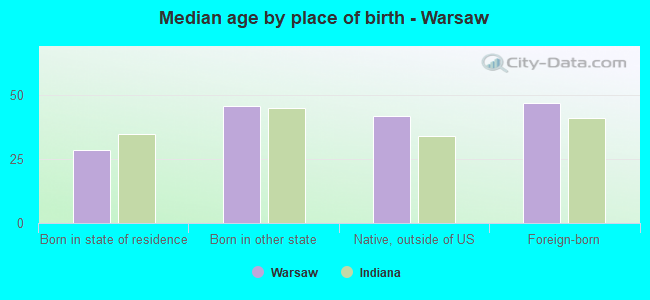
Median age by race in Warsaw
36.3 Median age for White residents34.0 38.2 52.6 Median age for Black or African American residents22.2 29.7 7.7 Median age for American Indian / Alaska Native residents35.5 6.7 38.8 Median age for Asian residents48.4 29.6 -666,666,666.0 Median age for Native Hawaiian / Pacific Islander residents-666,666,666.0 -666,666,666.0 28.2 Median age for Other race residents31.8 31.9 30.8 Median age for Two or more races residents24.2 27.3 37.3 Median age for White alone residents34.0 39.3 25.4 Median age for Hispanic or Latino residents28.1 29.2
Owner/renter occupied households by race in Warsaw
House owners and renters - White residents 3,070 57.5% Owner occupied2,268 42.5% Renter occupiedHouse owners and renters - Black or African American residents 211 100.0% Renter occupiedHouse owners and renters - American Indian / Alaska Native residents 11 100.0% Owner occupiedHouse owners and renters - Asian residents 76 19.2% Owner occupied318 80.8% Renter occupiedHouse owners and renters - Other race residents 159 55.4% Owner occupied128 44.6% Renter occupiedHouse owners and renters - Two or more races residents 269 33.5% Owner occupied533 66.5% Renter occupiedHouse owners and renters - White alone residents 3,030 57.5% Owner occupied2,242 42.5% Renter occupiedHouse owners and renters - Hispanic or Latino residents 363 55.8% Owner occupied288 44.2% Renter occupied
Language usage in Warsaw
English speakers - Total 86.6% of residents of Warsaw speak English at home.
7.4% of residents speak Spanish at home 599 52.7% Speak English very well538 47.3% Speak English less than very well6.4% of residents speak other language at home 905 92.4% Speak English very well74 7.6% Speak English less than very well
English speakers - Born in the United States 92.0% of residents of Warsaw speak English at home.
6.7% of residents speak Spanish at home 297 92.2% Speak English very well25 7.8% Speak English less than very well1.5% of residents speak other language at home 74 100.0% Speak English very well
English speakers - Native, born elsewhere 47.7% of residents of Warsaw speak English at home.
50.6% of residents speak Spanish at home 96 55.2% Speak English very well78 44.8% Speak English less than very well
English speakers - Foreign-born 10.8% of residents of Warsaw speak English at home.
34.5% of residents speak Spanish at home 118 21.3% Speak English very well437 78.7% Speak English less than very well55.8% of residents speak other language at home 821 91.6% Speak English very well75 8.4% Speak English less than very well
White (Caucasian) - Speak only English Native:
98.3% (11,804)Foreign-born:
49.4% (48)
White (Caucasian) - Speak another language Native:
2.0% (238)Foreign-born:
44.4% (43)
Black or African American - Speak only English Native:
97.8% (325)Foreign-born:
43.5% (38)
Black or African American - Speak another language Native:
2.1% (7)Foreign-born:
41.2% (36)
Asian - Speak only English Native:
94.8% (39)Foreign-born:
3.7% (25)
Other race - Speak only English Native:
16.0% (42)Foreign-born:
6.2% (33)
Other race - Speak another language Native:
33.2% (88)Foreign-born:
88.1% (473)
Two or more races - Speak only English Native:
71.4% (1,052)Foreign-born:
5.2% (23)
Two or more races - Speak another language Native:
30.6% (450)Foreign-born:
94.1% (407)
White alone - Speak only English Native:
99.2% (11,794)Foreign-born:
100.0% (30)
Hispanic or Latino - Speak only English Native:
46.1% (640)Foreign-born:
5.4% (26)
Hispanic or Latino - Speak another language Native:
50.4% (699)Foreign-born:
86.0% (418)
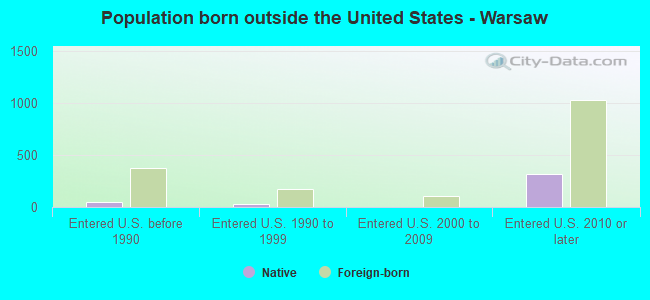
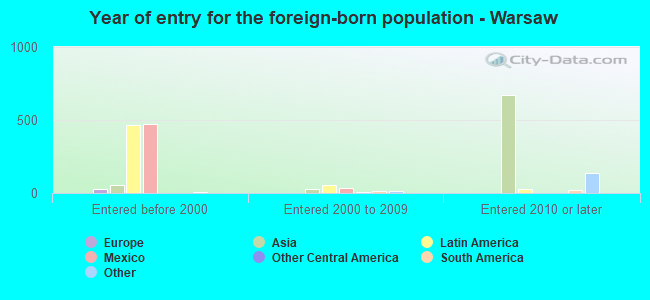
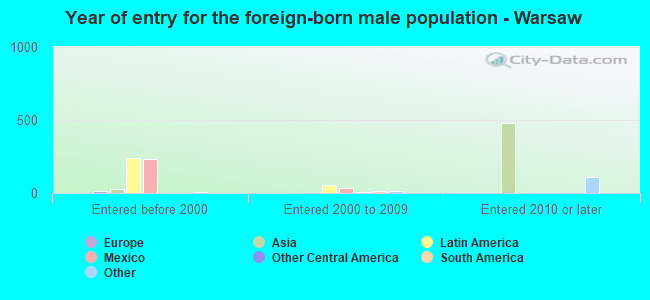
Foreign-born residents in Warsaw 1,620 residents are foreign born (4.9% Asia , 3.2% Latin America ).
This city:
9.8%Indiana:
5.6%
Marital status for residents in Warsaw Marital status - White (Caucasian) population 15 years and over
Males 35.1% Never married49.4% Now married2.7% Separated1.5% Widowed11.4% DivorcedFemales 25.5% Never married39.8% Now married3.2% Separated6.2% Widowed25.4% DivorcedWomen who gave birth in the past 12 months Now married:
90.8% (178)Unmarried:
9.2% (18)
Women who did not give birth in the past 12 months Now married:
41.9% (1,131)Unmarried:
58.1% (1,570)
Marital status - Black or African American population 15 years and over
Males 13.6% Never married0.0% Now married0.0% Separated0.0% Widowed86.4% DivorcedFemales 8.9% Never married41.1% Now married50.0% Separated0.0% Widowed0.0% DivorcedWomen who did not give birth in the past 12 months Now married:
91.1% (113)Unmarried:
8.9% (11)
Marital status - American Indian / Alaska Native population 15 years and over
Males 0.0% Never married100.0% Now married0.0% Separated0.0% Widowed0.0% DivorcedFemales 25.0% Never married75.0% Now married0.0% Separated0.0% Widowed0.0% DivorcedWomen who did not give birth in the past 12 months Now married:
0.0% (0)Unmarried:
100.0% (5)
Marital status - Asian population 15 years and over
Males 38.5% Never married57.7% Now married0.0% Separated0.0% Widowed3.8% DivorcedFemales 44.9% Never married55.1% Now married0.0% Separated0.0% Widowed0.0% DivorcedWomen who did not give birth in the past 12 months Now married:
44.7% (92)Unmarried:
55.3% (114)
Marital status - Other race population 15 years and over
Males 58.0% Never married42.0% Now married0.0% Separated0.0% Widowed0.0% DivorcedFemales 46.5% Never married44.6% Now married8.9% Separated0.0% Widowed0.0% DivorcedWomen who did not give birth in the past 12 months Now married:
16.1% (17)Unmarried:
83.9% (89)
Marital status - Two or more races population 15 years and over
Males 56.7% Never married25.0% Now married13.9% Separated0.0% Widowed4.5% DivorcedFemales 65.2% Never married30.3% Now married0.0% Separated1.4% Widowed3.1% DivorcedWomen who did not give birth in the past 12 months Now married:
9.5% (57)Unmarried:
90.5% (546)
Marital status - White alone, not Hispanic / Latino population 15 years and over
Males 34.4% Never married49.9% Now married2.7% Separated1.5% Widowed11.4% DivorcedFemales 25.5% Never married39.7% Now married3.2% Separated6.4% Widowed25.1% DivorcedWomen who gave birth in the past 12 months Now married:
90.8% (184)Unmarried:
9.2% (19)
Women who did not give birth in the past 12 months Now married:
42.2% (1,127)Unmarried:
57.8% (1,546)
Marital status - Hispanic or Latino population 15 years and over
Males 46.4% Never married41.8% Now married10.0% Separated0.0% Widowed1.8% DivorcedFemales 57.0% Never married35.3% Now married1.8% Separated0.0% Widowed5.9% DivorcedWomen who did not give birth in the past 12 months Now married:
14.0% (90)Unmarried:
86.0% (552)
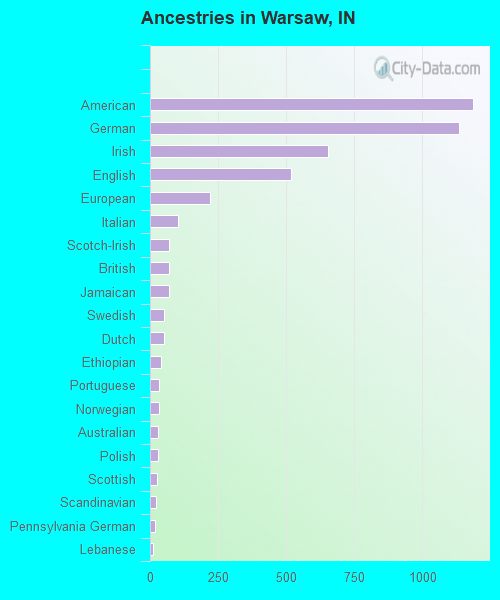
Ancestries in Warsaw
1,185 16.5% American1,133 15.8% German652 9.1% Irish516 7.2% English221 3.1% European101 1.4% Italian71 1.0% Scotch-Irish68 0.9% British68 0.9% Jamaican53 0.7% Swedish50 0.7% Dutch41 0.6% Ethiopian33 0.5% Portuguese32 0.4% Norwegian28 0.4% Australian28 0.4% Polish25 0.3% Scottish21 0.3% Scandinavian18 0.3% Pennsylvania German11 0.2% Lebanese9 0.1% Welsh7 0.10% Slavic5 0.07% Swiss
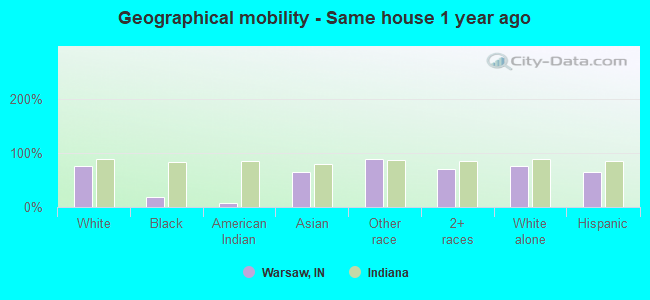
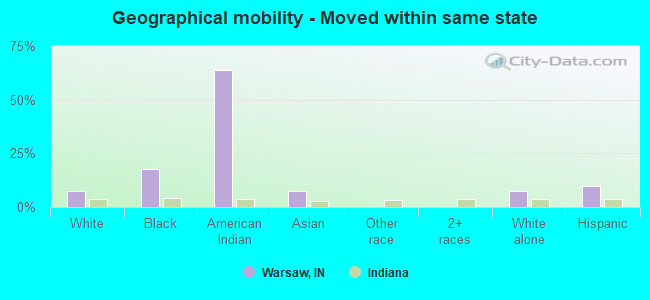
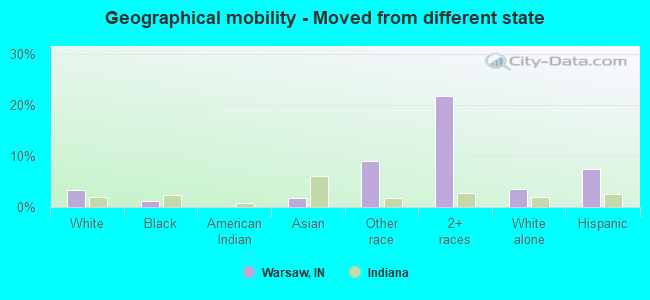
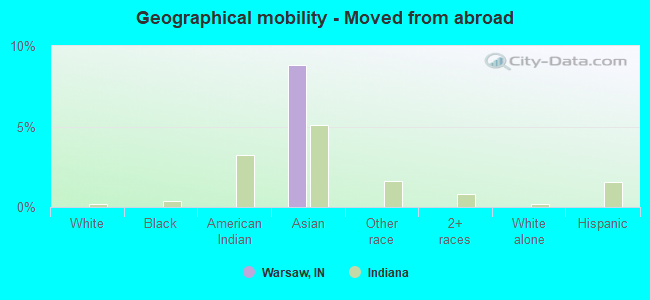
Geographical mobility in Warsaw Same house 1 year ago 9,729 75.7% White (Caucasian)76 18.9% Black or African American28 7.2% American Indian / Alaska Native489 64.4% Asian456 88.7% Other race1,094 70.5% Two or more races9,718 76.1% White alone, not Hispanic / Latino1,306 64.7% Hispanic or LatinoMoved within same county 1,853 14.4% White / Caucasian231 57.2% Black or African American118 15.6% Asian346 22.3% Two or more races1,766 13.8% White alone, not Hispanic / Latino330 16.3% Hispanic or LatinoMoved within same state 987 7.7% White / Caucasian72 17.9% Black or African American248 64.0% American Indian / Alaska Native57 7.5% Asian964 7.5% White alone, not Hispanic / Latino196 9.7% Hispanic or LatinoMoved from different state 434 3.4% White / Caucasian5 1.1% Black or African American14 1.8% Asian46 9.0% Other race336 21.7% Two or more races453 3.5% White alone, not Hispanic / Latino151 7.5% Hispanic or LatinoMoved from abroad 67 8.8% Asian
Children Nativity (place of birth) in Warsaw
Children under 6 years - Living with two parents Both parents native 749 100.0% NativeBoth parents foreign-born 15 100.0% Foreign-bornOne native, one foreign-born parent 73 100.0% NativeChildren under 6 years - Living with one parent Native parent 460 100.0% NativeChildren 6 to 17 years - Living with two parents Both parents native 1,098 96.0% Native46 4.0% Foreign-bornBoth parents foreign-born 88 100.0% NativeOne native, one foreign-born parent 56 100.0% NativeChildren 6 to 17 years - Living with one parent Native parent 1,131 100.0% NativeForeign-born parent 8 52.0% Native8 48.0% Foreign-born
Grandparents responsible for own grandchildren in Warsaw
Grandparents (30 to 59 years) White / Caucasian 36 40.4% Responsible for grandchildren52 59.6% Not responsible for grandchildrenWhite alone, not Hispanic / Latino 37 50.5% Responsible for grandchildren36 49.5% Not responsible for grandchildrenGrandparents (60 years and over) White / Caucasian 23 25.5% Responsible for grandchildren67 74.5% Not responsible for grandchildrenWhite alone, not Hispanic / Latino 14 20.5% Responsible for grandchildren55 79.5% Not responsible for grandchildren