Races in Waseca, Minnesota (MN) Detailed Stats
Data:
Races - White alone (%)
Races - White alone (% change since 2000)
Races - Black alone (%)
Races - Black alone (% change since 2000)
Races - American Indian alone (%)
Races - American Indian alone (% change since 2000)
Races - Asian alone (%)
Races - Asian alone (% change since 2000)
Races - Hispanic (%)
Races - Hispanic (% change since 2000)
Races - Native Hawaiian and Other Pacific Islander alone (%)
Races - Native Hawaiian and Other Pacific Islander alone (% change since 2000)
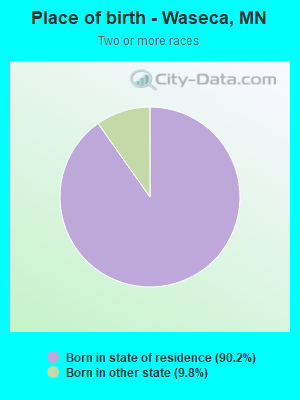
Races - Two or more races(%)
Races - Two or more races(% change since 2000)
Races - Other race alone (%)
Races - Other race alone (% change since 2000)
Racial diversity
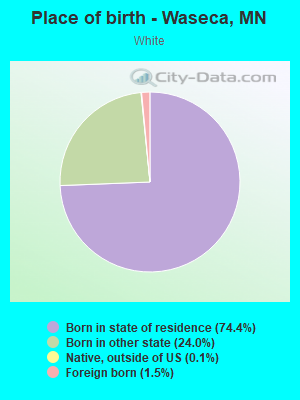
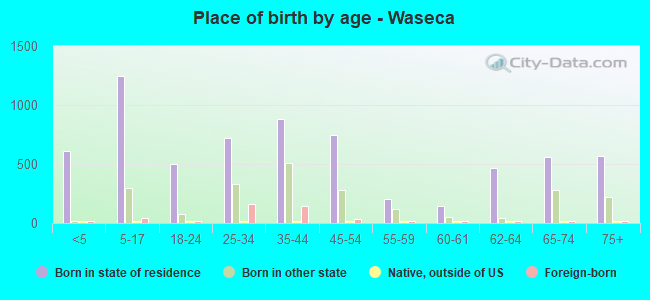
Place of birth - Born in state of residence (%)
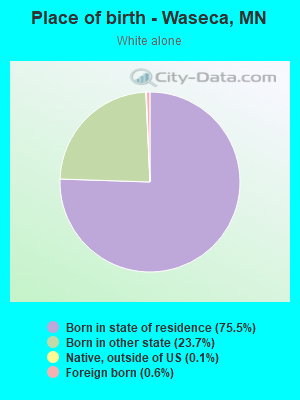
Place of birth - Born in state of residence (%) - White
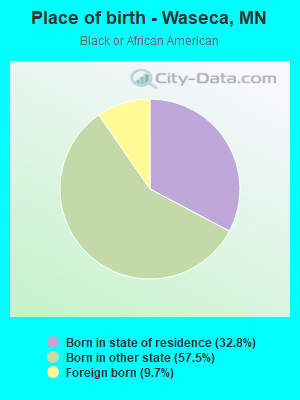
Place of birth - Born in state of residence (%) - Black or African American
Place of birth - Born in state of residence (%) - Asian
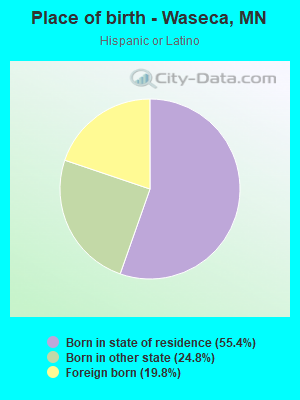
Place of birth - Born in state of residence (%) - Hispanic or Latino
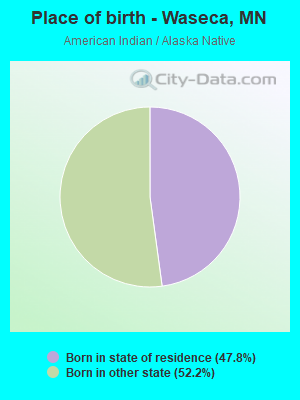
Place of birth - Born in state of residence (%) - American Indian and Alaska Native
Place of birth - Born in state of residence (%) - Multirace
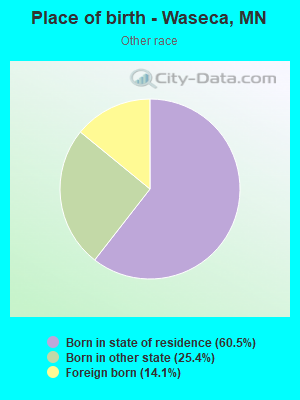
Place of birth - Born in state of residence (%) - Other Race
Place of birth - Born in other state (%)
Place of birth - Born in other state (%) - White
Place of birth - Born in other state (%) - Black or African American
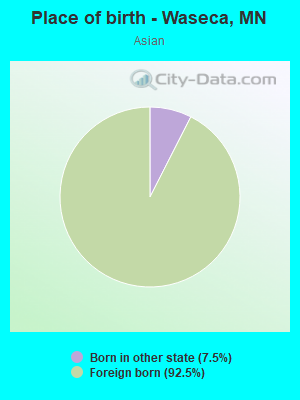
Place of birth - Born in other state (%) - Asian
Place of birth - Born in other state (%) - Hispanic or Latino
Place of birth - Born in other state (%) - American Indian and Alaska Native
Place of birth - Born in other state (%) - Multirace
Place of birth - Born in other state (%) - Other Race
Place of birth - Native, outside of US (%)
Place of birth - Native, outside of US (%) - White
Place of birth - Native, outside of US (%) - Black or African American
Place of birth - Native, outside of US (%) - Asian
Place of birth - Native, outside of US (%) - Hispanic or Latino
Place of birth - Native, outside of US (%) - American Indian and Alaska Native
Place of birth - Native, outside of US (%) - Multirace
Place of birth - Native, outside of US (%) - Other Race
Place of birth - Foreign born (%)
Place of birth - Foreign born (%) - White
Place of birth - Foreign born (%) - Black or African American
Place of birth - Foreign born (%) - Asian
Place of birth - Foreign born (%) - Hispanic or Latino
Place of birth - Foreign born (%) - American Indian and Alaska Native
Place of birth - Foreign born (%) - Multirace
Place of birth - Foreign born (%) - Other Race
Residents speaking English at home (%)
Residents speaking English at home - Born in the United States (%)
Residents speaking English at home - Native, born elsewhere (%)
Residents speaking English at home - Foreign born (%)
Residents speaking Spanish at home (%)
Residents speaking Spanish at home - Born in the United States (%)
Residents speaking Spanish at home - Native, born elsewhere (%)
Residents speaking Spanish at home - Foreign born (%)
Residents speaking other language at home (%)
Residents speaking other language at home - Born in the United States (%)
Residents speaking other language at home - Native, born elsewhere (%)
Residents speaking other language at home - Foreign born (%)
Marital status - Never married (%)
Marital status - Now married (%)
Marital status - Separated (%)
Marital status - Widowed (%)
Marital status - Divorced (%)
Ancestries Reported - Arab (%)
Ancestries Reported - Czech (%)
Ancestries Reported - Danish (%)
Ancestries Reported - Dutch (%)
Ancestries Reported - English (%)
Ancestries Reported - French (%)
Ancestries Reported - French Canadian (%)
Ancestries Reported - German (%)
Ancestries Reported - Greek (%)
Ancestries Reported - Hungarian (%)
Ancestries Reported - Irish (%)
Ancestries Reported - Italian (%)
Ancestries Reported - Lithuanian (%)
Ancestries Reported - Norwegian (%)
Ancestries Reported - Polish (%)
Ancestries Reported - Portuguese (%)
Ancestries Reported - Russian (%)
Ancestries Reported - Scotch-Irish (%)
Ancestries Reported - Scottish (%)
Ancestries Reported - Slovak (%)
Ancestries Reported - Subsaharan African (%)
Ancestries Reported - Swedish (%)
Ancestries Reported - Swiss (%)
Ancestries Reported - Ukrainian (%)
Ancestries Reported - United States (%)
Ancestries Reported - Welsh (%)
Ancestries Reported - West Indian (%)
Ancestries Reported - Other (%)
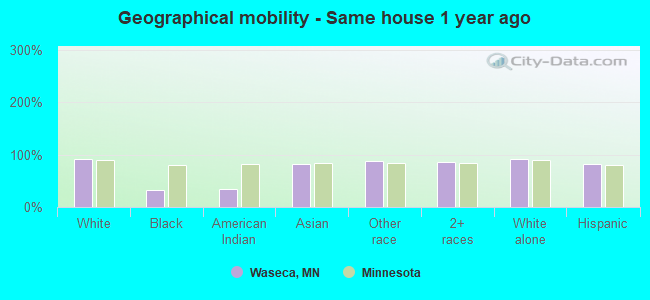
Geographical mobility - Same house 1 year ago (%)
Geographical mobility - Same house 1 year ago (%) - White
Geographical mobility - Same house 1 year ago (%) - Black or African American
Geographical mobility - Same house 1 year ago (%) - Asian
Geographical mobility - Same house 1 year ago (%) - Hispanic or Latino
Geographical mobility - Same house 1 year ago (%) - American Indian and Alaska Native
Geographical mobility - Same house 1 year ago (%) - Multirace
Geographical mobility - Same house 1 year ago (%) - Other Race
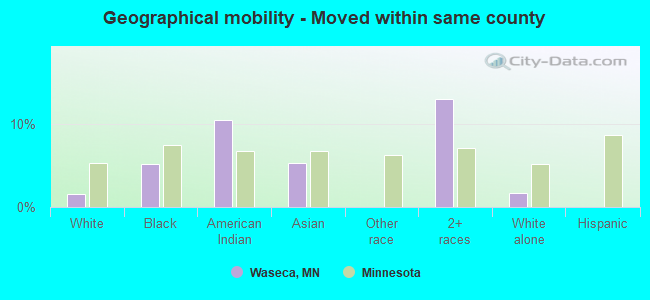
Geographical mobility - Moved within same county (%)
Geographical mobility - Moved within same county (%) - White
Geographical mobility - Moved within same county (%) - Black or African American
Geographical mobility - Moved within same county (%) - Asian
Geographical mobility - Moved within same county (%) - Hispanic or Latino
Geographical mobility - Moved within same county (%) - American Indian and Alaska Native
Geographical mobility - Moved within same county (%) - Multirace
Geographical mobility - Moved within same county (%) - Other Race
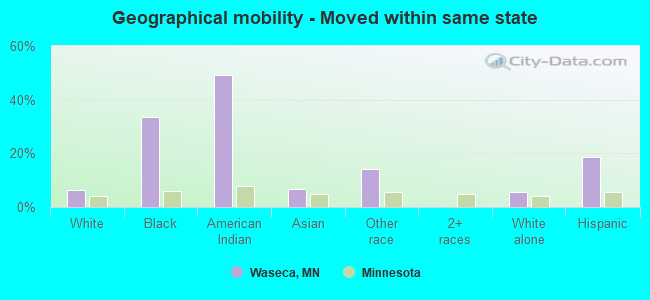
Geographical mobility - Moved from different county within same state (%)
Geographical mobility - Moved from different county within same state (%) - White
Geographical mobility - Moved from different county within same state (%) - Black or African American
Geographical mobility - Moved from different county within same state (%) - Asian
Geographical mobility - Moved from different county within same state (%) - Hispanic or Latino
Geographical mobility - Moved from different county within same state (%) - American Indian and Alaska Native
Geographical mobility - Moved from different county within same state (%) - Multirace
Geographical mobility - Moved from different county within same state (%) - Other Race
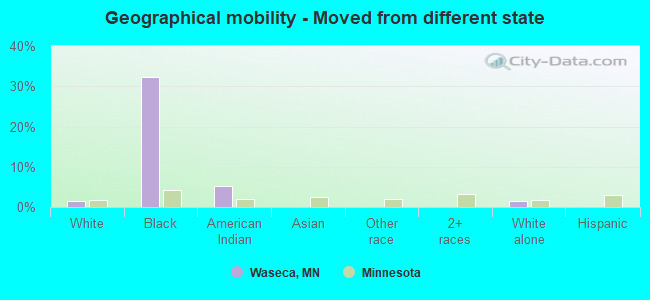
Geographical mobility - Moved from different state (%)
Geographical mobility - Moved from different state (%) - White
Geographical mobility - Moved from different state (%) - Black or African American
Geographical mobility - Moved from different state (%) - Asian
Geographical mobility - Moved from different state (%) - Hispanic or Latino
Geographical mobility - Moved from different state (%) - American Indian and Alaska Native
Geographical mobility - Moved from different state (%) - Multirace
Geographical mobility - Moved from different state (%) - Other Race
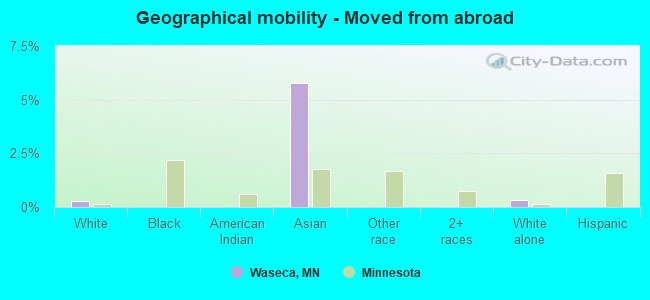
Geographical mobility - Moved from abroad (%)
Geographical mobility - Moved from abroad (%) - White
Geographical mobility - Moved from abroad (%) - Black or African American
Geographical mobility - Moved from abroad (%) - Asian
Geographical mobility - Moved from abroad (%) - Hispanic or Latino
Geographical mobility - Moved from abroad (%) - American Indian and Alaska Native
Geographical mobility - Moved from abroad (%) - Multirace
Geographical mobility - Moved from abroad (%) - Other Race
Place of birth for the foreign-born population - Ireland (%)
Place of birth for the foreign-born population - Denmark (%)
Place of birth for the foreign-born population - Norway (%)
Place of birth for the foreign-born population - Sweden (%)
Place of birth for the foreign-born population - United Kingdom (%)
Place of birth for the foreign-born population - England (%)
Place of birth for the foreign-born population - Scotland (%)
Place of birth for the foreign-born population - Other Northern Europe (%)
Place of birth for the foreign-born population - Austria (%)
Place of birth for the foreign-born population - Belgium (%)
Place of birth for the foreign-born population - France (%)
Place of birth for the foreign-born population - Germany (%)
Place of birth for the foreign-born population - Netherlands (%)
Place of birth for the foreign-born population - Switzerland (%)
Place of birth for the foreign-born population - Other Western Europe (%)
Place of birth for the foreign-born population - Greece (%)
Place of birth for the foreign-born population - Italy (%)
Place of birth for the foreign-born population - Portugal (%)
Place of birth for the foreign-born population - Spain (%)
Place of birth for the foreign-born population - Other Southern Europe (%)
Place of birth for the foreign-born population - Albania (%)
Place of birth for the foreign-born population - Belarus (%)
Place of birth for the foreign-born population - Bosnia and Herzegovina (%)
Place of birth for the foreign-born population - Bulgaria (%)
Place of birth for the foreign-born population - Croatia (%)
Place of birth for the foreign-born population - Czechoslovakia (%)
Place of birth for the foreign-born population - Hungary (%)
Place of birth for the foreign-born population - Latvia (%)
Place of birth for the foreign-born population - Lithuania (%)
Place of birth for the foreign-born population - North Macedonia (Macedonia) (%)
Place of birth for the foreign-born population - Moldova (%)
Place of birth for the foreign-born population - Poland (%)
Place of birth for the foreign-born population - Romania (%)
Place of birth for the foreign-born population - Russia (%)
Place of birth for the foreign-born population - Serbia (%)
Place of birth for the foreign-born population - Ukraine (%)
Place of birth for the foreign-born population - Other Eastern Europe (%)
Place of birth for the foreign-born population - China (%)
Place of birth for the foreign-born population - Hong Kong (%)
Place of birth for the foreign-born population - Taiwan (%)
Place of birth for the foreign-born population - Japan (%)
Place of birth for the foreign-born population - Korea (%)
Place of birth for the foreign-born population - Other Eastern Asia (%)
Place of birth for the foreign-born population - Afghanistan (%)
Place of birth for the foreign-born population - Bangladesh (%)
Place of birth for the foreign-born population - India (%)
Place of birth for the foreign-born population - Iran (%)
Place of birth for the foreign-born population - Kazakhstan (%)
Place of birth for the foreign-born population - Nepal (%)
Place of birth for the foreign-born population - Pakistan (%)
Place of birth for the foreign-born population - Sri Lanka (%)
Place of birth for the foreign-born population - Uzbekistan (%)
Place of birth for the foreign-born population - Other South Central Asia (%)
Place of birth for the foreign-born population - Burma (%)
Place of birth for the foreign-born population - Cambodia (%)
Place of birth for the foreign-born population - Indonesia (%)
Place of birth for the foreign-born population - Laos (%)
Place of birth for the foreign-born population - Malaysia (%)
Place of birth for the foreign-born population - Philippines (%)
Place of birth for the foreign-born population - Singapore (%)
Place of birth for the foreign-born population - Thailand (%)
Place of birth for the foreign-born population - Vietnam (%)
Place of birth for the foreign-born population - Other South Eastern Asia (%)
Place of birth for the foreign-born population - Armenia (%)
Place of birth for the foreign-born population - Iraq (%)
Place of birth for the foreign-born population - Israel (%)
Place of birth for the foreign-born population - Jordan (%)
Place of birth for the foreign-born population - Kuwait (%)
Place of birth for the foreign-born population - Lebanon (%)
Place of birth for the foreign-born population - Saudi Arabia (%)
Place of birth for the foreign-born population - Syria (%)
Place of birth for the foreign-born population - Turkey (%)
Place of birth for the foreign-born population - Yemen (%)
Place of birth for the foreign-born population - Other Western Asia (%)
Place of birth for the foreign-born population - Eritrea (%)
Place of birth for the foreign-born population - Ethiopia (%)
Place of birth for the foreign-born population - Kenya (%)
Place of birth for the foreign-born population - Somalia (%)
Place of birth for the foreign-born population - Uganda (%)
Place of birth for the foreign-born population - Zimbabwe (%)
Place of birth for the foreign-born population - Other Eastern Africa (%)
Place of birth for the foreign-born population - Cameroon (%)
Place of birth for the foreign-born population - Congo (%)
Place of birth for the foreign-born population - Democratic Republic of Congo (Zaire) (%)
Place of birth for the foreign-born population - Other Middle Africa (%)
Place of birth for the foreign-born population - Egypt (%)
Place of birth for the foreign-born population - Morocco (%)
Place of birth for the foreign-born population - Sudan (%)
Place of birth for the foreign-born population - Other Northern Africa (%)
Place of birth for the foreign-born population - South Africa (%)
Place of birth for the foreign-born population - Other Southern Africa (%)
Place of birth for the foreign-born population - Cabo Verde (%)
Place of birth for the foreign-born population - Ghana (%)
Place of birth for the foreign-born population - Liberia (%)
Place of birth for the foreign-born population - Nigeria (%)
Place of birth for the foreign-born population - Senegal (%)
Place of birth for the foreign-born population - Sierra Leone (%)
Place of birth for the foreign-born population - Other Western Africa (%)
Place of birth for the foreign-born population - Australia (%)
Place of birth for the foreign-born population - New Zealand (%)
Place of birth for the foreign-born population - Fiji (%)
Place of birth for the foreign-born population - Micronesia (%)
Place of birth for the foreign-born population - Bahamas (%)
Place of birth for the foreign-born population - Barbados (%)
Place of birth for the foreign-born population - Cuba (%)
Place of birth for the foreign-born population - Dominica (%)
Place of birth for the foreign-born population - Dominican Republic (%)
Place of birth for the foreign-born population - Grenada (%)
Place of birth for the foreign-born population - Haiti (%)
Place of birth for the foreign-born population - Jamaica (%)
Place of birth for the foreign-born population - St. Vincent and the Grenadines (%)
Place of birth for the foreign-born population - Trinidad and Tobago (%)
Place of birth for the foreign-born population - West Indies (%)
Place of birth for the foreign-born population - Other Caribbean (%)
Place of birth for the foreign-born population - Belize (%)
Place of birth for the foreign-born population - Costa Rica (%)
Place of birth for the foreign-born population - El Salvador (%)
Place of birth for the foreign-born population - Guatemala (%)
Place of birth for the foreign-born population - Honduras (%)
Place of birth for the foreign-born population - Mexico (%)
Place of birth for the foreign-born population - Nicaragua (%)
Place of birth for the foreign-born population - Panama (%)
Place of birth for the foreign-born population - Other Central America (%)
Place of birth for the foreign-born population - Argentina (%)
Place of birth for the foreign-born population - Bolivia (%)
Place of birth for the foreign-born population - Brazil (%)
Place of birth for the foreign-born population - Chile (%)
Place of birth for the foreign-born population - Colombia (%)
Place of birth for the foreign-born population - Ecuador (%)
Place of birth for the foreign-born population - Guyana (%)
Place of birth for the foreign-born population - Peru (%)
Place of birth for the foreign-born population - Uruguay (%)
Place of birth for the foreign-born population - Venezuela (%)
Place of birth for the foreign-born population - Other South America (%)
Place of birth for the foreign-born population - Canada (%)
Place of birth for the foreign-born population - Other Northern America (%)
Place of birth for the foreign-born population - Other (%)
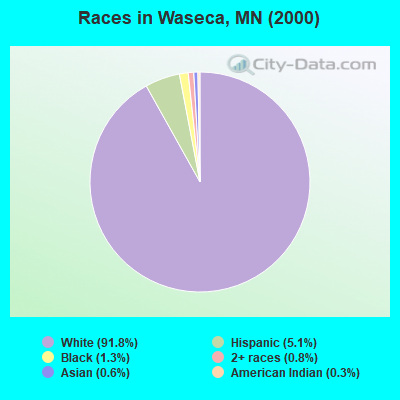
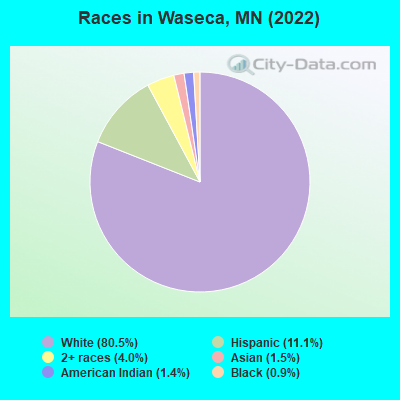
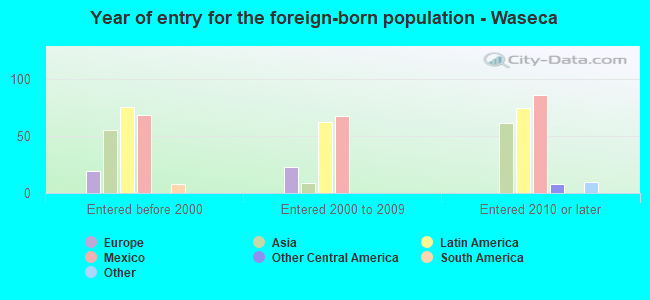
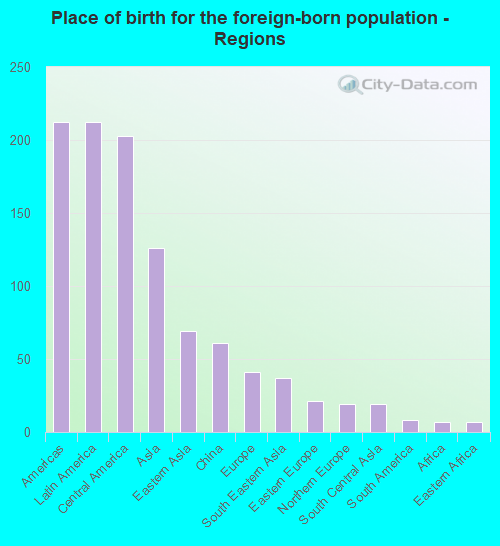
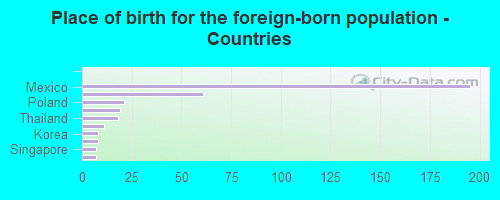
According to 2022 data, the most numerous races in Waseca, MN are White alone (7,444 residents), Black alone (80 residents), and Hispanic (1,024 residents). 88.1% of Waseca residents speak English at home. 4.2% of Waseca, MN residents are foreign-born (2.2% born in Latin America, 1.3% born in Asia, 0.4% born in Europe), which is 91.1% less than the foreign-born rate of 8.0% across the entire state of Minnesota.
Race distribution in Waseca
2000 2022
4,337,143 88.2% White alone 168,813 3.4% Black alone 143,382 2.9% Hispanic 141,083 2.9% Asian alone 70,304 1.4% Two or more races 52,009 1.1% American Indian alone 5,031 0.1% Other race alone 1,714 0.03% Native Hawaiian and Other
4,356,347 76.2% White alone 395,179 6.9% Black alone 333,830 5.8% Hispanic 294,800 5.2% Asian alone 259,649 4.5% Two or more races 42,125 0.7% American Indian alone 32,976 0.6% Other race alone 2,278 0.04% Native Hawaiian and Other
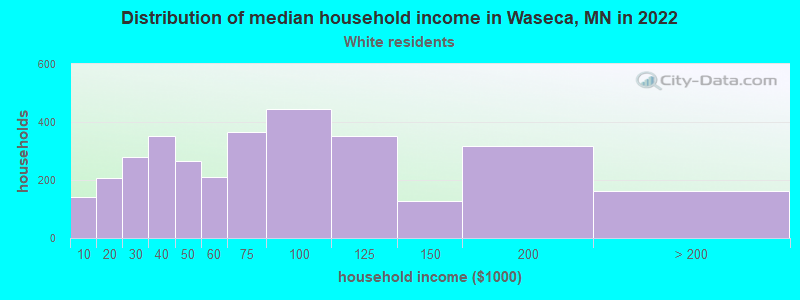
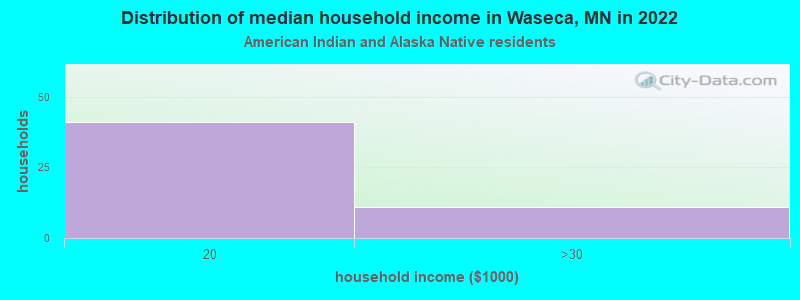
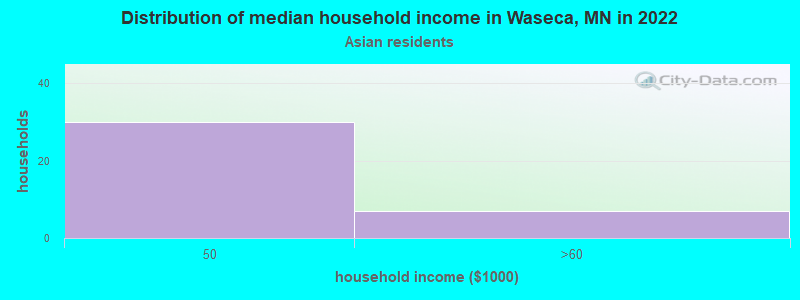
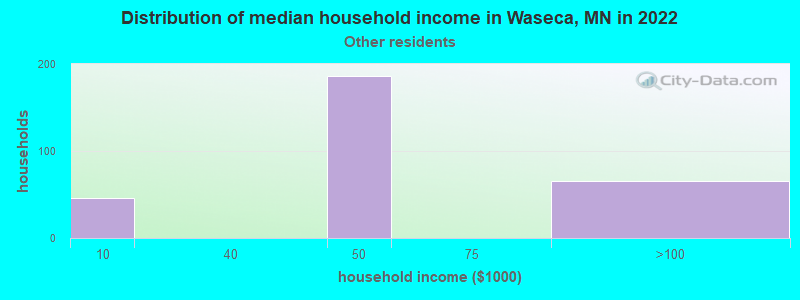
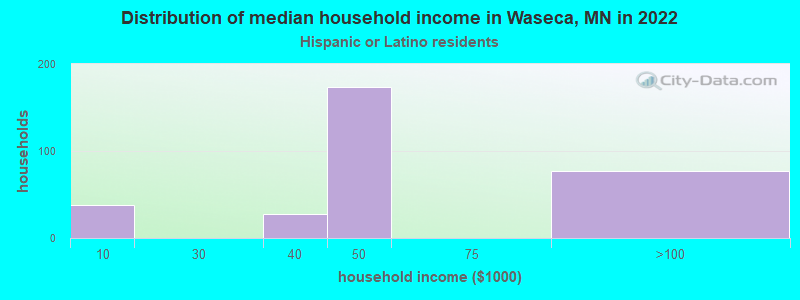
Income and house value in Waseca Median household income in 2022 $66,092 White non-Hispanic householders$41,824 Some other race householders$38,659 Hispanic or Latino race householdersMedian 2022 house value $197,316 White Non-Hispanic householders$156,218 Black or African American householders $360,073 Asian householders$151,781 Some other race householders$113,953 Hispanic or Latino householders
Median age by race in Waseca
42.7 Median age for White residents42.1 43.3 36.6 Median age for Black or African American residents40.9 34.3 43.1 Median age for American Indian / Alaska Native residents-666,666,666.0 39.0 34.5 Median age for Asian residents12.5 34.4 -744,336,568.8 Median age for Native Hawaiian / Pacific Islander residents-856,799,036.4 -534,959,349.1 26.4 Median age for Other race residents19.5 31.5 9.4 Median age for Two or more races residents6.3 20.6 43.1 Median age for White alone residents42.4 43.6 27.1 Median age for Hispanic or Latino residents19.5 32.7
Owner/renter occupied households by race in Waseca
House owners and renters - White residents 2,475 76.8% Owner occupied749 23.2% Renter occupiedHouse owners and renters - American Indian / Alaska Native residents 42 100.0% Renter occupiedHouse owners and renters - Asian residents 45 84.0% Owner occupied9 16.0% Renter occupiedHouse owners and renters - Other race residents 242 74.6% Owner occupied82 25.4% Renter occupiedHouse owners and renters - Two or more races residents 40 100.0% Renter occupiedHouse owners and renters - White alone residents 2,467 77.0% Owner occupied737 23.0% Renter occupiedHouse owners and renters - Hispanic or Latino residents 208 68.2% Owner occupied97 31.8% Renter occupied
Language usage in Waseca
English speakers - Total 88.1% of residents of Waseca speak English at home.
9.1% of residents speak Spanish at home 366 46.9% Speak English very well414 53.1% Speak English less than very well2.6% of residents speak other language at home 163 72.1% Speak English very well63 27.9% Speak English less than very well
English speakers - Born in the United States 88.6% of residents of Waseca speak English at home.
9.5% of residents speak Spanish at home 198 95.2% Speak English very well10 4.8% Speak English less than very well1.5% of residents speak other language at home 32 100.0% Speak English very well
All residents speak only English at home
English speakers - Foreign-born 11.9% of residents of Waseca speak English at home.
50.6% of residents speak Spanish at home 58 29.6% Speak English very well138 70.4% Speak English less than very well35.7% of residents speak other language at home 76 55.1% Speak English very well62 44.9% Speak English less than very well
White (Caucasian) - Speak another language Native:
1.3% (90)Foreign-born:
87.1% (97)
Asian - Speak another language Native:
94.5% (9)Foreign-born:
63.6% (79)
Other race - Speak another language Native:
93.2% (616)Foreign-born:
97.5% (117)
White alone - Speak another language Native:
0.8% (53)Foreign-born:
95.9% (45)
Hispanic or Latino - Speak another language Native:
79.6% (556)Foreign-born:
96.9% (195)
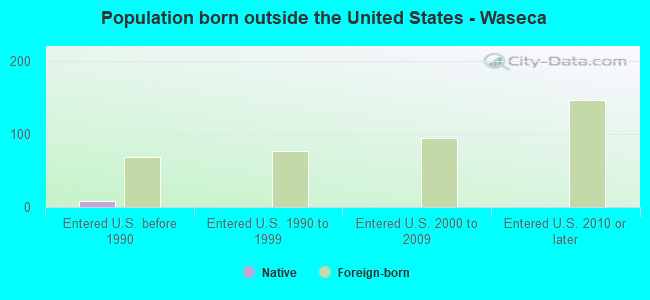
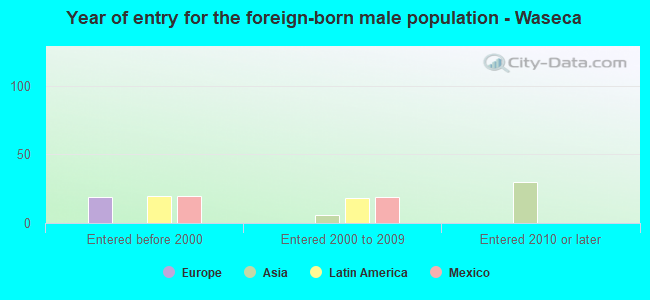
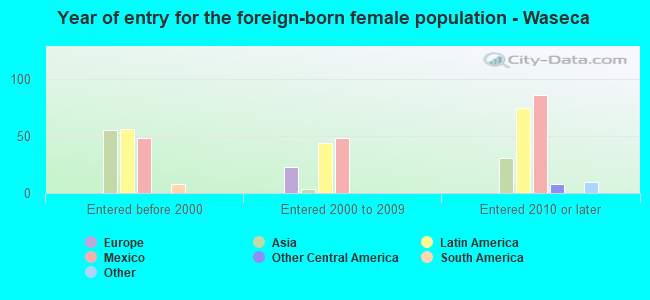
Foreign-born residents in Waseca 387 residents are foreign born (2.2% Latin America , 1.3% Asia , 0.4% Europe ).
This city:
4.2%Minnesota:
8.5%
Marital status for residents in Waseca Marital status - White (Caucasian) population 15 years and over
Males 28.2% Never married57.4% Now married0.7% Separated3.4% Widowed10.3% DivorcedFemales 24.9% Never married43.2% Now married1.0% Separated14.3% Widowed16.7% DivorcedWomen who gave birth in the past 12 months Now married:
26.5% (17)Unmarried:
73.5% (48)
Women who did not give birth in the past 12 months Now married:
42.8% (740)Unmarried:
57.2% (990)
Marital status - Black or African American population 15 years and over
Males 0.0% Never married71.4% Now married0.0% Separated28.6% Widowed0.0% DivorcedFemales 63.1% Never married10.8% Now married26.2% Separated0.0% Widowed0.0% DivorcedWomen who did not give birth in the past 12 months Now married:
36.9% (25)Unmarried:
63.1% (42)
Marital status - American Indian / Alaska Native population 15 years and over
Males 75.7% Never married24.3% Now married0.0% Separated0.0% Widowed0.0% DivorcedFemales 63.2% Never married17.9% Now married9.5% Separated0.0% Widowed9.5% DivorcedWomen who did not give birth in the past 12 months Now married:
22.1% (18)Unmarried:
77.9% (62)
Marital status - Asian population 15 years and over
Males 0.0% Never married100.0% Now married0.0% Separated0.0% Widowed0.0% DivorcedFemales 21.2% Never married78.8% Now married0.0% Separated0.0% Widowed0.0% DivorcedWomen who gave birth in the past 12 months Now married:
100.0% (8)Unmarried:
0.0% (0)
Women who did not give birth in the past 12 months Now married:
76.6% (61)Unmarried:
23.4% (19)
Marital status - Other race population 15 years and over
Males 81.6% Never married18.4% Now married0.0% Separated0.0% Widowed0.0% DivorcedFemales 12.1% Never married44.7% Now married43.1% Separated0.0% Widowed0.0% DivorcedWomen who did not give birth in the past 12 months Now married:
87.9% (360)Unmarried:
12.1% (50)
Marital status - Two or more races population 15 years and over
Males 58.5% Never married41.5% Now married0.0% Separated0.0% Widowed0.0% DivorcedFemales 18.9% Never married81.1% Now married0.0% Separated0.0% Widowed0.0% DivorcedWomen who gave birth in the past 12 months Now married:
100.0% (38)Unmarried:
0.0% (0)
Women who did not give birth in the past 12 months Now married:
75.7% (101)Unmarried:
24.3% (33)
Marital status - White alone, not Hispanic / Latino population 15 years and over
Males 28.1% Never married57.2% Now married0.7% Separated3.5% Widowed10.5% DivorcedFemales 23.4% Never married44.2% Now married0.8% Separated14.9% Widowed16.8% DivorcedWomen who gave birth in the past 12 months Now married:
26.5% (18)Unmarried:
73.5% (49)
Women who did not give birth in the past 12 months Now married:
44.2% (719)Unmarried:
55.8% (906)
Marital status - Hispanic or Latino population 15 years and over
Males 72.5% Never married27.5% Now married0.0% Separated0.0% Widowed0.0% DivorcedFemales 29.9% Never married35.5% Now married30.8% Separated0.0% Widowed3.9% DivorcedWomen who did not give birth in the past 12 months Now married:
66.2% (328)Unmarried:
33.8% (167)
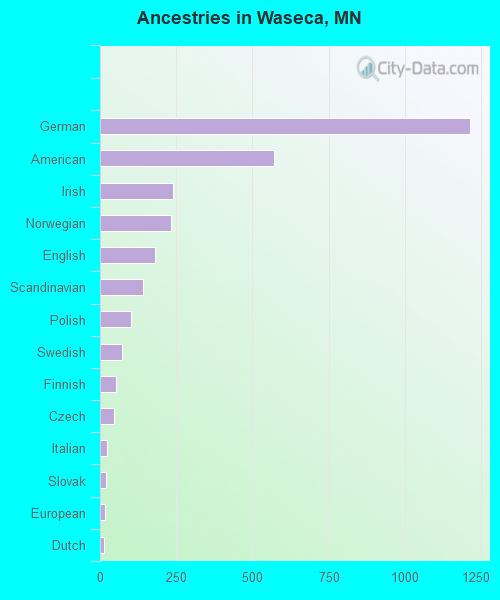
Ancestries in Waseca
1,216 27.7% German570 13.0% American240 5.5% Irish232 5.3% Norwegian182 4.1% English140 3.2% Scandinavian103 2.3% Polish73 1.7% Swedish52 1.2% Finnish47 1.1% Czech24 0.5% Italian20 0.5% Slovak15 0.3% European13 0.3% Dutch10 0.2% French Canadian8 0.2% Danish7 0.2% Canadian6 0.1% Northern European6 0.1% African4 0.09% Croatian
Children Nativity (place of birth) in Waseca
Children under 6 years - Living with two parents Both parents native 527 100.0% NativeChildren under 6 years - Living with one parent Native parent 220 100.0% NativeForeign-born parent 54 100.0% NativeChildren 6 to 17 years - Living with two parents Both parents native 757 97.5% Native19 2.5% Foreign-bornBoth parents foreign-born 21 51.1% Native20 48.9% Foreign-bornChildren 6 to 17 years - Living with one parent Native parent 484 100.0% NativeForeign-born parent 30 50.4% Native29 49.6% Foreign-born
Grandparents responsible for own grandchildren in Waseca
Grandparents (30 to 59 years) White / Caucasian 29 46.1% Responsible for grandchildren34 53.9% Not responsible for grandchildrenWhite alone, not Hispanic / Latino 30 46.2% Responsible for grandchildren35 53.8% Not responsible for grandchildrenGrandparents (60 years and over) White / Caucasian 54 63.0% Responsible for grandchildren32 37.0% Not responsible for grandchildrenWhite alone, not Hispanic / Latino 56 63.3% Responsible for grandchildren32 36.7% Not responsible for grandchildren