Races in Washington, Iowa (IA) Detailed Stats
Data:
Races - White alone (%)
Races - White alone (% change since 2000)
Races - Black alone (%)
Races - Black alone (% change since 2000)
Races - American Indian alone (%)
Races - American Indian alone (% change since 2000)
Races - Asian alone (%)
Races - Asian alone (% change since 2000)
Races - Hispanic (%)
Races - Hispanic (% change since 2000)
Races - Native Hawaiian and Other Pacific Islander alone (%)
Races - Native Hawaiian and Other Pacific Islander alone (% change since 2000)
Races - Two or more races(%)
Races - Two or more races(% change since 2000)
Races - Other race alone (%)
Races - Other race alone (% change since 2000)
Racial diversity
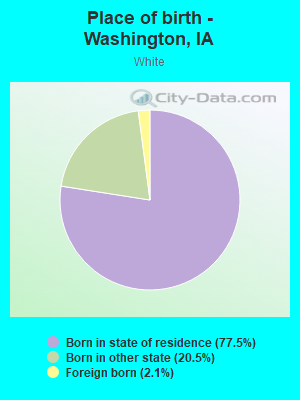
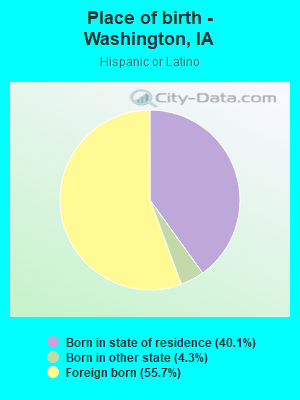
Place of birth - Born in state of residence (%)
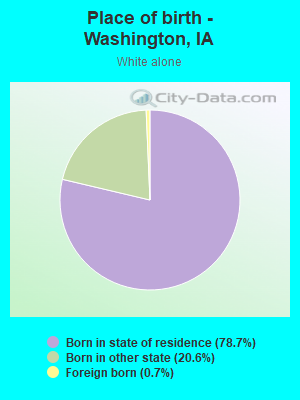
Place of birth - Born in state of residence (%) - White
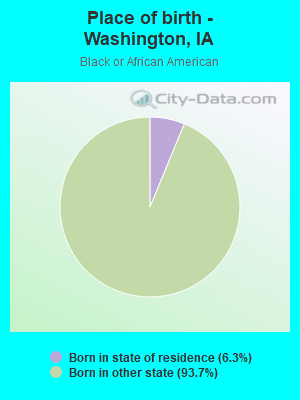
Place of birth - Born in state of residence (%) - Black or African American
Place of birth - Born in state of residence (%) - Asian
Place of birth - Born in state of residence (%) - Hispanic or Latino
Place of birth - Born in state of residence (%) - American Indian and Alaska Native
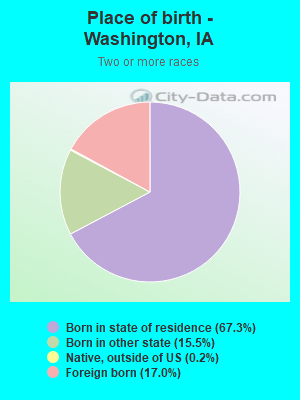
Place of birth - Born in state of residence (%) - Multirace
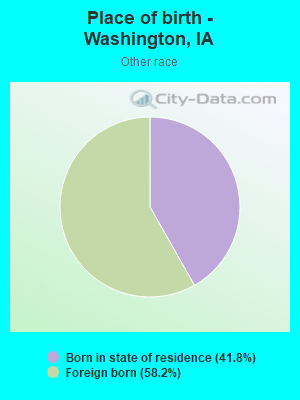
Place of birth - Born in state of residence (%) - Other Race
Place of birth - Born in other state (%)
Place of birth - Born in other state (%) - White
Place of birth - Born in other state (%) - Black or African American
Place of birth - Born in other state (%) - Asian
Place of birth - Born in other state (%) - Hispanic or Latino
Place of birth - Born in other state (%) - American Indian and Alaska Native
Place of birth - Born in other state (%) - Multirace
Place of birth - Born in other state (%) - Other Race
Place of birth - Native, outside of US (%)
Place of birth - Native, outside of US (%) - White
Place of birth - Native, outside of US (%) - Black or African American
Place of birth - Native, outside of US (%) - Asian
Place of birth - Native, outside of US (%) - Hispanic or Latino
Place of birth - Native, outside of US (%) - American Indian and Alaska Native
Place of birth - Native, outside of US (%) - Multirace
Place of birth - Native, outside of US (%) - Other Race
Place of birth - Foreign born (%)
Place of birth - Foreign born (%) - White
Place of birth - Foreign born (%) - Black or African American
Place of birth - Foreign born (%) - Asian
Place of birth - Foreign born (%) - Hispanic or Latino
Place of birth - Foreign born (%) - American Indian and Alaska Native
Place of birth - Foreign born (%) - Multirace
Place of birth - Foreign born (%) - Other Race
Residents speaking English at home (%)
Residents speaking English at home - Born in the United States (%)
Residents speaking English at home - Native, born elsewhere (%)
Residents speaking English at home - Foreign born (%)
Residents speaking Spanish at home (%)
Residents speaking Spanish at home - Born in the United States (%)
Residents speaking Spanish at home - Native, born elsewhere (%)
Residents speaking Spanish at home - Foreign born (%)
Residents speaking other language at home (%)
Residents speaking other language at home - Born in the United States (%)
Residents speaking other language at home - Native, born elsewhere (%)
Residents speaking other language at home - Foreign born (%)
Marital status - Never married (%)
Marital status - Now married (%)
Marital status - Separated (%)
Marital status - Widowed (%)
Marital status - Divorced (%)
Ancestries Reported - Arab (%)
Ancestries Reported - Czech (%)
Ancestries Reported - Danish (%)
Ancestries Reported - Dutch (%)
Ancestries Reported - English (%)
Ancestries Reported - French (%)
Ancestries Reported - French Canadian (%)
Ancestries Reported - German (%)
Ancestries Reported - Greek (%)
Ancestries Reported - Hungarian (%)
Ancestries Reported - Irish (%)
Ancestries Reported - Italian (%)
Ancestries Reported - Lithuanian (%)
Ancestries Reported - Norwegian (%)
Ancestries Reported - Polish (%)
Ancestries Reported - Portuguese (%)
Ancestries Reported - Russian (%)
Ancestries Reported - Scotch-Irish (%)
Ancestries Reported - Scottish (%)
Ancestries Reported - Slovak (%)
Ancestries Reported - Subsaharan African (%)
Ancestries Reported - Swedish (%)
Ancestries Reported - Swiss (%)
Ancestries Reported - Ukrainian (%)
Ancestries Reported - United States (%)
Ancestries Reported - Welsh (%)
Ancestries Reported - West Indian (%)
Ancestries Reported - Other (%)
Geographical mobility - Same house 1 year ago (%)
Geographical mobility - Same house 1 year ago (%) - White
Geographical mobility - Same house 1 year ago (%) - Black or African American
Geographical mobility - Same house 1 year ago (%) - Asian
Geographical mobility - Same house 1 year ago (%) - Hispanic or Latino
Geographical mobility - Same house 1 year ago (%) - American Indian and Alaska Native
Geographical mobility - Same house 1 year ago (%) - Multirace
Geographical mobility - Same house 1 year ago (%) - Other Race
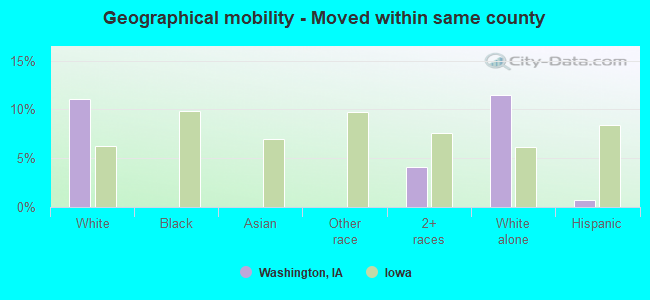
Geographical mobility - Moved within same county (%)
Geographical mobility - Moved within same county (%) - White
Geographical mobility - Moved within same county (%) - Black or African American
Geographical mobility - Moved within same county (%) - Asian
Geographical mobility - Moved within same county (%) - Hispanic or Latino
Geographical mobility - Moved within same county (%) - American Indian and Alaska Native
Geographical mobility - Moved within same county (%) - Multirace
Geographical mobility - Moved within same county (%) - Other Race
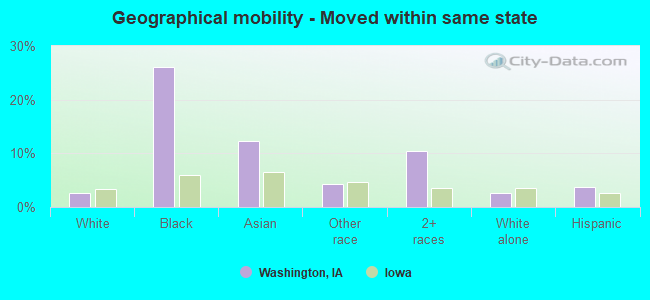
Geographical mobility - Moved from different county within same state (%)
Geographical mobility - Moved from different county within same state (%) - White
Geographical mobility - Moved from different county within same state (%) - Black or African American
Geographical mobility - Moved from different county within same state (%) - Asian
Geographical mobility - Moved from different county within same state (%) - Hispanic or Latino
Geographical mobility - Moved from different county within same state (%) - American Indian and Alaska Native
Geographical mobility - Moved from different county within same state (%) - Multirace
Geographical mobility - Moved from different county within same state (%) - Other Race
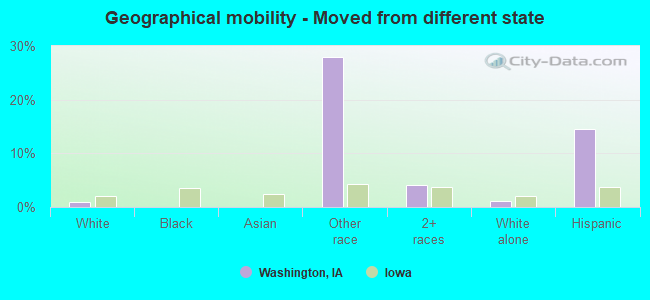
Geographical mobility - Moved from different state (%)
Geographical mobility - Moved from different state (%) - White
Geographical mobility - Moved from different state (%) - Black or African American
Geographical mobility - Moved from different state (%) - Asian
Geographical mobility - Moved from different state (%) - Hispanic or Latino
Geographical mobility - Moved from different state (%) - American Indian and Alaska Native
Geographical mobility - Moved from different state (%) - Multirace
Geographical mobility - Moved from different state (%) - Other Race
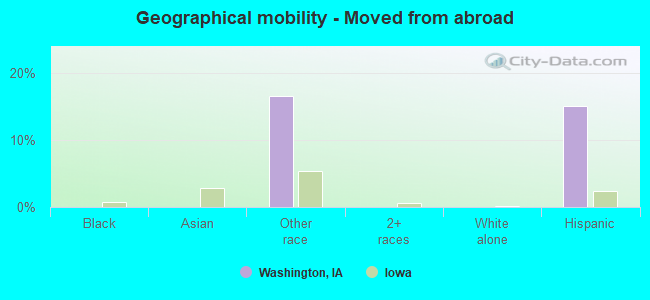
Geographical mobility - Moved from abroad (%)
Geographical mobility - Moved from abroad (%) - White
Geographical mobility - Moved from abroad (%) - Black or African American
Geographical mobility - Moved from abroad (%) - Asian
Geographical mobility - Moved from abroad (%) - Hispanic or Latino
Geographical mobility - Moved from abroad (%) - American Indian and Alaska Native
Geographical mobility - Moved from abroad (%) - Multirace
Geographical mobility - Moved from abroad (%) - Other Race
Place of birth for the foreign-born population - Ireland (%)
Place of birth for the foreign-born population - Denmark (%)
Place of birth for the foreign-born population - Norway (%)
Place of birth for the foreign-born population - Sweden (%)
Place of birth for the foreign-born population - United Kingdom (%)
Place of birth for the foreign-born population - England (%)
Place of birth for the foreign-born population - Scotland (%)
Place of birth for the foreign-born population - Other Northern Europe (%)
Place of birth for the foreign-born population - Austria (%)
Place of birth for the foreign-born population - Belgium (%)
Place of birth for the foreign-born population - France (%)
Place of birth for the foreign-born population - Germany (%)
Place of birth for the foreign-born population - Netherlands (%)
Place of birth for the foreign-born population - Switzerland (%)
Place of birth for the foreign-born population - Other Western Europe (%)
Place of birth for the foreign-born population - Greece (%)
Place of birth for the foreign-born population - Italy (%)
Place of birth for the foreign-born population - Portugal (%)
Place of birth for the foreign-born population - Spain (%)
Place of birth for the foreign-born population - Other Southern Europe (%)
Place of birth for the foreign-born population - Albania (%)
Place of birth for the foreign-born population - Belarus (%)
Place of birth for the foreign-born population - Bosnia and Herzegovina (%)
Place of birth for the foreign-born population - Bulgaria (%)
Place of birth for the foreign-born population - Croatia (%)
Place of birth for the foreign-born population - Czechoslovakia (%)
Place of birth for the foreign-born population - Hungary (%)
Place of birth for the foreign-born population - Latvia (%)
Place of birth for the foreign-born population - Lithuania (%)
Place of birth for the foreign-born population - North Macedonia (Macedonia) (%)
Place of birth for the foreign-born population - Moldova (%)
Place of birth for the foreign-born population - Poland (%)
Place of birth for the foreign-born population - Romania (%)
Place of birth for the foreign-born population - Russia (%)
Place of birth for the foreign-born population - Serbia (%)
Place of birth for the foreign-born population - Ukraine (%)
Place of birth for the foreign-born population - Other Eastern Europe (%)
Place of birth for the foreign-born population - China (%)
Place of birth for the foreign-born population - Hong Kong (%)
Place of birth for the foreign-born population - Taiwan (%)
Place of birth for the foreign-born population - Japan (%)
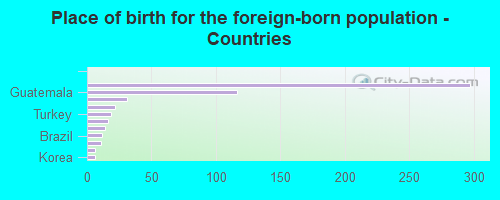
Place of birth for the foreign-born population - Korea (%)
Place of birth for the foreign-born population - Other Eastern Asia (%)
Place of birth for the foreign-born population - Afghanistan (%)
Place of birth for the foreign-born population - Bangladesh (%)
Place of birth for the foreign-born population - India (%)
Place of birth for the foreign-born population - Iran (%)
Place of birth for the foreign-born population - Kazakhstan (%)
Place of birth for the foreign-born population - Nepal (%)
Place of birth for the foreign-born population - Pakistan (%)
Place of birth for the foreign-born population - Sri Lanka (%)
Place of birth for the foreign-born population - Uzbekistan (%)
Place of birth for the foreign-born population - Other South Central Asia (%)
Place of birth for the foreign-born population - Burma (%)
Place of birth for the foreign-born population - Cambodia (%)
Place of birth for the foreign-born population - Indonesia (%)
Place of birth for the foreign-born population - Laos (%)
Place of birth for the foreign-born population - Malaysia (%)
Place of birth for the foreign-born population - Philippines (%)
Place of birth for the foreign-born population - Singapore (%)
Place of birth for the foreign-born population - Thailand (%)
Place of birth for the foreign-born population - Vietnam (%)
Place of birth for the foreign-born population - Other South Eastern Asia (%)
Place of birth for the foreign-born population - Armenia (%)
Place of birth for the foreign-born population - Iraq (%)
Place of birth for the foreign-born population - Israel (%)
Place of birth for the foreign-born population - Jordan (%)
Place of birth for the foreign-born population - Kuwait (%)
Place of birth for the foreign-born population - Lebanon (%)
Place of birth for the foreign-born population - Saudi Arabia (%)
Place of birth for the foreign-born population - Syria (%)
Place of birth for the foreign-born population - Turkey (%)
Place of birth for the foreign-born population - Yemen (%)
Place of birth for the foreign-born population - Other Western Asia (%)
Place of birth for the foreign-born population - Eritrea (%)
Place of birth for the foreign-born population - Ethiopia (%)
Place of birth for the foreign-born population - Kenya (%)
Place of birth for the foreign-born population - Somalia (%)
Place of birth for the foreign-born population - Uganda (%)
Place of birth for the foreign-born population - Zimbabwe (%)
Place of birth for the foreign-born population - Other Eastern Africa (%)
Place of birth for the foreign-born population - Cameroon (%)
Place of birth for the foreign-born population - Congo (%)
Place of birth for the foreign-born population - Democratic Republic of Congo (Zaire) (%)
Place of birth for the foreign-born population - Other Middle Africa (%)
Place of birth for the foreign-born population - Egypt (%)
Place of birth for the foreign-born population - Morocco (%)
Place of birth for the foreign-born population - Sudan (%)
Place of birth for the foreign-born population - Other Northern Africa (%)
Place of birth for the foreign-born population - South Africa (%)
Place of birth for the foreign-born population - Other Southern Africa (%)
Place of birth for the foreign-born population - Cabo Verde (%)
Place of birth for the foreign-born population - Ghana (%)
Place of birth for the foreign-born population - Liberia (%)
Place of birth for the foreign-born population - Nigeria (%)
Place of birth for the foreign-born population - Senegal (%)
Place of birth for the foreign-born population - Sierra Leone (%)
Place of birth for the foreign-born population - Other Western Africa (%)
Place of birth for the foreign-born population - Australia (%)
Place of birth for the foreign-born population - New Zealand (%)
Place of birth for the foreign-born population - Fiji (%)
Place of birth for the foreign-born population - Micronesia (%)
Place of birth for the foreign-born population - Bahamas (%)
Place of birth for the foreign-born population - Barbados (%)
Place of birth for the foreign-born population - Cuba (%)
Place of birth for the foreign-born population - Dominica (%)
Place of birth for the foreign-born population - Dominican Republic (%)
Place of birth for the foreign-born population - Grenada (%)
Place of birth for the foreign-born population - Haiti (%)
Place of birth for the foreign-born population - Jamaica (%)
Place of birth for the foreign-born population - St. Vincent and the Grenadines (%)
Place of birth for the foreign-born population - Trinidad and Tobago (%)
Place of birth for the foreign-born population - West Indies (%)
Place of birth for the foreign-born population - Other Caribbean (%)
Place of birth for the foreign-born population - Belize (%)
Place of birth for the foreign-born population - Costa Rica (%)
Place of birth for the foreign-born population - El Salvador (%)
Place of birth for the foreign-born population - Guatemala (%)
Place of birth for the foreign-born population - Honduras (%)
Place of birth for the foreign-born population - Mexico (%)
Place of birth for the foreign-born population - Nicaragua (%)
Place of birth for the foreign-born population - Panama (%)
Place of birth for the foreign-born population - Other Central America (%)
Place of birth for the foreign-born population - Argentina (%)
Place of birth for the foreign-born population - Bolivia (%)
Place of birth for the foreign-born population - Brazil (%)
Place of birth for the foreign-born population - Chile (%)
Place of birth for the foreign-born population - Colombia (%)
Place of birth for the foreign-born population - Ecuador (%)
Place of birth for the foreign-born population - Guyana (%)
Place of birth for the foreign-born population - Peru (%)
Place of birth for the foreign-born population - Uruguay (%)
Place of birth for the foreign-born population - Venezuela (%)
Place of birth for the foreign-born population - Other South America (%)
Place of birth for the foreign-born population - Canada (%)
Place of birth for the foreign-born population - Other Northern America (%)
Place of birth for the foreign-born population - Other (%)
Latest news about races in Washington, IA collected exclusively by city-data.com from local newspapers, TV, and radio stations
According to 2022 data, the most numerous races in Washington, IA are White alone (6,107 residents), Hispanic (811 residents), and Black alone (86 residents). 89.9% of Washington residents speak English at home. 7.5% of Washington, IA residents are foreign-born (5.9% born in Latin America, 1.2% born in Asia), which is 33.7% greater than the foreign-born rate of 5.0% across the entire state of Iowa.
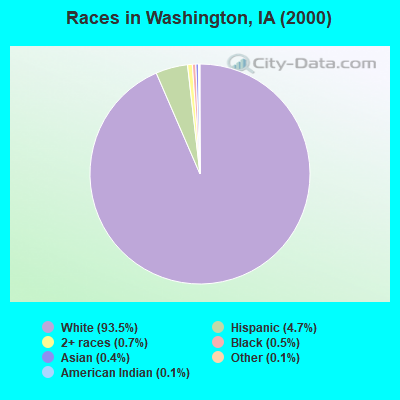
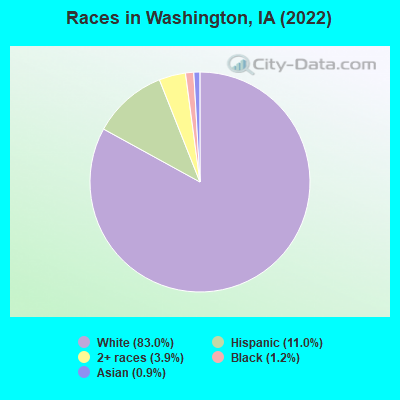
Race distribution in Washington
2000 2022
2,710,344 92.6% White alone 82,473 2.8% Hispanic 60,744 2.1% Black alone 36,345 1.2% Asian alone 25,472 0.9% Two or more races 7,955 0.3% American Indian alone 2,103 0.07% Other race alone 888 0.03% Native Hawaiian and Other
2,650,110 82.8% White alone 218,024 6.8% Hispanic 119,004 3.7% Black alone 115,286 3.6% Two or more races 74,892 2.3% Asian alone 9,260 0.3% Other race alone 8,595 0.3% Native Hawaiian and Other 5,346 0.2% American Indian alone
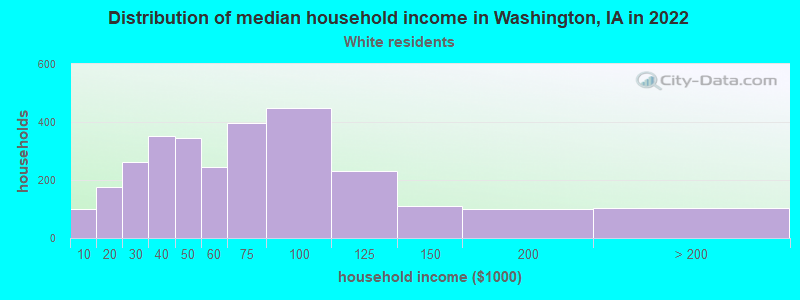
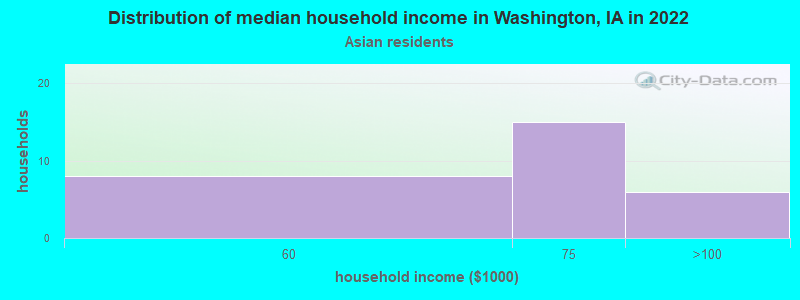
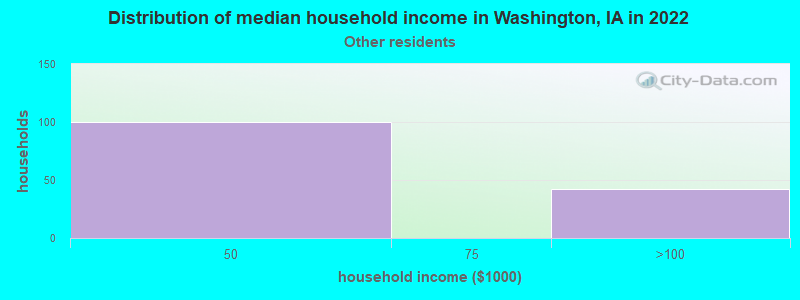
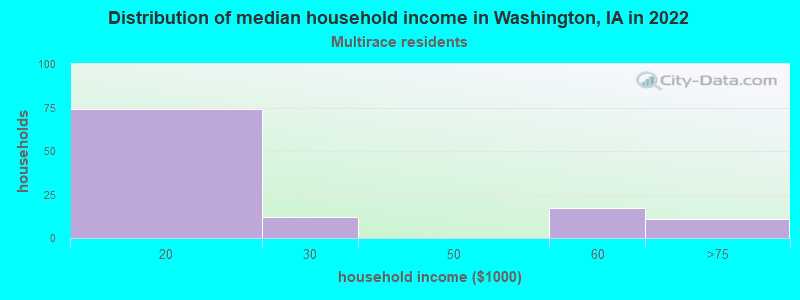
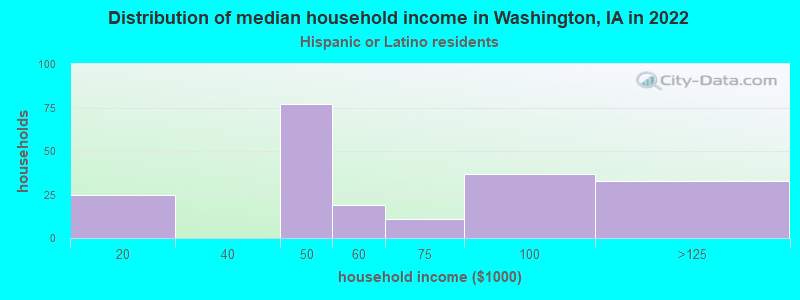
Income and house value in Washington Median household income in 2022 $56,175 White non-Hispanic householders$64,675 Asian householders$49,142 Some other race householders$19,597 Two or more races householders$54,958 Hispanic or Latino race householdersMedian 2022 house value $153,765 White Non-Hispanic householders$43,683 Black or African American householders$158,036 Some other race householders$197,642 Two or more races householders$156,677 Hispanic or Latino householders
Median age by race in Washington
44.2 Median age for White residents39.0 47.2 40.9 Median age for Black or African American residents40.1 -698,646,985.8 -660,397,073.5 Median age for American Indian / Alaska Native residents-654,282,765.1 -670,912,950.5 49.1 Median age for Asian residents36.2 51.3 -580,729,166.1 Median age for Native Hawaiian / Pacific Islander residents-776,978,416.5 -504,347,825.6 23.9 Median age for Other race residents27.1 23.5 17.7 Median age for Two or more races residents44.3 14.1 44.1 Median age for White alone residents38.6 46.9 26.8 Median age for Hispanic or Latino residents28.2 25.7
Owner/renter occupied households by race in Washington
House owners and renters - White residents 1,798 63.2% Owner occupied1,048 36.8% Renter occupiedHouse owners and renters - Asian residents 9 27.4% Owner occupied25 72.6% Renter occupiedHouse owners and renters - Other race residents 63 54.8% Owner occupied52 45.2% Renter occupiedHouse owners and renters - Two or more races residents 57 54.7% Owner occupied47 45.3% Renter occupiedHouse owners and renters - White alone residents 1,739 62.2% Owner occupied1,059 37.8% Renter occupiedHouse owners and renters - Hispanic or Latino residents 159 74.1% Owner occupied56 25.9% Renter occupied
Language usage in Washington
English speakers - Total 89.9% of residents of Washington speak English at home.
8.5% of residents speak Spanish at home 204 34.7% Speak English very well384 65.3% Speak English less than very well1.9% of residents speak other language at home 85 65.4% Speak English very well45 34.6% Speak English less than very well
English speakers - Born in the United States 96.6% of residents of Washington speak English at home.
2.1% of residents speak Spanish at home 24 80.0% Speak English very well6 20.0% Speak English less than very well1.4% of residents speak other language at home 20 100.0% Speak English very well
English speakers - Foreign-born 8.1% of residents of Washington speak English at home.
75.2% of residents speak Spanish at home 61 14.0% Speak English very well376 86.0% Speak English less than very well18.2% of residents speak other language at home 62 58.5% Speak English very well44 41.5% Speak English less than very well
White (Caucasian) - Speak only English Native:
98.9% (5,675)Foreign-born:
11.1% (14)
White (Caucasian) - Speak another language Native:
1.3% (75)Foreign-born:
84.8% (110)
Other race - Speak only English Native:
58.7% (114)Foreign-born:
2.2% (8)
Other race - Speak another language Native:
42.9% (84)Foreign-born:
100.0% (350)
Two or more races - Speak only English Native:
91.9% (361)Foreign-born:
33.0% (28)
Two or more races - Speak another language Native:
5.5% (21)Foreign-born:
70.1% (60)
White alone - Speak only English Native:
99.3% (5,682)Foreign-born:
38.7% (16)
White alone - Speak another language Native:
0.7% (39)Foreign-born:
61.2% (25)
Hispanic or Latino - Speak only English Native:
52.0% (152)Foreign-born:
4.9% (23)
Hispanic or Latino - Speak another language Native:
46.8% (137)Foreign-born:
95.6% (442)
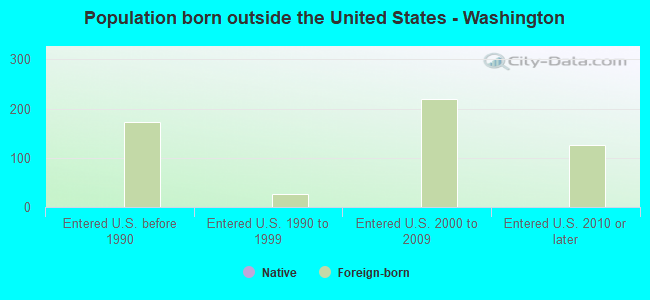
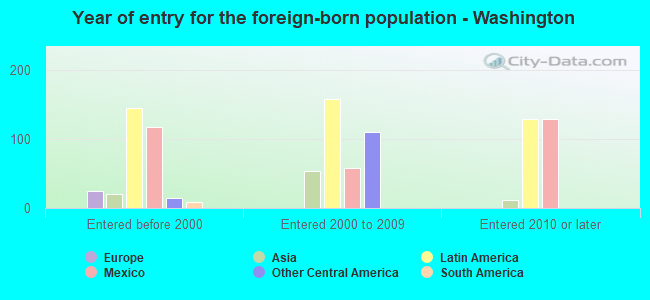
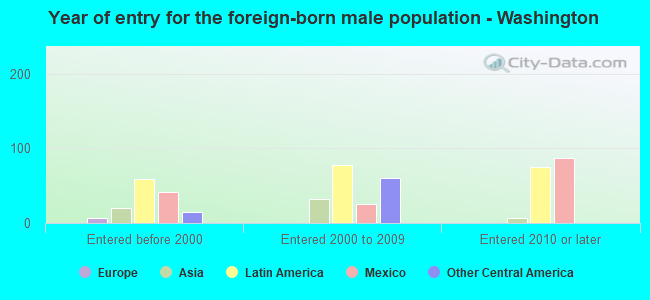
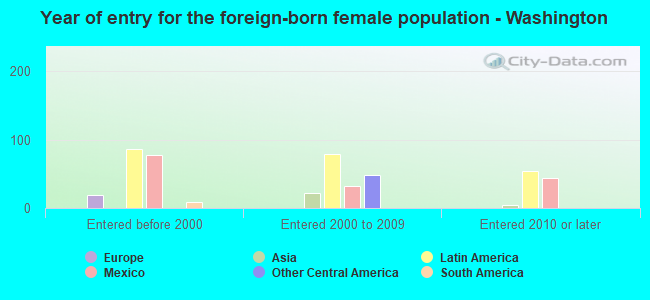
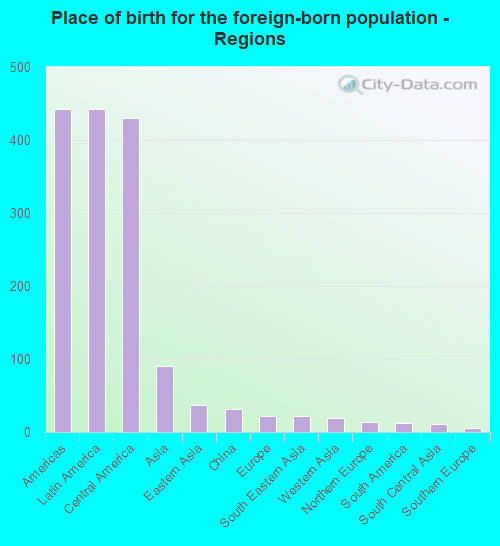
Foreign-born residents in Washington 555 residents are foreign born (5.9% Latin America , 1.2% Asia ).
Marital status for residents in Washington Marital status - White (Caucasian) population 15 years and over
Males 32.7% Never married50.9% Now married2.5% Separated2.5% Widowed11.4% DivorcedFemales 26.6% Never married39.4% Now married2.4% Separated12.9% Widowed18.7% DivorcedWomen who gave birth in the past 12 months Now married:
90.1% (71)Unmarried:
9.9% (8)
Women who did not give birth in the past 12 months Now married:
35.0% (497)Unmarried:
65.0% (924)
Marital status - Black or African American population 15 years and over
Males 6.7% Never married93.3% Now married0.0% Separated0.0% Widowed0.0% DivorcedFemales 100.0% Never married0.0% Now married0.0% Separated0.0% Widowed0.0% DivorcedWomen who did not give birth in the past 12 months Now married:
0.0% (0)Unmarried:
100.0% (11)
Marital status - Asian population 15 years and over
Males 47.6% Never married52.4% Now married0.0% Separated0.0% Widowed0.0% DivorcedFemales 0.0% Never married71.4% Now married0.0% Separated0.0% Widowed28.6% DivorcedWomen who did not give birth in the past 12 months Now married:
71.4% (19)Unmarried:
28.6% (8)
Marital status - Other race population 15 years and over
Males 20.2% Never married79.8% Now married0.0% Separated0.0% Widowed0.0% DivorcedFemales 33.7% Never married56.8% Now married0.0% Separated0.0% Widowed9.5% DivorcedWomen who gave birth in the past 12 months Now married:
0.0% (0)Unmarried:
100.0% (49)
Women who did not give birth in the past 12 months Now married:
65.9% (110)Unmarried:
34.1% (57)
Marital status - Two or more races population 15 years and over
Males 36.0% Never married58.4% Now married0.0% Separated0.0% Widowed5.6% DivorcedFemales 47.5% Never married25.3% Now married0.0% Separated12.1% Widowed15.2% DivorcedWomen who did not give birth in the past 12 months Now married:
31.4% (24)Unmarried:
68.6% (52)
Marital status - White alone, not Hispanic / Latino population 15 years and over
Males 32.1% Never married51.7% Now married2.7% Separated2.6% Widowed11.0% DivorcedFemales 24.9% Never married39.8% Now married2.5% Separated13.4% Widowed19.4% DivorcedWomen who gave birth in the past 12 months Now married:
90.1% (72)Unmarried:
9.9% (8)
Women who did not give birth in the past 12 months Now married:
34.3% (472)Unmarried:
65.7% (903)
Marital status - Hispanic or Latino population 15 years and over
Males 32.1% Never married59.7% Now married0.0% Separated0.0% Widowed8.1% DivorcedFemales 45.6% Never married45.0% Now married0.0% Separated0.0% Widowed9.5% DivorcedWomen who gave birth in the past 12 months Now married:
0.0% (0)Unmarried:
100.0% (42)
Women who did not give birth in the past 12 months Now married:
57.3% (147)Unmarried:
42.7% (110)
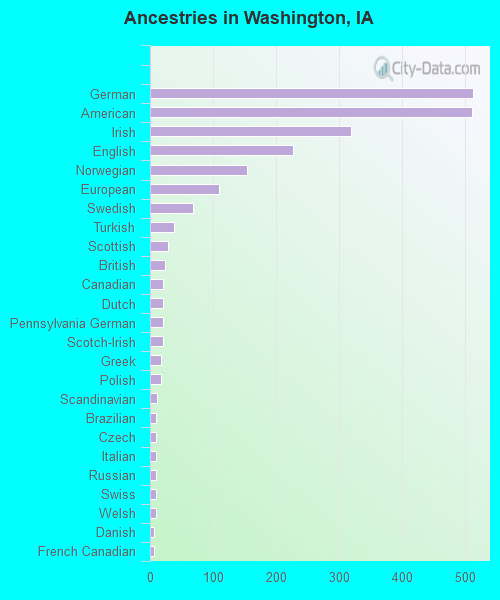
Ancestries in Washington
512 15.8% German511 15.7% American319 9.8% Irish227 7.0% English154 4.7% Norwegian110 3.4% European68 2.1% Swedish38 1.2% Turkish29 0.9% Scottish23 0.7% British20 0.6% Canadian20 0.6% Dutch20 0.6% Pennsylvania German20 0.6% Scotch-Irish17 0.5% Greek17 0.5% Polish11 0.3% Scandinavian10 0.3% Brazilian10 0.3% Czech10 0.3% Italian9 0.3% Russian9 0.3% Swiss9 0.3% Welsh6 0.2% Danish6 0.2% French Canadian4 0.1% Serbian
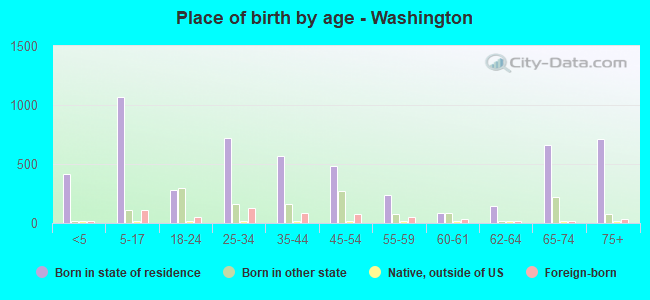
Children Nativity (place of birth) in Washington
Children under 6 years - Living with two parents Both parents native 283 100.0% NativeBoth parents foreign-born 11 100.0% NativeOne native, one foreign-born parent 26 100.0% NativeChildren under 6 years - Living with one parent Native parent 119 100.0% NativeForeign-born parent 31 100.0% NativeChildren 6 to 17 years - Living with two parents Both parents native 553 100.0% NativeBoth parents foreign-born 89 100.0% Foreign-bornChildren 6 to 17 years - Living with one parent Native parent 443 100.0% NativeForeign-born parent 47 62.6% Native28 37.4% Foreign-born
Grandparents responsible for own grandchildren in Washington
Grandparents (30 to 59 years) White / Caucasian 22 88.7% Responsible for grandchildren3 11.3% Not responsible for grandchildrenOther race 8 63.5% Responsible for grandchildren5 36.5% Not responsible for grandchildrenWhite alone, not Hispanic / Latino 22 87.3% Responsible for grandchildren3 12.7% Not responsible for grandchildrenHispanic or Latino 5 76.7% Responsible for grandchildren2 23.3% Not responsible for grandchildrenGrandparents (60 years and over) White / Caucasian 18 71.2% Responsible for grandchildren7 28.8% Not responsible for grandchildrenOther race 15 100.0% Not responsible for grandchildrenWhite alone, not Hispanic / Latino 18 70.4% Responsible for grandchildren8 29.6% Not responsible for grandchildrenHispanic or Latino 14 100.0% Not responsible for grandchildren