Races in Washington, Utah (UT) Detailed Stats
Data:
Races - White alone (%)
Races - White alone (% change since 2000)
Races - Black alone (%)
Races - Black alone (% change since 2000)
Races - American Indian alone (%)
Races - American Indian alone (% change since 2000)
Races - Asian alone (%)
Races - Asian alone (% change since 2000)
Races - Hispanic (%)
Races - Hispanic (% change since 2000)
Races - Native Hawaiian and Other Pacific Islander alone (%)
Races - Native Hawaiian and Other Pacific Islander alone (% change since 2000)
Races - Two or more races(%)
Races - Two or more races(% change since 2000)
Races - Other race alone (%)
Races - Other race alone (% change since 2000)
Racial diversity
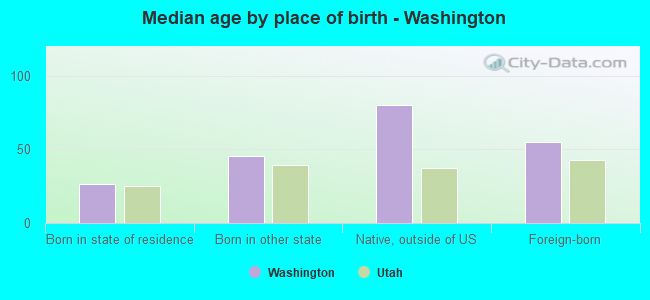
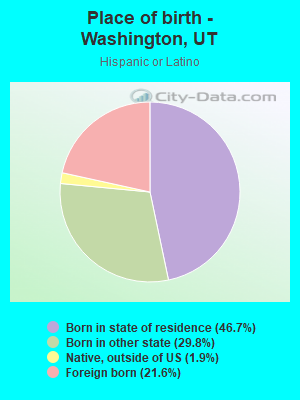
Place of birth - Born in state of residence (%)
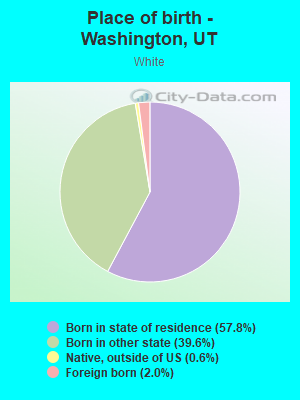
Place of birth - Born in state of residence (%) - White
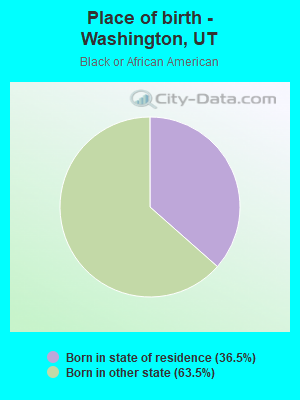
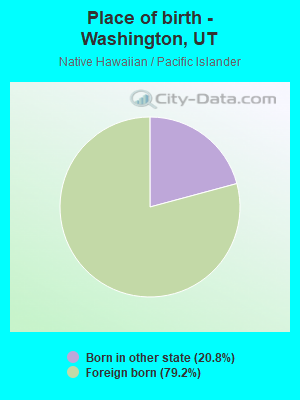
Place of birth - Born in state of residence (%) - Black or African American
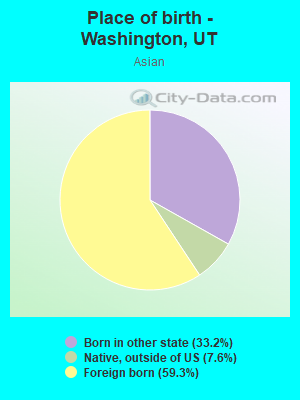
Place of birth - Born in state of residence (%) - Asian
Place of birth - Born in state of residence (%) - Hispanic or Latino
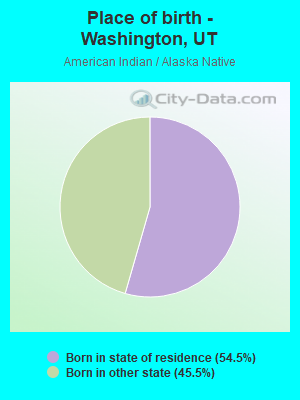
Place of birth - Born in state of residence (%) - American Indian and Alaska Native
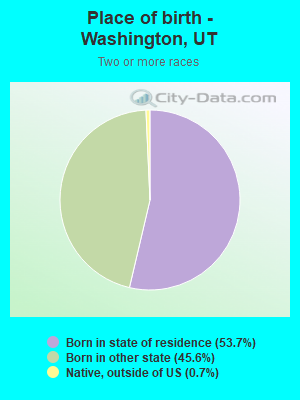
Place of birth - Born in state of residence (%) - Multirace
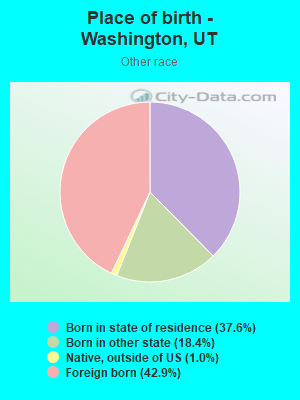
Place of birth - Born in state of residence (%) - Other Race
Place of birth - Born in other state (%)
Place of birth - Born in other state (%) - White
Place of birth - Born in other state (%) - Black or African American
Place of birth - Born in other state (%) - Asian
Place of birth - Born in other state (%) - Hispanic or Latino
Place of birth - Born in other state (%) - American Indian and Alaska Native
Place of birth - Born in other state (%) - Multirace
Place of birth - Born in other state (%) - Other Race
Place of birth - Native, outside of US (%)
Place of birth - Native, outside of US (%) - White
Place of birth - Native, outside of US (%) - Black or African American
Place of birth - Native, outside of US (%) - Asian
Place of birth - Native, outside of US (%) - Hispanic or Latino
Place of birth - Native, outside of US (%) - American Indian and Alaska Native
Place of birth - Native, outside of US (%) - Multirace
Place of birth - Native, outside of US (%) - Other Race
Place of birth - Foreign born (%)
Place of birth - Foreign born (%) - White
Place of birth - Foreign born (%) - Black or African American
Place of birth - Foreign born (%) - Asian
Place of birth - Foreign born (%) - Hispanic or Latino
Place of birth - Foreign born (%) - American Indian and Alaska Native
Place of birth - Foreign born (%) - Multirace
Place of birth - Foreign born (%) - Other Race
Residents speaking English at home (%)
Residents speaking English at home - Born in the United States (%)
Residents speaking English at home - Native, born elsewhere (%)
Residents speaking English at home - Foreign born (%)
Residents speaking Spanish at home (%)
Residents speaking Spanish at home - Born in the United States (%)
Residents speaking Spanish at home - Native, born elsewhere (%)
Residents speaking Spanish at home - Foreign born (%)
Residents speaking other language at home (%)
Residents speaking other language at home - Born in the United States (%)
Residents speaking other language at home - Native, born elsewhere (%)
Residents speaking other language at home - Foreign born (%)
Marital status - Never married (%)
Marital status - Now married (%)
Marital status - Separated (%)
Marital status - Widowed (%)
Marital status - Divorced (%)
Ancestries Reported - Arab (%)
Ancestries Reported - Czech (%)
Ancestries Reported - Danish (%)
Ancestries Reported - Dutch (%)
Ancestries Reported - English (%)
Ancestries Reported - French (%)
Ancestries Reported - French Canadian (%)
Ancestries Reported - German (%)
Ancestries Reported - Greek (%)
Ancestries Reported - Hungarian (%)
Ancestries Reported - Irish (%)
Ancestries Reported - Italian (%)
Ancestries Reported - Lithuanian (%)
Ancestries Reported - Norwegian (%)
Ancestries Reported - Polish (%)
Ancestries Reported - Portuguese (%)
Ancestries Reported - Russian (%)
Ancestries Reported - Scotch-Irish (%)
Ancestries Reported - Scottish (%)
Ancestries Reported - Slovak (%)
Ancestries Reported - Subsaharan African (%)
Ancestries Reported - Swedish (%)
Ancestries Reported - Swiss (%)
Ancestries Reported - Ukrainian (%)
Ancestries Reported - United States (%)
Ancestries Reported - Welsh (%)
Ancestries Reported - West Indian (%)
Ancestries Reported - Other (%)
Geographical mobility - Same house 1 year ago (%)
Geographical mobility - Same house 1 year ago (%) - White
Geographical mobility - Same house 1 year ago (%) - Black or African American
Geographical mobility - Same house 1 year ago (%) - Asian
Geographical mobility - Same house 1 year ago (%) - Hispanic or Latino
Geographical mobility - Same house 1 year ago (%) - American Indian and Alaska Native
Geographical mobility - Same house 1 year ago (%) - Multirace
Geographical mobility - Same house 1 year ago (%) - Other Race
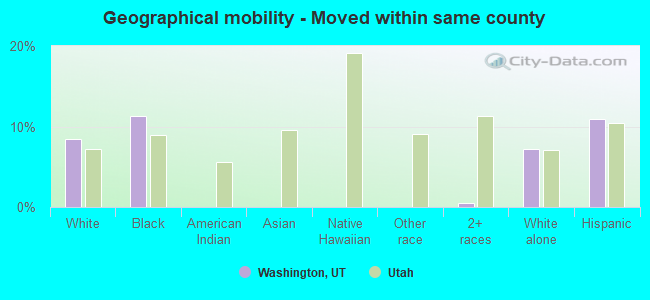
Geographical mobility - Moved within same county (%)
Geographical mobility - Moved within same county (%) - White
Geographical mobility - Moved within same county (%) - Black or African American
Geographical mobility - Moved within same county (%) - Asian
Geographical mobility - Moved within same county (%) - Hispanic or Latino
Geographical mobility - Moved within same county (%) - American Indian and Alaska Native
Geographical mobility - Moved within same county (%) - Multirace
Geographical mobility - Moved within same county (%) - Other Race
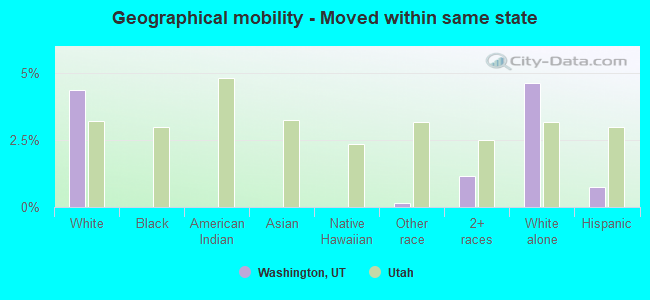
Geographical mobility - Moved from different county within same state (%)
Geographical mobility - Moved from different county within same state (%) - White
Geographical mobility - Moved from different county within same state (%) - Black or African American
Geographical mobility - Moved from different county within same state (%) - Asian
Geographical mobility - Moved from different county within same state (%) - Hispanic or Latino
Geographical mobility - Moved from different county within same state (%) - American Indian and Alaska Native
Geographical mobility - Moved from different county within same state (%) - Multirace
Geographical mobility - Moved from different county within same state (%) - Other Race
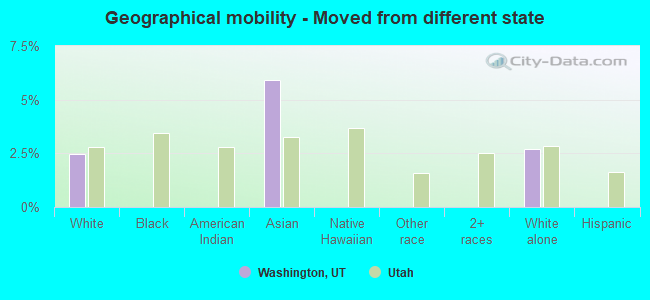
Geographical mobility - Moved from different state (%)
Geographical mobility - Moved from different state (%) - White
Geographical mobility - Moved from different state (%) - Black or African American
Geographical mobility - Moved from different state (%) - Asian
Geographical mobility - Moved from different state (%) - Hispanic or Latino
Geographical mobility - Moved from different state (%) - American Indian and Alaska Native
Geographical mobility - Moved from different state (%) - Multirace
Geographical mobility - Moved from different state (%) - Other Race
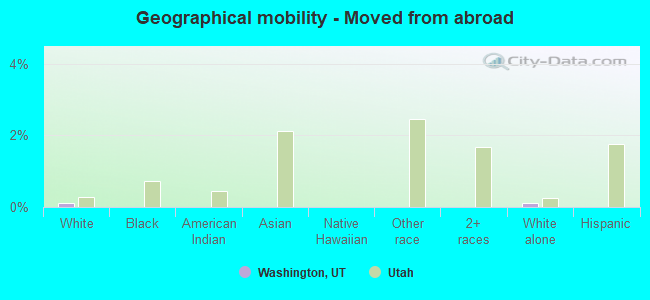
Geographical mobility - Moved from abroad (%)
Geographical mobility - Moved from abroad (%) - White
Geographical mobility - Moved from abroad (%) - Black or African American
Geographical mobility - Moved from abroad (%) - Asian
Geographical mobility - Moved from abroad (%) - Hispanic or Latino
Geographical mobility - Moved from abroad (%) - American Indian and Alaska Native
Geographical mobility - Moved from abroad (%) - Multirace
Geographical mobility - Moved from abroad (%) - Other Race
Place of birth for the foreign-born population - Ireland (%)
Place of birth for the foreign-born population - Denmark (%)
Place of birth for the foreign-born population - Norway (%)
Place of birth for the foreign-born population - Sweden (%)
Place of birth for the foreign-born population - United Kingdom (%)
Place of birth for the foreign-born population - England (%)
Place of birth for the foreign-born population - Scotland (%)
Place of birth for the foreign-born population - Other Northern Europe (%)
Place of birth for the foreign-born population - Austria (%)
Place of birth for the foreign-born population - Belgium (%)
Place of birth for the foreign-born population - France (%)
Place of birth for the foreign-born population - Germany (%)
Place of birth for the foreign-born population - Netherlands (%)
Place of birth for the foreign-born population - Switzerland (%)
Place of birth for the foreign-born population - Other Western Europe (%)
Place of birth for the foreign-born population - Greece (%)
Place of birth for the foreign-born population - Italy (%)
Place of birth for the foreign-born population - Portugal (%)
Place of birth for the foreign-born population - Spain (%)
Place of birth for the foreign-born population - Other Southern Europe (%)
Place of birth for the foreign-born population - Albania (%)
Place of birth for the foreign-born population - Belarus (%)
Place of birth for the foreign-born population - Bosnia and Herzegovina (%)
Place of birth for the foreign-born population - Bulgaria (%)
Place of birth for the foreign-born population - Croatia (%)
Place of birth for the foreign-born population - Czechoslovakia (%)
Place of birth for the foreign-born population - Hungary (%)
Place of birth for the foreign-born population - Latvia (%)
Place of birth for the foreign-born population - Lithuania (%)
Place of birth for the foreign-born population - North Macedonia (Macedonia) (%)
Place of birth for the foreign-born population - Moldova (%)
Place of birth for the foreign-born population - Poland (%)
Place of birth for the foreign-born population - Romania (%)
Place of birth for the foreign-born population - Russia (%)
Place of birth for the foreign-born population - Serbia (%)
Place of birth for the foreign-born population - Ukraine (%)
Place of birth for the foreign-born population - Other Eastern Europe (%)
Place of birth for the foreign-born population - China (%)
Place of birth for the foreign-born population - Hong Kong (%)
Place of birth for the foreign-born population - Taiwan (%)
Place of birth for the foreign-born population - Japan (%)
Place of birth for the foreign-born population - Korea (%)
Place of birth for the foreign-born population - Other Eastern Asia (%)
Place of birth for the foreign-born population - Afghanistan (%)
Place of birth for the foreign-born population - Bangladesh (%)
Place of birth for the foreign-born population - India (%)
Place of birth for the foreign-born population - Iran (%)
Place of birth for the foreign-born population - Kazakhstan (%)
Place of birth for the foreign-born population - Nepal (%)
Place of birth for the foreign-born population - Pakistan (%)
Place of birth for the foreign-born population - Sri Lanka (%)
Place of birth for the foreign-born population - Uzbekistan (%)
Place of birth for the foreign-born population - Other South Central Asia (%)
Place of birth for the foreign-born population - Burma (%)
Place of birth for the foreign-born population - Cambodia (%)
Place of birth for the foreign-born population - Indonesia (%)
Place of birth for the foreign-born population - Laos (%)
Place of birth for the foreign-born population - Malaysia (%)
Place of birth for the foreign-born population - Philippines (%)
Place of birth for the foreign-born population - Singapore (%)
Place of birth for the foreign-born population - Thailand (%)
Place of birth for the foreign-born population - Vietnam (%)
Place of birth for the foreign-born population - Other South Eastern Asia (%)
Place of birth for the foreign-born population - Armenia (%)
Place of birth for the foreign-born population - Iraq (%)
Place of birth for the foreign-born population - Israel (%)
Place of birth for the foreign-born population - Jordan (%)
Place of birth for the foreign-born population - Kuwait (%)
Place of birth for the foreign-born population - Lebanon (%)
Place of birth for the foreign-born population - Saudi Arabia (%)
Place of birth for the foreign-born population - Syria (%)
Place of birth for the foreign-born population - Turkey (%)
Place of birth for the foreign-born population - Yemen (%)
Place of birth for the foreign-born population - Other Western Asia (%)
Place of birth for the foreign-born population - Eritrea (%)
Place of birth for the foreign-born population - Ethiopia (%)
Place of birth for the foreign-born population - Kenya (%)
Place of birth for the foreign-born population - Somalia (%)
Place of birth for the foreign-born population - Uganda (%)
Place of birth for the foreign-born population - Zimbabwe (%)
Place of birth for the foreign-born population - Other Eastern Africa (%)
Place of birth for the foreign-born population - Cameroon (%)
Place of birth for the foreign-born population - Congo (%)
Place of birth for the foreign-born population - Democratic Republic of Congo (Zaire) (%)
Place of birth for the foreign-born population - Other Middle Africa (%)
Place of birth for the foreign-born population - Egypt (%)
Place of birth for the foreign-born population - Morocco (%)
Place of birth for the foreign-born population - Sudan (%)
Place of birth for the foreign-born population - Other Northern Africa (%)
Place of birth for the foreign-born population - South Africa (%)
Place of birth for the foreign-born population - Other Southern Africa (%)
Place of birth for the foreign-born population - Cabo Verde (%)
Place of birth for the foreign-born population - Ghana (%)
Place of birth for the foreign-born population - Liberia (%)
Place of birth for the foreign-born population - Nigeria (%)
Place of birth for the foreign-born population - Senegal (%)
Place of birth for the foreign-born population - Sierra Leone (%)
Place of birth for the foreign-born population - Other Western Africa (%)
Place of birth for the foreign-born population - Australia (%)
Place of birth for the foreign-born population - New Zealand (%)
Place of birth for the foreign-born population - Fiji (%)
Place of birth for the foreign-born population - Micronesia (%)
Place of birth for the foreign-born population - Bahamas (%)
Place of birth for the foreign-born population - Barbados (%)
Place of birth for the foreign-born population - Cuba (%)
Place of birth for the foreign-born population - Dominica (%)
Place of birth for the foreign-born population - Dominican Republic (%)
Place of birth for the foreign-born population - Grenada (%)
Place of birth for the foreign-born population - Haiti (%)
Place of birth for the foreign-born population - Jamaica (%)
Place of birth for the foreign-born population - St. Vincent and the Grenadines (%)
Place of birth for the foreign-born population - Trinidad and Tobago (%)
Place of birth for the foreign-born population - West Indies (%)
Place of birth for the foreign-born population - Other Caribbean (%)
Place of birth for the foreign-born population - Belize (%)
Place of birth for the foreign-born population - Costa Rica (%)
Place of birth for the foreign-born population - El Salvador (%)
Place of birth for the foreign-born population - Guatemala (%)
Place of birth for the foreign-born population - Honduras (%)
Place of birth for the foreign-born population - Mexico (%)
Place of birth for the foreign-born population - Nicaragua (%)
Place of birth for the foreign-born population - Panama (%)
Place of birth for the foreign-born population - Other Central America (%)
Place of birth for the foreign-born population - Argentina (%)
Place of birth for the foreign-born population - Bolivia (%)
Place of birth for the foreign-born population - Brazil (%)
Place of birth for the foreign-born population - Chile (%)
Place of birth for the foreign-born population - Colombia (%)
Place of birth for the foreign-born population - Ecuador (%)
Place of birth for the foreign-born population - Guyana (%)
Place of birth for the foreign-born population - Peru (%)
Place of birth for the foreign-born population - Uruguay (%)
Place of birth for the foreign-born population - Venezuela (%)
Place of birth for the foreign-born population - Other South America (%)
Place of birth for the foreign-born population - Canada (%)
Place of birth for the foreign-born population - Other Northern America (%)
Place of birth for the foreign-born population - Other (%)
Latest news about races in Washington, UT collected exclusively by city-data.com from local newspapers, TV, and radio stations
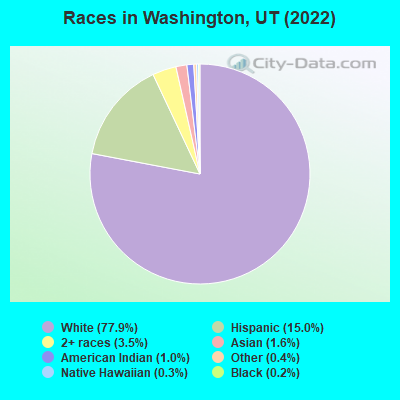
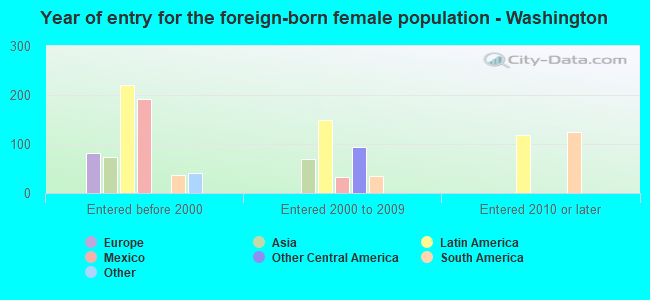
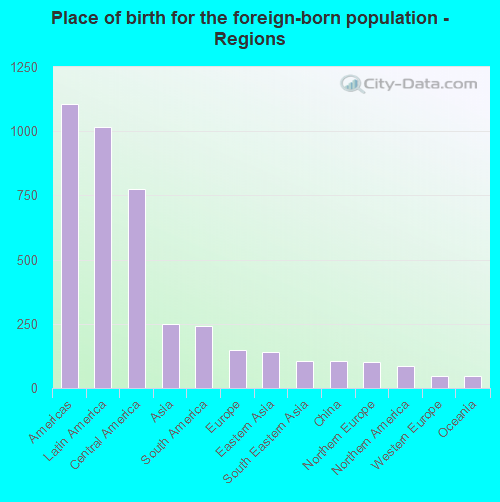
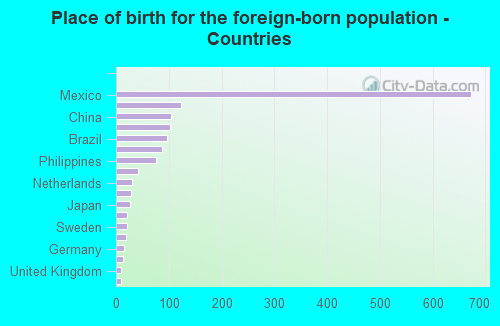
According to 2022 data, the most numerous races in Washington, UT are White alone (24,509 residents), Hispanic (4,720 residents), and Two or more races (1,110 residents). 89.5% of Washington residents speak English at home. 4.9% of Washington, UT residents are foreign-born (3.3% born in Latin America, 0.8% born in Asia), which is 62.3% less than the foreign-born rate of 8.0% across the entire state of Utah.
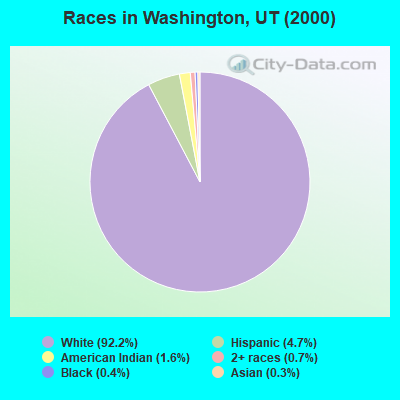
Race distribution in Washington
2000 2022
1,904,265 85.3% White alone 201,559 9.0% Hispanic 36,483 1.6% Asian alone 31,308 1.4% Two or more races 26,663 1.2% American Indian alone 14,806 0.7% Native Hawaiian and Other 16,137 0.7% Black alone 1,948 0.09% Other race alone
2,557,466 75.6% White alone 512,086 15.1% Hispanic 119,308 3.5% Two or more races 82,388 2.4% Asian alone 36,978 1.1% Native Hawaiian and Other 34,873 1.0% Black alone 22,803 0.7% American Indian alone 14,898 0.4% Other race alone
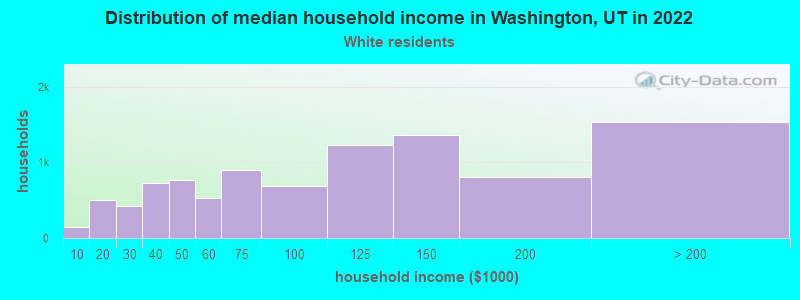
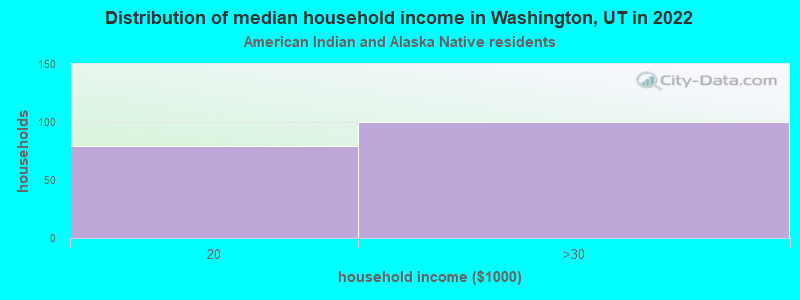
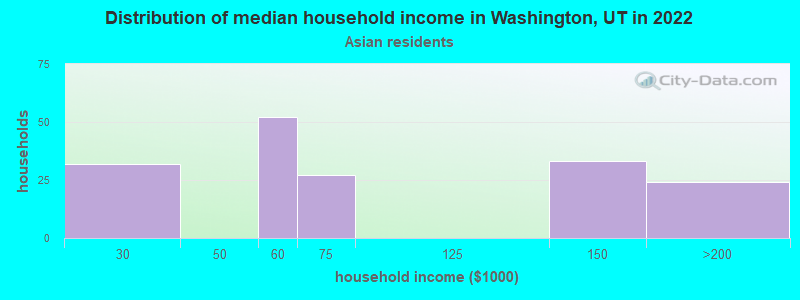
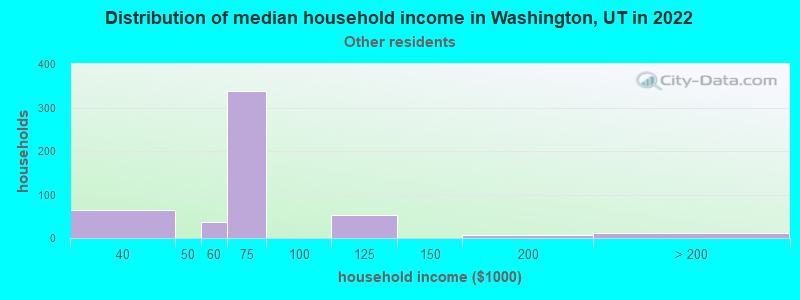
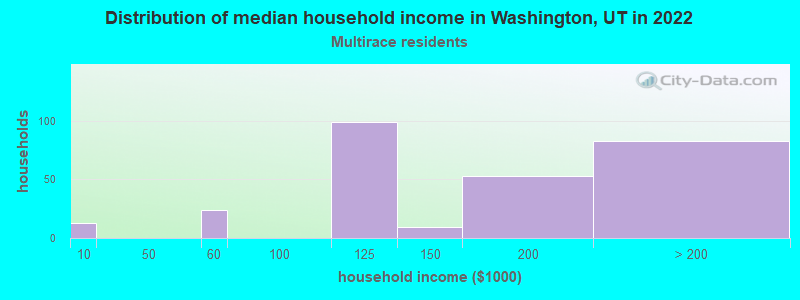
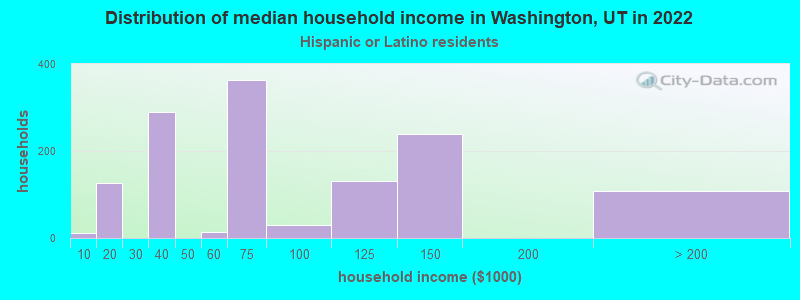
Income and house value in Washington Median household income in 2022 $100,210 White non-Hispanic householders$69,004 Some other race householders$131,870 Two or more races householders$61,151 Hispanic or Latino race householdersMedian 2022 house value $626,391 White Non-Hispanic householders$826,206 American Indian or Alaska Native householders$500,808 Some other race householders$826,206 Two or more races householders$500,808 Hispanic or Latino householders
Median age by race in Washington
38.6 Median age for White residents38.7 38.7 28.7 Median age for Black or African American residents-620,437,955.6 30.5 56.1 Median age for American Indian / Alaska Native residents58.9 57.6 39.5 Median age for Asian residents31.3 43.0 -1,032,597,265.0 Median age for Native Hawaiian / Pacific Islander residents-1,433,333,331.9 -668,354,429.7 47.2 Median age for Other race residents48.9 53.0 19.3 Median age for Two or more races residents26.8 12.6 39.6 Median age for White alone residents38.3 39.8 28.5 Median age for Hispanic or Latino residents30.8 32.6
Owner/renter occupied households by race in Washington
House owners and renters - White residents 7,790 81.2% Owner occupied1,806 18.8% Renter occupiedHouse owners and renters - Black or African American residents 16 53.6% Owner occupied14 46.4% Renter occupiedHouse owners and renters - American Indian / Alaska Native residents 143 100.0% Renter occupiedHouse owners and renters - Asian residents 152 100.0% Owner occupiedHouse owners and renters - Other race residents 147 27.3% Owner occupied391 72.7% Renter occupiedHouse owners and renters - Two or more races residents 323 93.8% Owner occupied21 6.2% Renter occupiedHouse owners and renters - White alone residents 7,272 81.1% Owner occupied1,691 18.9% Renter occupiedHouse owners and renters - Hispanic or Latino residents 901 60.0% Owner occupied601 40.0% Renter occupied
Language usage in Washington
English speakers - Total 89.5% of residents of Washington speak English at home.
7.8% of residents speak Spanish at home 1,651 71.8% Speak English very well649 28.2% Speak English less than very well2.7% of residents speak other language at home 541 67.8% Speak English very well257 32.2% Speak English less than very well
English speakers - Born in the United States 93.3% of residents of Washington speak English at home.
6.0% of residents speak Spanish at home 604 84.6% Speak English very well110 15.4% Speak English less than very well0.8% of residents speak other language at home 70 72.9% Speak English very well26 27.1% Speak English less than very well
English speakers - Native, born elsewhere 55.4% of residents of Washington speak English at home.
19.6% of residents speak Spanish at home 33 100.0% Speak English very well
English speakers - Foreign-born 26.7% of residents of Washington speak English at home.
46.1% of residents speak Spanish at home 364 44.0% Speak English very well464 56.0% Speak English less than very well25.6% of residents speak other language at home 269 58.5% Speak English very well191 41.5% Speak English less than very well
White (Caucasian) - Speak only English Native:
96.1% (23,077)Foreign-born:
41.6% (219)
White (Caucasian) - Speak another language Native:
3.6% (871)Foreign-born:
45.8% (241)
Asian - Speak only English Native:
34.7% (61)Foreign-born:
28.7% (96)
Asian - Speak another language Native:
85.6% (149)Foreign-born:
67.6% (227)
Other race - Speak only English Native:
56.9% (669)Foreign-born:
15.7% (138)
Other race - Speak another language Native:
28.3% (333)Foreign-born:
78.0% (685)
White alone - Speak only English Native:
97.8% (22,493)Foreign-born:
62.8% (222)
White alone - Speak another language Native:
2.2% (517)Foreign-born:
32.9% (116)
Hispanic or Latino - Speak only English Native:
60.7% (2,097)Foreign-born:
9.0% (92)
Hispanic or Latino - Speak another language Native:
35.7% (1,235)Foreign-born:
83.1% (852)
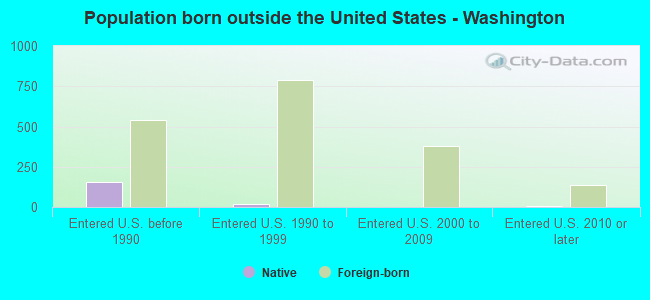
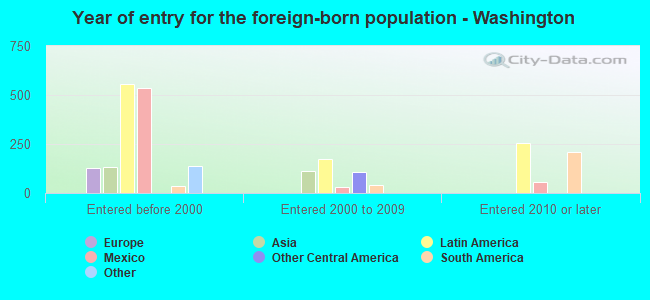
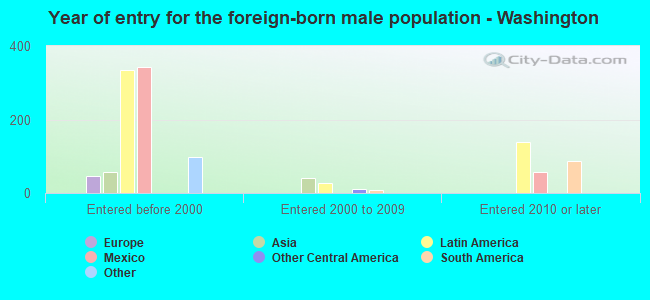
Foreign-born residents in Washington 1,550 residents are foreign born (3.3% Latin America , 0.8% Asia ).
Marital status for residents in Washington Marital status - White (Caucasian) population 15 years and over
Males 19.8% Never married71.3% Now married1.1% Separated2.6% Widowed5.1% DivorcedFemales 23.2% Never married61.9% Now married0.3% Separated6.0% Widowed8.7% DivorcedWomen who gave birth in the past 12 months Now married:
100.0% (368)Unmarried:
0.0% (0)
Women who did not give birth in the past 12 months Now married:
53.3% (3,135)Unmarried:
46.7% (2,744)
Marital status - Black or African American population 15 years and over
Males 37.5% Never married0.0% Now married0.0% Separated62.5% Widowed0.0% DivorcedFemales 100.0% Never married0.0% Now married0.0% Separated0.0% Widowed0.0% DivorcedWomen who did not give birth in the past 12 months Now married:
0.0% (0)Unmarried:
100.0% (15)
Marital status - American Indian / Alaska Native population 15 years and over
Males 0.0% Never married100.0% Now married0.0% Separated0.0% Widowed0.0% DivorcedFemales 35.8% Never married64.2% Now married0.0% Separated0.0% Widowed0.0% DivorcedWomen who gave birth in the past 12 months Now married:
100.0% (98)Unmarried:
0.0% (0)
Women who did not give birth in the past 12 months Now married:
40.0% (58)Unmarried:
60.0% (87)
Marital status - Asian population 15 years and over
Males 0.0% Never married100.0% Now married0.0% Separated0.0% Widowed0.0% DivorcedFemales 29.9% Never married70.1% Now married0.0% Separated0.0% Widowed0.0% DivorcedWomen who did not give birth in the past 12 months Now married:
39.6% (49)Unmarried:
60.4% (74)
Marital status - Native Hawaiian / Pacific Islander population 15 years and over
Males 0.0% Never married100.0% Now married0.0% Separated0.0% Widowed0.0% DivorcedFemales 100.0% Never married0.0% Now married0.0% Separated0.0% Widowed0.0% DivorcedMarital status - Other race population 15 years and over
Males 66.9% Never married32.8% Now married0.0% Separated0.0% Widowed0.3% DivorcedFemales 0.0% Never married94.3% Now married0.0% Separated0.0% Widowed5.7% DivorcedWomen who gave birth in the past 12 months Now married:
100.0% (132)Unmarried:
0.0% (0)
Women who did not give birth in the past 12 months Now married:
91.6% (350)Unmarried:
8.4% (32)
Marital status - Two or more races population 15 years and over
Males 50.6% Never married49.0% Now married0.0% Separated0.0% Widowed0.5% DivorcedFemales 55.8% Never married42.1% Now married0.0% Separated1.9% Widowed0.3% DivorcedWomen who did not give birth in the past 12 months Now married:
40.5% (162)Unmarried:
59.5% (238)
Marital status - White alone, not Hispanic / Latino population 15 years and over
Males 20.7% Never married69.9% Now married1.2% Separated2.8% Widowed5.3% DivorcedFemales 21.5% Never married63.0% Now married0.3% Separated5.9% Widowed9.4% DivorcedWomen who gave birth in the past 12 months Now married:
100.0% (387)Unmarried:
0.0% (0)
Women who did not give birth in the past 12 months Now married:
54.5% (3,004)Unmarried:
45.5% (2,505)
Marital status - Hispanic or Latino population 15 years and over
Males 46.4% Never married52.2% Now married0.0% Separated0.0% Widowed1.4% DivorcedFemales 41.3% Never married52.3% Now married0.0% Separated4.5% Widowed2.0% DivorcedWomen who gave birth in the past 12 months Now married:
100.0% (75)Unmarried:
0.0% (0)
Women who did not give birth in the past 12 months Now married:
47.4% (541)Unmarried:
52.6% (601)
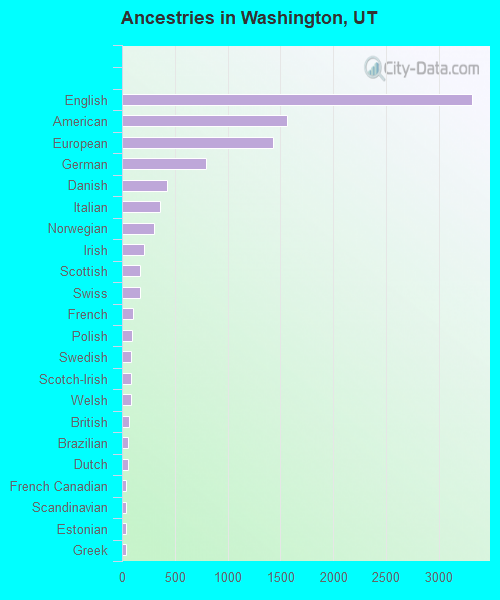
Ancestries in Washington
3,312 23.6% English1,564 11.2% American1,429 10.2% European795 5.7% German430 3.1% Danish359 2.6% Italian307 2.2% Norwegian209 1.5% Irish175 1.2% Scottish175 1.2% Swiss103 0.7% French93 0.7% Polish90 0.6% Swedish88 0.6% Scotch-Irish88 0.6% Welsh67 0.5% British56 0.4% Brazilian56 0.4% Dutch37 0.3% French Canadian37 0.3% Scandinavian35 0.2% Estonian34 0.2% Greek26 0.2% Canadian21 0.1% Austrian11 0.08% Slovene
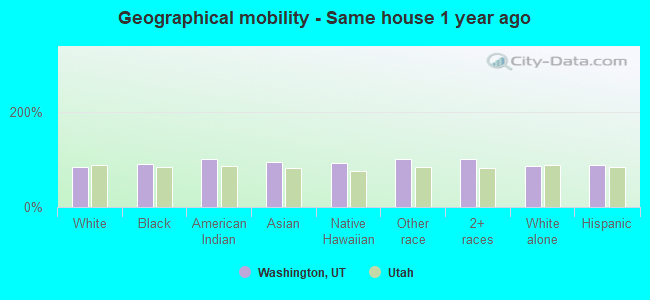
Geographical mobility in Washington Same house 1 year ago 21,326 84.1% White (Caucasian)66 89.7% Black or African American562 100.0% American Indian / Alaska Native408 94.9% Asian69 92.6% Native Hawaiian / Pacific Islander1,821 100.0% Other race2,705 100.0% Two or more races20,519 84.7% White alone, not Hispanic / Latino3,722 88.3% Hispanic or LatinoMoved within same county 2,144 8.5% White / Caucasian8 11.3% Black or African American13 0.5% Two or more races1,757 7.2% White alone, not Hispanic / Latino461 10.9% Hispanic or LatinoMoved within same state 1,105 4.4% White / Caucasian3 0.1% Other race29 1.2% Two or more races1,120 4.6% White alone, not Hispanic / Latino32 0.8% Hispanic or LatinoMoved from different state 624 2.5% White / Caucasian25 5.9% Asian658 2.7% White alone, not Hispanic / LatinoMoved from abroad 30 0.1% White30 0.1% White alone, not Hispanic / Latino
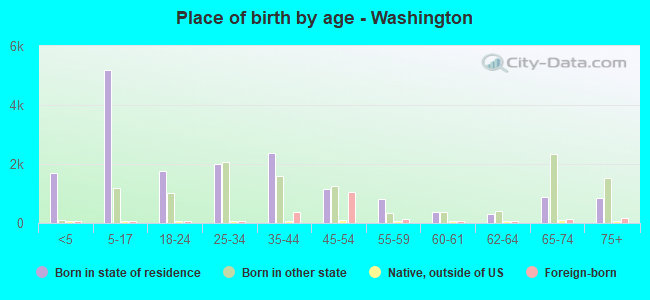
Children Nativity (place of birth) in Washington
Children under 6 years - Living with two parents Both parents native 1,913 100.0% NativeBoth parents foreign-born 38 100.0% NativeOne native, one foreign-born parent 82 100.0% NativeChildren under 6 years - Living with one parent Native parent 156 100.0% Native
Children 6 to 17 years - Living with two parents Both parents native 4,505 100.0% NativeBoth parents foreign-born 469 100.0% NativeOne native, one foreign-born parent 25 100.0% NativeChildren 6 to 17 years - Living with one parent Native parent 695 100.0% Native
Grandparents responsible for own grandchildren in Washington
Grandparents (30 to 59 years) White / Caucasian 67 26.6% Responsible for grandchildren186 73.4% Not responsible for grandchildrenWhite alone, not Hispanic / Latino 74 28.2% Responsible for grandchildren190 71.8% Not responsible for grandchildrenGrandparents (60 years and over) White / Caucasian 83 38.7% Responsible for grandchildren132 61.3% Not responsible for grandchildrenWhite alone, not Hispanic / Latino 83 42.0% Responsible for grandchildren115 58.0% Not responsible for grandchildren