Races in Watermill, New York (NY) Detailed Stats
Latest news about races in Watermill, NY collected exclusively by city-data.com from local newspapers, TV, and radio stations
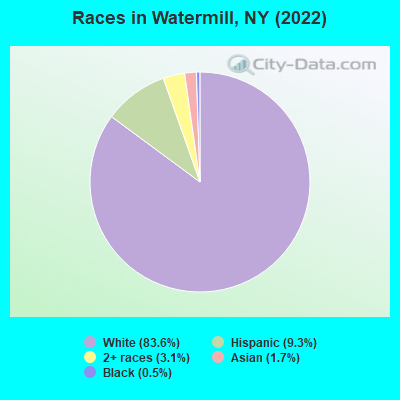
According to 2022 data, the most numerous races in Watermill, NY are White alone (1,931 residents), Hispanic (215 residents), and Black alone (11 residents). 84.8% of Watermill residents speak English at home. 13.8% of Watermill, NY residents are foreign-born (10.1% born in Europe, 1.9% born in Asia), which is 59.7% less than the foreign-born rate of 22.0% across the entire state of New York.
Race distribution in Watermill
2000 2022
11,760,981 62.0% White alone 2,867,583 15.1% Hispanic 2,812,623 14.8% Black alone 1,035,926 5.5% Asian alone 366,116 1.9% Two or more races 75,499 0.4% Other race alone 52,499 0.3% American Indian alone 5,230 0.03% Native Hawaiian and Other
10,408,933 52.9% White alone 3,867,299 19.7% Hispanic 2,633,840 13.4% Black alone 1,776,286 9.0% Asian alone 732,670 3.7% Two or more races 216,110 1.1% Other race alone 35,082 0.2% American Indian alone 6,931 0.04% Native Hawaiian and Other
Income and house value in Watermill Median household income in 2022 $171,071 White non-Hispanic householdersMedian 2022 house value over $1,000,000 White Non-Hispanic householdersover $1,000,000 Hispanic or Latino householders
Median age by race in Watermill
60.7 Median age for White residents60.3 60.8 -664,799,252.4 Median age for Black or African American residents-660,784,313.1 -661,403,508.1 -748,832,865.7 Median age for American Indian / Alaska Native residents-807,017,543.1 -513,692,161.9 45.0 Median age for Asian residents45.3 -693,840,579.0 -742,816,091.2 Median age for Native Hawaiian / Pacific Islander residents-831,187,409.8 -771,300,447.7 -656,565,655.9 Median age for Other race residents-643,206,255.5 -677,215,189.2 11.3 Median age for Two or more races residents0.0 11.9 59.1 Median age for White alone residents59.1 59.2 16.6 Median age for Hispanic or Latino residents17.1 7.9
Owner/renter occupied households by race in Watermill
House owners and renters - White residents 936 94.9% Owner occupied51 5.1% Renter occupiedHouse owners and renters - Black or African American residents 9 100.0% Owner occupiedHouse owners and renters - Asian residents 26 100.0% Owner occupiedHouse owners and renters - Two or more races residents 13 18.9% Owner occupied57 81.1% Renter occupiedHouse owners and renters - White alone residents 966 94.6% Owner occupied55 5.4% Renter occupiedHouse owners and renters - Hispanic or Latino residents 40 100.0% Renter occupied
Language usage in Watermill
English speakers - Total 84.8% of residents of Watermill speak English at home.
6.2% of residents speak Spanish at home 73 52.9% Speak English very well65 47.1% Speak English less than very well8.6% of residents speak other language at home 188 98.9% Speak English very well2 1.1% Speak English less than very well
English speakers - Born in the United States 95.5% of residents of Watermill speak English at home.
5.1% of residents speak other language at home 16 100.0% Speak English very well
English speakers - Native, born elsewhere 0.0% of residents of Watermill speak English at home.
English speakers - Foreign-born 40.9% of residents of Watermill speak English at home.
30.7% of residents speak Spanish at home 65 61.3% Speak English very well41 38.7% Speak English less than very well24.6% of residents speak other language at home 83 97.6% Speak English very well2 2.4% Speak English less than very well
White (Caucasian) - Speak only English Native:
96.3% (1,629)Foreign-born:
77.9% (98)
White (Caucasian) - Speak another language Native:
4.1% (69)Foreign-born:
36.8% (46)
Asian - Speak only English Native:
91.6% (25)Foreign-born:
25.6% (4)
Two or more races - Speak only English Native:
82.9% (51)Foreign-born:
18.1% (33)
Two or more races - Speak another language Native:
17.7% (11)Foreign-born:
81.1% (148)
White alone - Speak only English Native:
94.3% (1,632)Foreign-born:
60.7% (107)
White alone - Speak another language Native:
5.8% (101)Foreign-born:
39.4% (69)
Hispanic or Latino - Speak another language Native:
2.1% (1)Foreign-born:
100.0% (113)
Foreign-born residents in Watermill 318 residents are foreign born (10.1% Europe , 1.9% Asia ).
This city:
13.8%New York:
22.6%
Marital status for residents in Watermill Marital status - White (Caucasian) population 15 years and over
Males 15.8% Never married68.7% Now married0.0% Separated1.0% Widowed14.6% DivorcedFemales 13.7% Never married51.1% Now married0.0% Separated19.2% Widowed16.0% DivorcedWomen who gave birth in the past 12 months Now married:
100.0% (21)Unmarried:
0.0% (0)
Women who did not give birth in the past 12 months Now married:
46.7% (160)Unmarried:
53.3% (183)
Marital status - Asian population 15 years and over
Males 6.5% Never married93.5% Now married0.0% Separated0.0% Widowed0.0% DivorcedFemales 0.0% Never married100.0% Now married0.0% Separated0.0% Widowed0.0% DivorcedMarital status - Two or more races population 15 years and over
Males 19.3% Never married64.9% Now married0.0% Separated0.0% Widowed15.8% DivorcedFemales 0.0% Never married100.0% Now married0.0% Separated0.0% Widowed0.0% DivorcedWomen who gave birth in the past 12 months Now married:
100.0% (45)Unmarried:
0.0% (0)
Marital status - White alone, not Hispanic / Latino population 15 years and over
Males 15.9% Never married68.1% Now married0.0% Separated1.0% Widowed15.0% DivorcedFemales 13.6% Never married51.1% Now married0.0% Separated19.2% Widowed16.1% DivorcedWomen who gave birth in the past 12 months Now married:
100.0% (23)Unmarried:
0.0% (0)
Women who did not give birth in the past 12 months Now married:
46.7% (174)Unmarried:
53.3% (198)
Marital status - Hispanic or Latino population 15 years and over
Males 18.7% Never married81.3% Now married0.0% Separated0.0% Widowed0.0% DivorcedFemales 3.1% Never married96.9% Now married0.0% Separated0.0% Widowed0.0% DivorcedWomen who gave birth in the past 12 months Now married:
100.0% (32)Unmarried:
0.0% (0)
Ancestries in Watermill
170 16.8% Eastern European164 16.2% Polish81 8.0% Italian73 7.2% Irish48 4.8% Russian41 4.1% German21 2.1% French Canadian17 1.7% Swedish11 1.1% American10 1.0% English10 1.0% Haitian9 0.9% French8 0.8% Greek8 0.8% Lithuanian7 0.7% Scottish
Children Nativity (place of birth) in Watermill
Children under 6 years - Living with two parents Both parents native 23 100.0% NativeBoth parents foreign-born 56 100.0% NativeOne native, one foreign-born parent 19 100.0% NativeChildren 6 to 17 years - Living with two parents Both parents native 52 99.9% Native0 0.1% Foreign-bornBoth parents foreign-born 22 100.0% Foreign-bornOne native, one foreign-born parent 23 100.0% NativeChildren 6 to 17 years - Living with one parent Native parent 4 100.0% Foreign-bornForeign-born parent 27 51.5% Native25 48.5% Foreign-born