Races in Watertown, Massachusetts (MA) Detailed Stats
Latest news about races in Watertown, MA collected exclusively by city-data.com from local newspapers, TV, and radio stations
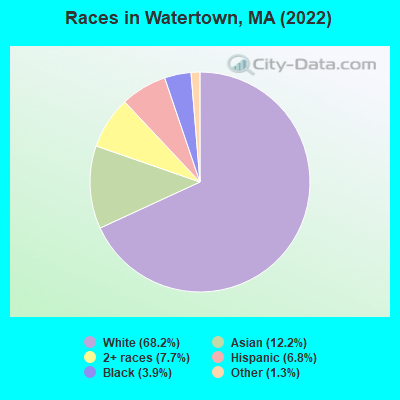
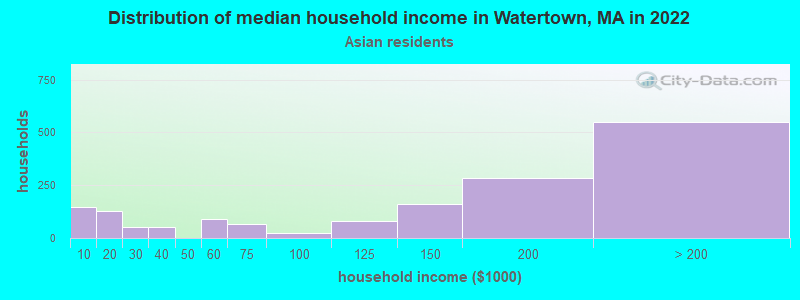
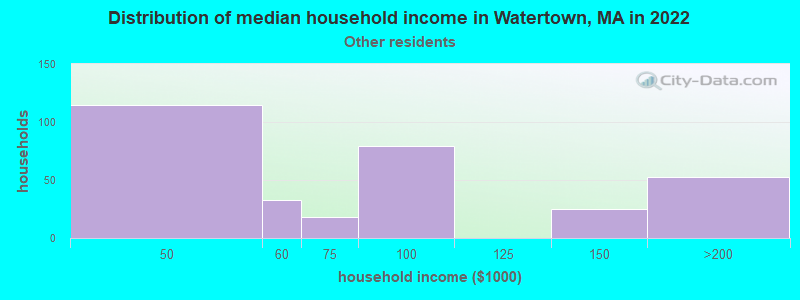
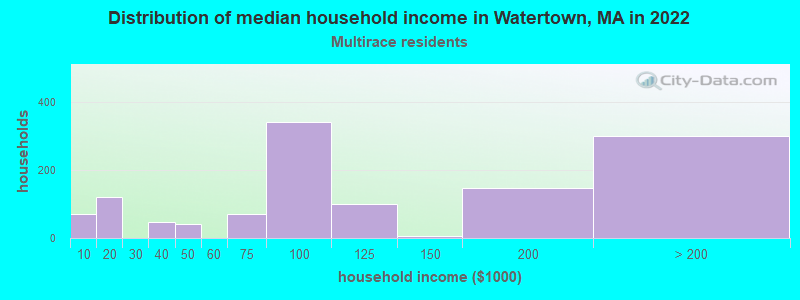
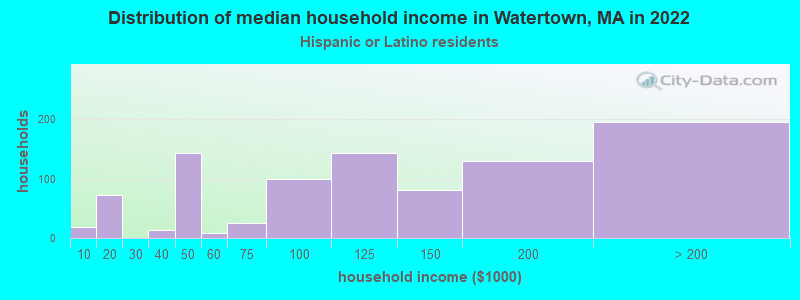
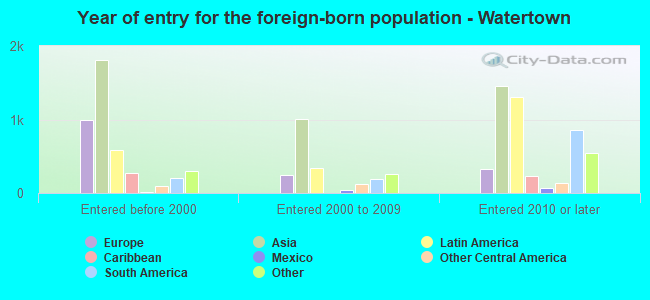
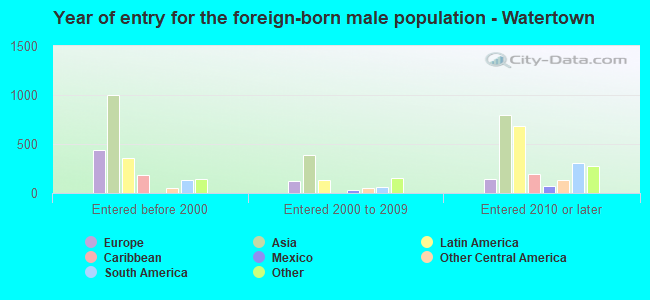
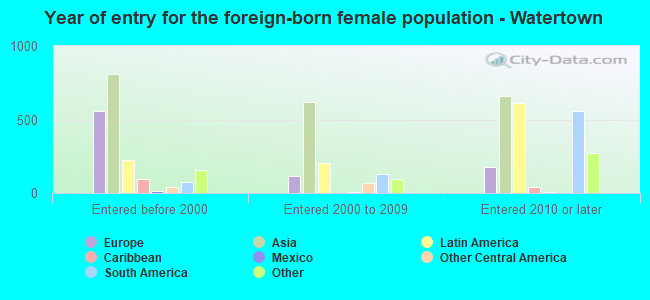
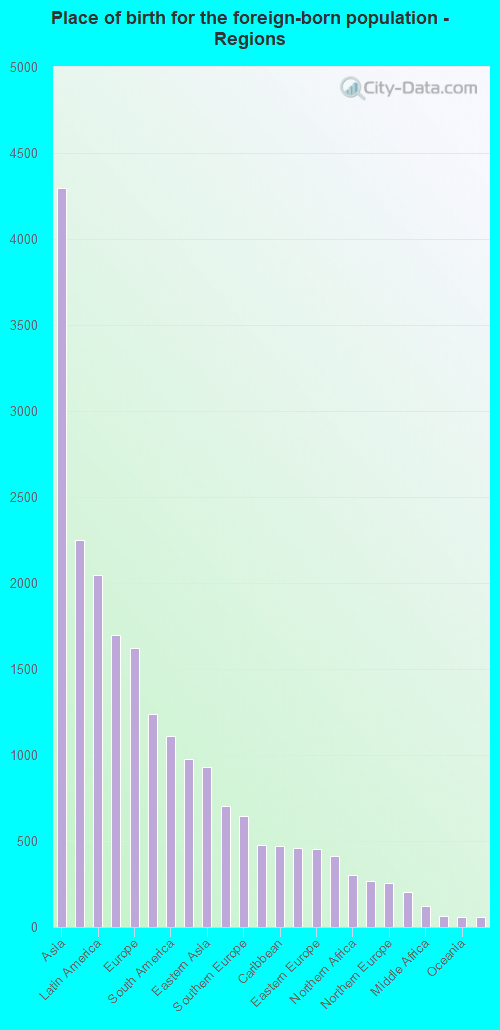
According to 2022 data, the most numerous races in Watertown, MA are White alone (23,903 residents), Hispanic (2,398 residents), and Asian alone (4,271 residents). 67.4% of Watertown residents speak English at home. 26.3% of Watertown, MA residents are foreign-born (11.8% born in Asia, 5.6% born in Latin America, 4.5% born in Europe, 2.7% born in Africa), which is 31.5% greater than the foreign-born rate of 18.0% across the entire state of Massachusetts.
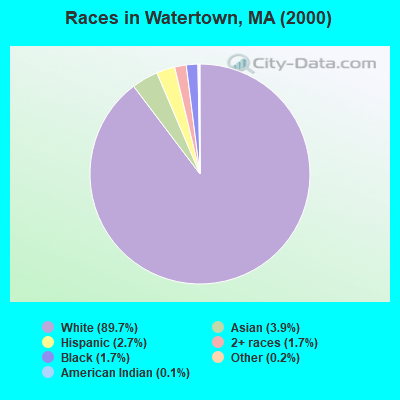
Race distribution in Watertown
2000 2022
5,198,359 81.9% White alone 428,729 6.8% Hispanic 318,329 5.0% Black alone 236,786 3.7% Asian alone 110,338 1.7% Two or more races 43,586 0.7% Other race alone 11,264 0.2% American Indian alone 1,706 0.03% Native Hawaiian and Other
4,676,627 67.0% White alone 911,038 13.0% Hispanic 501,463 7.2% Asian alone 459,740 6.6% Black alone 341,889 4.9% Two or more races 84,403 1.2% Other race alone 5,838 0.08% American Indian alone 976 0.01% Native Hawaiian and Other
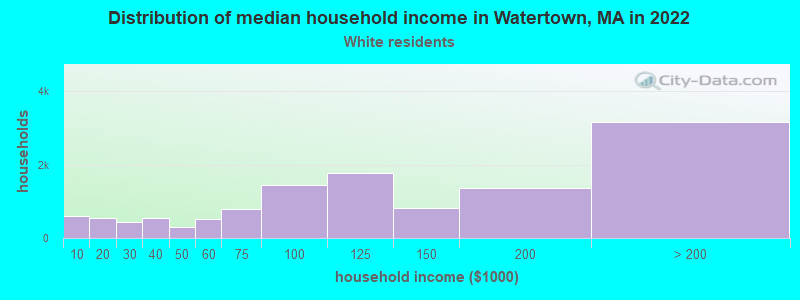
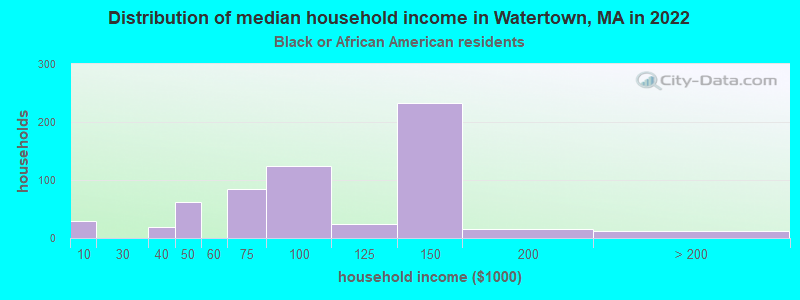
Income and house value in Watertown Median household income in 2022 $111,819 White non-Hispanic householders$121,323 Black householders$154,001 Asian householders$78,315 Some other race householders$86,810 Two or more races householders$127,874 Hispanic or Latino race householdersMedian 2022 house value $747,909 White Non-Hispanic householders$448,966 Black or African American householders $769,736 Asian householders$759,790 Some other race householders$668,891 Two or more races householders$967,005 Hispanic or Latino householders
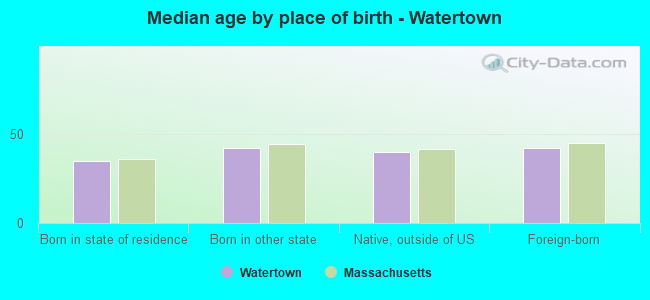
Median age by race in Watertown
42.2 Median age for White residents42.3 42.7 36.6 Median age for Black or African American residents26.8 55.7 -761,044,175.9 Median age for American Indian / Alaska Native residents-751,004,015.3 -1,078,313,251.9 36.6 Median age for Asian residents37.3 36.0 -514,227,641.8 Median age for Native Hawaiian / Pacific Islander residents-513,131,312.6 -508,717,948.2 32.6 Median age for Other race residents32.2 33.6 30.3 Median age for Two or more races residents31.4 28.0 42.4 Median age for White alone residents42.4 42.9 33.2 Median age for Hispanic or Latino residents30.5 35.7
Owner/renter occupied households by race in Watertown
House owners and renters - White residents 6,855 56.0% Owner occupied5,394 44.0% Renter occupiedHouse owners and renters - Black or African American residents 118 19.6% Owner occupied483 80.4% Renter occupiedHouse owners and renters - Asian residents 827 49.6% Owner occupied839 50.4% Renter occupiedHouse owners and renters - Other race residents 90 25.4% Owner occupied264 74.6% Renter occupiedHouse owners and renters - Two or more races residents 333 28.2% Owner occupied846 71.8% Renter occupiedHouse owners and renters - White alone residents 6,689 55.9% Owner occupied5,270 44.1% Renter occupiedHouse owners and renters - Hispanic or Latino residents 319 35.7% Owner occupied573 64.3% Renter occupied
Language usage in Watertown
English speakers - Total 67.4% of residents of Watertown speak English at home.
5.0% of residents speak Spanish at home 1,122 68.0% Speak English very well528 32.0% Speak English less than very well28.0% of residents speak other language at home 6,279 67.4% Speak English very well3,036 32.6% Speak English less than very well
English speakers - Born in the United States 90.6% of residents of Watertown speak English at home.
2.0% of residents speak Spanish at home 152 84.9% Speak English very well27 15.1% Speak English less than very well7.3% of residents speak other language at home 606 94.5% Speak English very well35 5.5% Speak English less than very well
English speakers - Native, born elsewhere 40.8% of residents of Watertown speak English at home.
15.2% of residents speak Spanish at home 100 96.2% Speak English very well4 3.8% Speak English less than very well49.4% of residents speak other language at home 196 58.2% Speak English very well141 41.8% Speak English less than very well
English speakers - Foreign-born 18.7% of residents of Watertown speak English at home.
8.8% of residents speak Spanish at home 326 40.7% Speak English very well475 59.3% Speak English less than very well71.9% of residents speak other language at home 3,935 60.1% Speak English very well2,614 39.9% Speak English less than very well
White (Caucasian) - Speak only English Native:
89.9% (18,250)Foreign-born:
21.6% (700)
White (Caucasian) - Speak another language Native:
9.4% (1,918)Foreign-born:
78.6% (2,553)
Black or African American - Speak only English Native:
79.3% (389)Foreign-born:
57.2% (462)
Black or African American - Speak another language Native:
20.5% (100)Foreign-born:
44.1% (356)
Asian - Speak only English Native:
55.2% (681)Foreign-born:
12.3% (345)
Asian - Speak another language Native:
44.8% (553)Foreign-born:
87.4% (2,447)
Other race - Speak only English Native:
38.6% (227)Foreign-born:
8.5% (50)
Other race - Speak another language Native:
60.1% (352)Foreign-born:
91.7% (536)
Two or more races - Speak only English Native:
79.2% (1,187)Foreign-born:
9.6% (161)
Two or more races - Speak another language Native:
19.3% (288)Foreign-born:
90.3% (1,507)
White alone - Speak only English Native:
90.5% (17,967)Foreign-born:
21.1% (651)
White alone - Speak another language Native:
9.3% (1,853)Foreign-born:
79.5% (2,457)
Hispanic or Latino - Speak only English Native:
51.9% (689)Foreign-born:
13.7% (130)
Hispanic or Latino - Speak another language Native:
48.6% (644)Foreign-born:
86.3% (819)
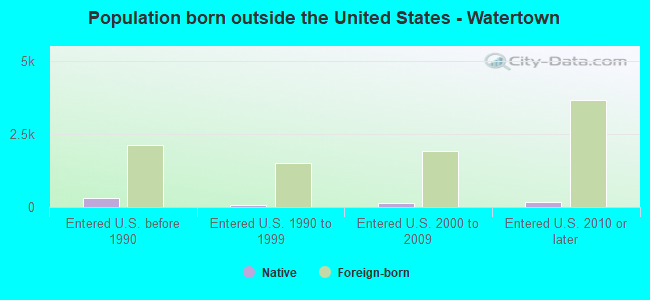
Foreign-born residents in Watertown 9,211 residents are foreign born (11.8% Asia , 5.6% Latin America , 4.5% Europe , 2.7% Africa ).
This city:
26.3%Massachusetts:
17.6%
Marital status for residents in Watertown Marital status - White (Caucasian) population 15 years and over
Males 39.1% Never married49.0% Now married1.4% Separated2.0% Widowed8.5% DivorcedFemales 36.2% Never married45.6% Now married1.1% Separated7.2% Widowed9.8% DivorcedWomen who gave birth in the past 12 months Now married:
93.6% (321)Unmarried:
6.4% (22)
Women who did not give birth in the past 12 months Now married:
43.6% (2,324)Unmarried:
56.4% (3,006)
Marital status - Black or African American population 15 years and over
Males 68.4% Never married27.3% Now married2.1% Separated1.1% Widowed1.1% DivorcedFemales 36.5% Never married52.4% Now married0.0% Separated3.9% Widowed7.2% DivorcedWomen who gave birth in the past 12 months Now married:
42.1% (8)Unmarried:
57.9% (11)
Women who did not give birth in the past 12 months Now married:
14.8% (30)Unmarried:
85.2% (174)
Marital status - Asian population 15 years and over
Males 32.6% Never married60.2% Now married0.0% Separated4.3% Widowed3.0% DivorcedFemales 39.6% Never married53.2% Now married0.0% Separated2.5% Widowed4.7% DivorcedWomen who gave birth in the past 12 months Now married:
100.0% (51)Unmarried:
0.0% (0)
Women who did not give birth in the past 12 months Now married:
50.3% (771)Unmarried:
49.7% (763)
Marital status - Other race population 15 years and over
Males 36.7% Never married63.3% Now married0.0% Separated0.0% Widowed0.0% DivorcedFemales 42.5% Never married57.5% Now married0.0% Separated0.0% Widowed0.0% DivorcedWomen who did not give birth in the past 12 months Now married:
53.7% (249)Unmarried:
46.3% (215)
Marital status - Two or more races population 15 years and over
Males 55.5% Never married40.3% Now married0.0% Separated0.0% Widowed4.1% DivorcedFemales 41.1% Never married40.0% Now married4.0% Separated3.1% Widowed11.8% DivorcedWomen who did not give birth in the past 12 months Now married:
47.9% (414)Unmarried:
52.1% (451)
Marital status - White alone, not Hispanic / Latino population 15 years and over
Males 39.1% Never married48.9% Now married1.3% Separated2.0% Widowed8.7% DivorcedFemales 36.6% Never married45.0% Now married1.2% Separated7.0% Widowed10.2% DivorcedWomen who gave birth in the past 12 months Now married:
93.6% (327)Unmarried:
6.4% (22)
Women who did not give birth in the past 12 months Now married:
42.5% (2,183)Unmarried:
57.5% (2,952)
Marital status - Hispanic or Latino population 15 years and over
Males 40.7% Never married56.6% Now married2.0% Separated0.0% Widowed0.7% DivorcedFemales 30.6% Never married60.7% Now married0.0% Separated7.5% Widowed1.2% DivorcedWomen who did not give birth in the past 12 months Now married:
60.9% (434)Unmarried:
39.1% (279)
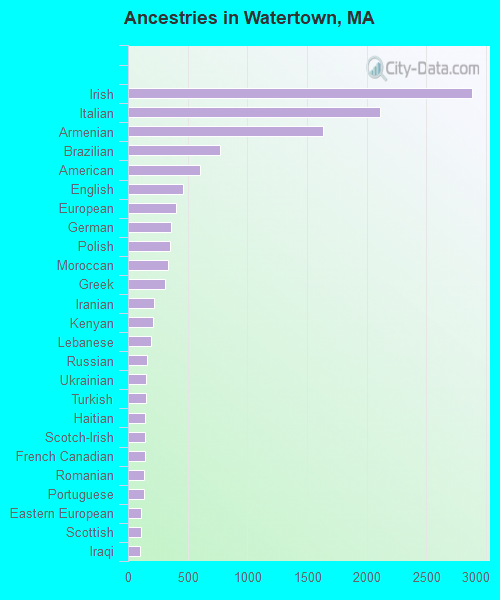
Ancestries in Watertown
2,881 15.3% Irish2,114 11.2% Italian1,634 8.7% Armenian769 4.1% Brazilian605 3.2% American457 2.4% English405 2.2% European357 1.9% German356 1.9% Polish336 1.8% Moroccan314 1.7% Greek216 1.1% Iranian211 1.1% Kenyan192 1.0% Lebanese157 0.8% Russian150 0.8% Ukrainian148 0.8% Turkish143 0.8% Haitian142 0.8% Scotch-Irish141 0.8% French Canadian134 0.7% Romanian130 0.7% Portuguese112 0.6% Eastern European106 0.6% Scottish100 0.5% Iraqi68 0.4% Canadian67 0.4% African56 0.3% Albanian55 0.3% Yugoslavian49 0.3% Ethiopian48 0.3% British47 0.3% French45 0.2% Swedish43 0.2% Swiss41 0.2% Northern European35 0.2% West Indian32 0.2% Latvian31 0.2% Arab27 0.1% Israeli26 0.1% Australian24 0.1% Ugandan23 0.1% Serbian21 0.1% German Russian21 0.1% Dutch21 0.1% Welsh13 0.07% Austrian12 0.06% Cape Verdean11 0.06% Finnish9 0.05% Jamaican7 0.04% New Zealander6 0.03% Scandinavian1 0.01% Croatian
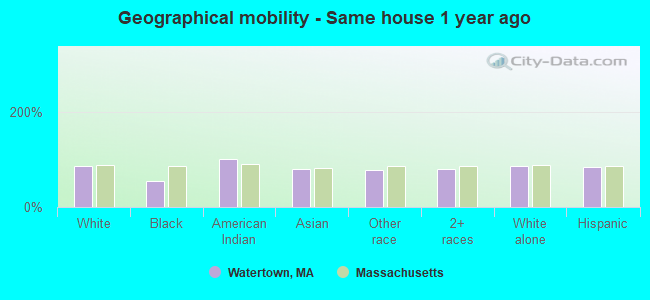
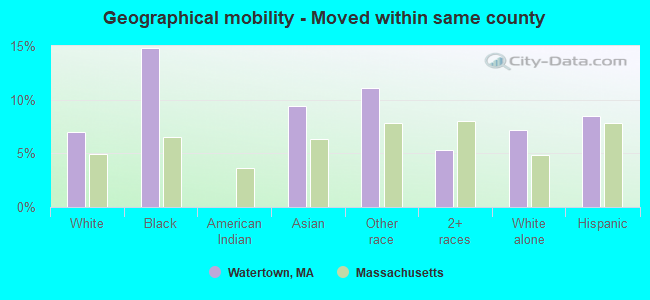
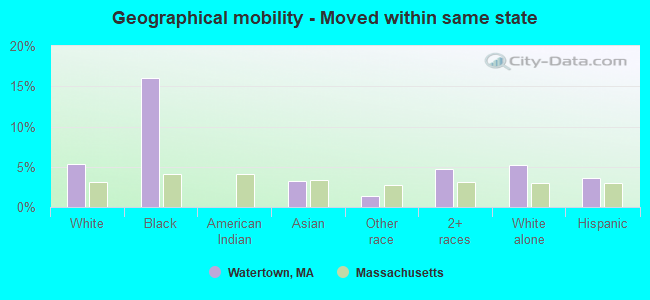
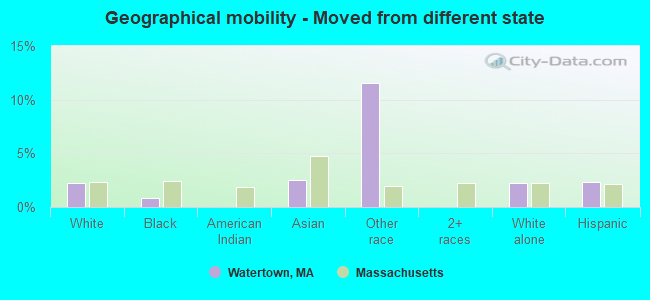
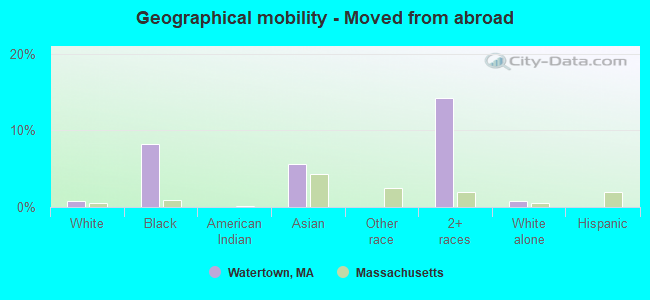
Geographical mobility in Watertown Same house 1 year ago 20,666 84.8% White (Caucasian)728 54.3% Black or African American71 100.0% American Indian / Alaska Native3,340 78.8% Asian930 77.8% Other race2,804 79.4% Two or more races20,062 84.6% White alone, not Hispanic / Latino1,975 83.0% Hispanic or LatinoMoved within same county 1,694 7.0% White / Caucasian198 14.8% Black or African American400 9.4% Asian133 11.1% Other race187 5.3% Two or more races1,695 7.1% White alone, not Hispanic / Latino203 8.5% Hispanic or LatinoMoved within same state 1,312 5.4% White / Caucasian214 16.0% Black or African American139 3.3% Asian17 1.4% Other race168 4.8% Two or more races1,251 5.3% White alone, not Hispanic / Latino86 3.6% Hispanic or LatinoMoved from different state 546 2.2% White / Caucasian11 0.9% Black or African American105 2.5% Asian138 11.6% Other race539 2.3% White alone, not Hispanic / Latino55 2.3% Hispanic or LatinoMoved from abroad 186 0.8% White110 8.2% Black or African American240 5.7% Asian503 14.3% Two or more races186 0.8% White alone, not Hispanic / Latino
Children Nativity (place of birth) in Watertown
Children under 6 years - Living with two parents Both parents native 956 100.0% NativeBoth parents foreign-born 319 70.6% Native133 29.4% Foreign-bornOne native, one foreign-born parent 332 100.0% NativeChildren under 6 years - Living with one parent Native parent 169 100.0% NativeForeign-born parent 27 100.0% NativeChildren 6 to 17 years - Living with two parents Both parents native 1,012 99.1% Native10 0.9% Foreign-bornBoth parents foreign-born 513 71.7% Native203 28.3% Foreign-bornOne native, one foreign-born parent 475 98.3% Native8 1.7% Foreign-bornChildren 6 to 17 years - Living with one parent Native parent 655 100.0% NativeForeign-born parent 140 53.1% Native124 46.9% Foreign-born
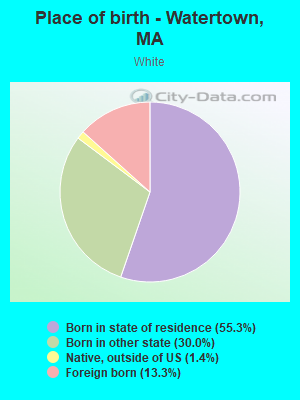
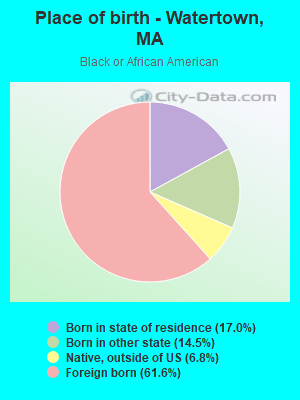
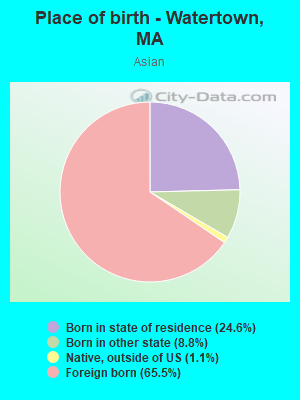
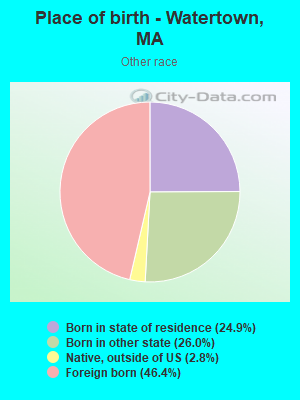
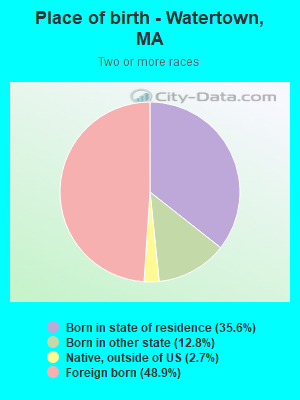
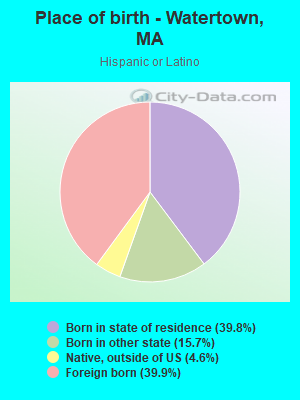
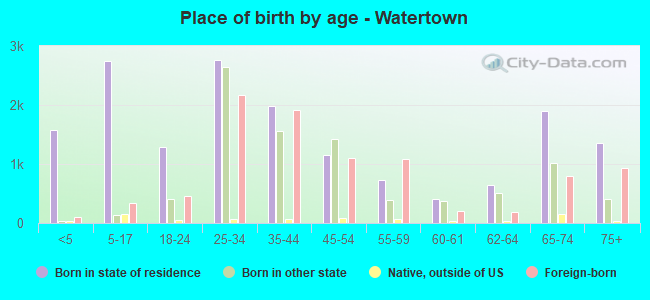
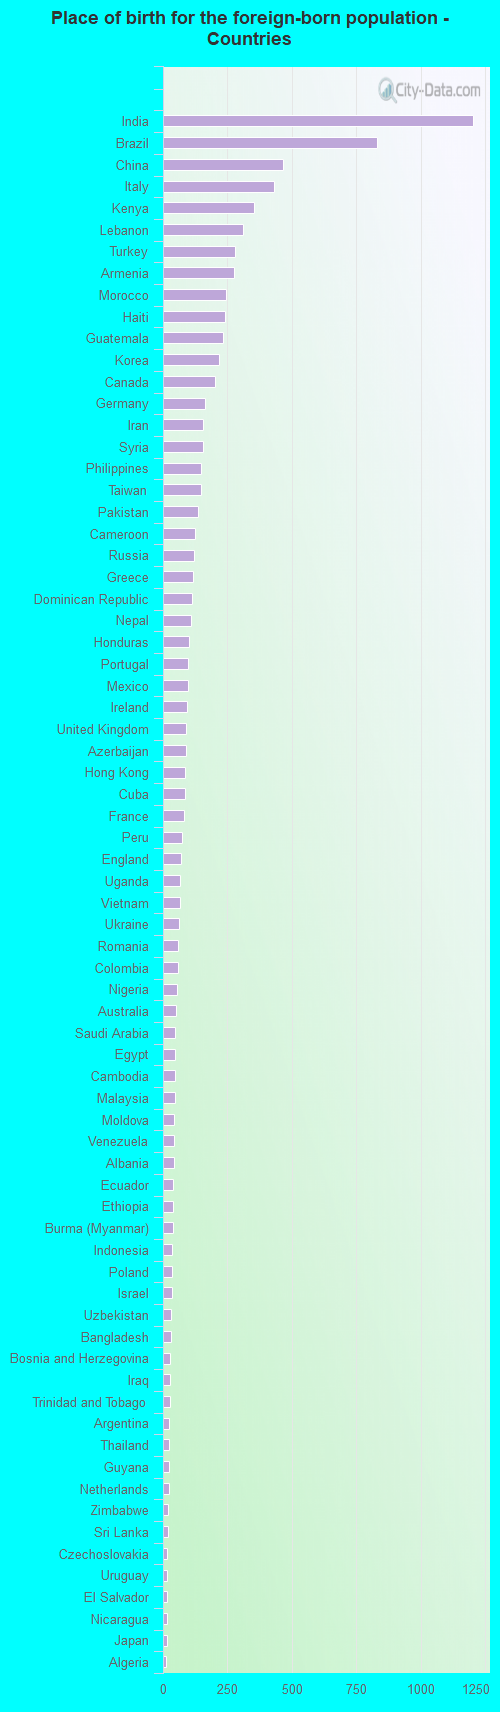
Place of birth for residents in Watertown
Grandparents responsible for own grandchildren in Watertown
Grandparents (30 to 59 years) White / Caucasian 23 62.5% Responsible for grandchildren14 37.5% Not responsible for grandchildrenWhite alone, not Hispanic / Latino 25 63.1% Responsible for grandchildren15 36.9% Not responsible for grandchildren
Grandparents (60 years and over) White / Caucasian 178 100.0% Not responsible for grandchildrenWhite alone, not Hispanic / Latino 176 100.0% Not responsible for grandchildren