Races in Watertown, Wisconsin (WI) Detailed Stats
Data:
Races - White alone (%)
Races - White alone (% change since 2000)
Races - Black alone (%)
Races - Black alone (% change since 2000)
Races - American Indian alone (%)
Races - American Indian alone (% change since 2000)
Races - Asian alone (%)
Races - Asian alone (% change since 2000)
Races - Hispanic (%)
Races - Hispanic (% change since 2000)
Races - Native Hawaiian and Other Pacific Islander alone (%)
Races - Native Hawaiian and Other Pacific Islander alone (% change since 2000)
Races - Two or more races(%)
Races - Two or more races(% change since 2000)
Races - Other race alone (%)
Races - Other race alone (% change since 2000)
Racial diversity
Place of birth - Born in state of residence (%)
Place of birth - Born in state of residence (%) - White
Place of birth - Born in state of residence (%) - Black or African American
Place of birth - Born in state of residence (%) - Asian
Place of birth - Born in state of residence (%) - Hispanic or Latino
Place of birth - Born in state of residence (%) - American Indian and Alaska Native
Place of birth - Born in state of residence (%) - Multirace
Place of birth - Born in state of residence (%) - Other Race
Place of birth - Born in other state (%)
Place of birth - Born in other state (%) - White
Place of birth - Born in other state (%) - Black or African American
Place of birth - Born in other state (%) - Asian
Place of birth - Born in other state (%) - Hispanic or Latino
Place of birth - Born in other state (%) - American Indian and Alaska Native
Place of birth - Born in other state (%) - Multirace
Place of birth - Born in other state (%) - Other Race
Place of birth - Native, outside of US (%)
Place of birth - Native, outside of US (%) - White
Place of birth - Native, outside of US (%) - Black or African American
Place of birth - Native, outside of US (%) - Asian
Place of birth - Native, outside of US (%) - Hispanic or Latino
Place of birth - Native, outside of US (%) - American Indian and Alaska Native
Place of birth - Native, outside of US (%) - Multirace
Place of birth - Native, outside of US (%) - Other Race
Place of birth - Foreign born (%)
Place of birth - Foreign born (%) - White
Place of birth - Foreign born (%) - Black or African American
Place of birth - Foreign born (%) - Asian
Place of birth - Foreign born (%) - Hispanic or Latino
Place of birth - Foreign born (%) - American Indian and Alaska Native
Place of birth - Foreign born (%) - Multirace
Place of birth - Foreign born (%) - Other Race
Residents speaking English at home (%)
Residents speaking English at home - Born in the United States (%)
Residents speaking English at home - Native, born elsewhere (%)
Residents speaking English at home - Foreign born (%)
Residents speaking Spanish at home (%)
Residents speaking Spanish at home - Born in the United States (%)
Residents speaking Spanish at home - Native, born elsewhere (%)
Residents speaking Spanish at home - Foreign born (%)
Residents speaking other language at home (%)
Residents speaking other language at home - Born in the United States (%)
Residents speaking other language at home - Native, born elsewhere (%)
Residents speaking other language at home - Foreign born (%)
Marital status - Never married (%)
Marital status - Now married (%)
Marital status - Separated (%)
Marital status - Widowed (%)
Marital status - Divorced (%)
Ancestries Reported - Arab (%)
Ancestries Reported - Czech (%)
Ancestries Reported - Danish (%)
Ancestries Reported - Dutch (%)
Ancestries Reported - English (%)
Ancestries Reported - French (%)
Ancestries Reported - French Canadian (%)
Ancestries Reported - German (%)
Ancestries Reported - Greek (%)
Ancestries Reported - Hungarian (%)
Ancestries Reported - Irish (%)
Ancestries Reported - Italian (%)
Ancestries Reported - Lithuanian (%)
Ancestries Reported - Norwegian (%)
Ancestries Reported - Polish (%)
Ancestries Reported - Portuguese (%)
Ancestries Reported - Russian (%)
Ancestries Reported - Scotch-Irish (%)
Ancestries Reported - Scottish (%)
Ancestries Reported - Slovak (%)
Ancestries Reported - Subsaharan African (%)
Ancestries Reported - Swedish (%)
Ancestries Reported - Swiss (%)
Ancestries Reported - Ukrainian (%)
Ancestries Reported - United States (%)
Ancestries Reported - Welsh (%)
Ancestries Reported - West Indian (%)
Ancestries Reported - Other (%)
Geographical mobility - Same house 1 year ago (%)
Geographical mobility - Same house 1 year ago (%) - White
Geographical mobility - Same house 1 year ago (%) - Black or African American
Geographical mobility - Same house 1 year ago (%) - Asian
Geographical mobility - Same house 1 year ago (%) - Hispanic or Latino
Geographical mobility - Same house 1 year ago (%) - American Indian and Alaska Native
Geographical mobility - Same house 1 year ago (%) - Multirace
Geographical mobility - Same house 1 year ago (%) - Other Race
Geographical mobility - Moved within same county (%)
Geographical mobility - Moved within same county (%) - White
Geographical mobility - Moved within same county (%) - Black or African American
Geographical mobility - Moved within same county (%) - Asian
Geographical mobility - Moved within same county (%) - Hispanic or Latino
Geographical mobility - Moved within same county (%) - American Indian and Alaska Native
Geographical mobility - Moved within same county (%) - Multirace
Geographical mobility - Moved within same county (%) - Other Race
Geographical mobility - Moved from different county within same state (%)
Geographical mobility - Moved from different county within same state (%) - White
Geographical mobility - Moved from different county within same state (%) - Black or African American
Geographical mobility - Moved from different county within same state (%) - Asian
Geographical mobility - Moved from different county within same state (%) - Hispanic or Latino
Geographical mobility - Moved from different county within same state (%) - American Indian and Alaska Native
Geographical mobility - Moved from different county within same state (%) - Multirace
Geographical mobility - Moved from different county within same state (%) - Other Race
Geographical mobility - Moved from different state (%)
Geographical mobility - Moved from different state (%) - White
Geographical mobility - Moved from different state (%) - Black or African American
Geographical mobility - Moved from different state (%) - Asian
Geographical mobility - Moved from different state (%) - Hispanic or Latino
Geographical mobility - Moved from different state (%) - American Indian and Alaska Native
Geographical mobility - Moved from different state (%) - Multirace
Geographical mobility - Moved from different state (%) - Other Race
Geographical mobility - Moved from abroad (%)
Geographical mobility - Moved from abroad (%) - White
Geographical mobility - Moved from abroad (%) - Black or African American
Geographical mobility - Moved from abroad (%) - Asian
Geographical mobility - Moved from abroad (%) - Hispanic or Latino
Geographical mobility - Moved from abroad (%) - American Indian and Alaska Native
Geographical mobility - Moved from abroad (%) - Multirace
Geographical mobility - Moved from abroad (%) - Other Race
Place of birth for the foreign-born population - Ireland (%)
Place of birth for the foreign-born population - Denmark (%)
Place of birth for the foreign-born population - Norway (%)
Place of birth for the foreign-born population - Sweden (%)
Place of birth for the foreign-born population - United Kingdom (%)
Place of birth for the foreign-born population - England (%)
Place of birth for the foreign-born population - Scotland (%)
Place of birth for the foreign-born population - Other Northern Europe (%)
Place of birth for the foreign-born population - Austria (%)
Place of birth for the foreign-born population - Belgium (%)
Place of birth for the foreign-born population - France (%)
Place of birth for the foreign-born population - Germany (%)
Place of birth for the foreign-born population - Netherlands (%)
Place of birth for the foreign-born population - Switzerland (%)
Place of birth for the foreign-born population - Other Western Europe (%)
Place of birth for the foreign-born population - Greece (%)
Place of birth for the foreign-born population - Italy (%)
Place of birth for the foreign-born population - Portugal (%)
Place of birth for the foreign-born population - Spain (%)
Place of birth for the foreign-born population - Other Southern Europe (%)
Place of birth for the foreign-born population - Albania (%)
Place of birth for the foreign-born population - Belarus (%)
Place of birth for the foreign-born population - Bosnia and Herzegovina (%)
Place of birth for the foreign-born population - Bulgaria (%)
Place of birth for the foreign-born population - Croatia (%)
Place of birth for the foreign-born population - Czechoslovakia (%)
Place of birth for the foreign-born population - Hungary (%)
Place of birth for the foreign-born population - Latvia (%)
Place of birth for the foreign-born population - Lithuania (%)
Place of birth for the foreign-born population - North Macedonia (Macedonia) (%)
Place of birth for the foreign-born population - Moldova (%)
Place of birth for the foreign-born population - Poland (%)
Place of birth for the foreign-born population - Romania (%)
Place of birth for the foreign-born population - Russia (%)
Place of birth for the foreign-born population - Serbia (%)
Place of birth for the foreign-born population - Ukraine (%)
Place of birth for the foreign-born population - Other Eastern Europe (%)
Place of birth for the foreign-born population - China (%)
Place of birth for the foreign-born population - Hong Kong (%)
Place of birth for the foreign-born population - Taiwan (%)
Place of birth for the foreign-born population - Japan (%)
Place of birth for the foreign-born population - Korea (%)
Place of birth for the foreign-born population - Other Eastern Asia (%)
Place of birth for the foreign-born population - Afghanistan (%)
Place of birth for the foreign-born population - Bangladesh (%)
Place of birth for the foreign-born population - India (%)
Place of birth for the foreign-born population - Iran (%)
Place of birth for the foreign-born population - Kazakhstan (%)
Place of birth for the foreign-born population - Nepal (%)
Place of birth for the foreign-born population - Pakistan (%)
Place of birth for the foreign-born population - Sri Lanka (%)
Place of birth for the foreign-born population - Uzbekistan (%)
Place of birth for the foreign-born population - Other South Central Asia (%)
Place of birth for the foreign-born population - Burma (%)
Place of birth for the foreign-born population - Cambodia (%)
Place of birth for the foreign-born population - Indonesia (%)
Place of birth for the foreign-born population - Laos (%)
Place of birth for the foreign-born population - Malaysia (%)
Place of birth for the foreign-born population - Philippines (%)
Place of birth for the foreign-born population - Singapore (%)
Place of birth for the foreign-born population - Thailand (%)
Place of birth for the foreign-born population - Vietnam (%)
Place of birth for the foreign-born population - Other South Eastern Asia (%)
Place of birth for the foreign-born population - Armenia (%)
Place of birth for the foreign-born population - Iraq (%)
Place of birth for the foreign-born population - Israel (%)
Place of birth for the foreign-born population - Jordan (%)
Place of birth for the foreign-born population - Kuwait (%)
Place of birth for the foreign-born population - Lebanon (%)
Place of birth for the foreign-born population - Saudi Arabia (%)
Place of birth for the foreign-born population - Syria (%)
Place of birth for the foreign-born population - Turkey (%)
Place of birth for the foreign-born population - Yemen (%)
Place of birth for the foreign-born population - Other Western Asia (%)
Place of birth for the foreign-born population - Eritrea (%)
Place of birth for the foreign-born population - Ethiopia (%)
Place of birth for the foreign-born population - Kenya (%)
Place of birth for the foreign-born population - Somalia (%)
Place of birth for the foreign-born population - Uganda (%)
Place of birth for the foreign-born population - Zimbabwe (%)
Place of birth for the foreign-born population - Other Eastern Africa (%)
Place of birth for the foreign-born population - Cameroon (%)
Place of birth for the foreign-born population - Congo (%)
Place of birth for the foreign-born population - Democratic Republic of Congo (Zaire) (%)
Place of birth for the foreign-born population - Other Middle Africa (%)
Place of birth for the foreign-born population - Egypt (%)
Place of birth for the foreign-born population - Morocco (%)
Place of birth for the foreign-born population - Sudan (%)
Place of birth for the foreign-born population - Other Northern Africa (%)
Place of birth for the foreign-born population - South Africa (%)
Place of birth for the foreign-born population - Other Southern Africa (%)
Place of birth for the foreign-born population - Cabo Verde (%)
Place of birth for the foreign-born population - Ghana (%)
Place of birth for the foreign-born population - Liberia (%)
Place of birth for the foreign-born population - Nigeria (%)
Place of birth for the foreign-born population - Senegal (%)
Place of birth for the foreign-born population - Sierra Leone (%)
Place of birth for the foreign-born population - Other Western Africa (%)
Place of birth for the foreign-born population - Australia (%)
Place of birth for the foreign-born population - New Zealand (%)
Place of birth for the foreign-born population - Fiji (%)
Place of birth for the foreign-born population - Micronesia (%)
Place of birth for the foreign-born population - Bahamas (%)
Place of birth for the foreign-born population - Barbados (%)
Place of birth for the foreign-born population - Cuba (%)
Place of birth for the foreign-born population - Dominica (%)
Place of birth for the foreign-born population - Dominican Republic (%)
Place of birth for the foreign-born population - Grenada (%)
Place of birth for the foreign-born population - Haiti (%)
Place of birth for the foreign-born population - Jamaica (%)
Place of birth for the foreign-born population - St. Vincent and the Grenadines (%)
Place of birth for the foreign-born population - Trinidad and Tobago (%)
Place of birth for the foreign-born population - West Indies (%)
Place of birth for the foreign-born population - Other Caribbean (%)
Place of birth for the foreign-born population - Belize (%)
Place of birth for the foreign-born population - Costa Rica (%)
Place of birth for the foreign-born population - El Salvador (%)
Place of birth for the foreign-born population - Guatemala (%)
Place of birth for the foreign-born population - Honduras (%)
Place of birth for the foreign-born population - Mexico (%)
Place of birth for the foreign-born population - Nicaragua (%)
Place of birth for the foreign-born population - Panama (%)
Place of birth for the foreign-born population - Other Central America (%)
Place of birth for the foreign-born population - Argentina (%)
Place of birth for the foreign-born population - Bolivia (%)
Place of birth for the foreign-born population - Brazil (%)
Place of birth for the foreign-born population - Chile (%)
Place of birth for the foreign-born population - Colombia (%)
Place of birth for the foreign-born population - Ecuador (%)
Place of birth for the foreign-born population - Guyana (%)
Place of birth for the foreign-born population - Peru (%)
Place of birth for the foreign-born population - Uruguay (%)
Place of birth for the foreign-born population - Venezuela (%)
Place of birth for the foreign-born population - Other South America (%)
Place of birth for the foreign-born population - Canada (%)
Place of birth for the foreign-born population - Other Northern America (%)
Place of birth for the foreign-born population - Other (%)
Latest news about races in Watertown, WI collected exclusively by city-data.com from local newspapers, TV, and radio stations
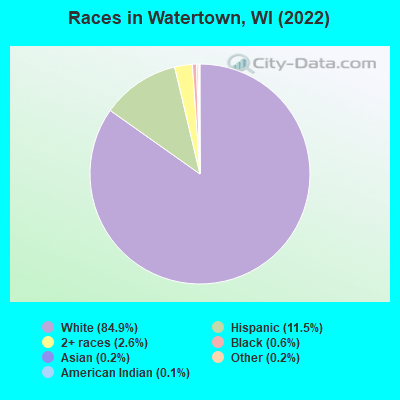
According to 2022 data, the most numerous races in Watertown, WI are White alone (19,470 residents), Hispanic (2,648 residents), and Black alone (130 residents). 92.0% of Watertown residents speak English at home. 3.0% of Watertown, WI residents are foreign-born (1.8% born in Latin America, 0.5% born in Asia, 0.4% born in Europe), which is 68.7% less than the foreign-born rate of 5.0% across the entire state of Wisconsin.
Race distribution in Watertown
2000 2022
4,681,630 87.3% White alone 300,245 5.6% Black alone 192,921 3.6% Hispanic 87,995 1.6% Asian alone 51,921 1.0% Two or more races 43,980 0.8% American Indian alone 3,637 0.07% Other race alone 1,346 0.03% Native Hawaiian and Other
4,654,031 79.0% White alone 447,022 7.6% Hispanic 345,678 5.9% Black alone 217,532 3.7% Two or more races 172,242 2.9% Asian alone 33,762 0.6% American Indian alone 19,680 0.3% Other race alone 2,592 0.04% Native Hawaiian and Other
Income and house value in Watertown Median household income in 2022 $68,361 White non-Hispanic householders$72,882 Some other race householders$70,604 Two or more races householders$89,932 Hispanic or Latino race householdersMedian 2022 house value $227,157 White Non-Hispanic householders$92,507 Black or African American householders $168,774 Asian householders$176,175 Some other race householders$198,171 Two or more races householders$209,477 Hispanic or Latino householders
Median age by race in Watertown
42.1 Median age for White residents41.3 43.0 33.7 Median age for Black or African American residents31.1 20.4 35.5 Median age for American Indian / Alaska Native residents-704,819,276.4 29.7 24.4 Median age for Asian residents-396,825,396.4 -553,963,705.3 -666,666,666.0 Median age for Native Hawaiian / Pacific Islander residents-666,666,666.0 -666,666,666.0 48.9 Median age for Other race residents52.6 37.7 21.4 Median age for Two or more races residents20.3 21.7 43.7 Median age for White alone residents42.5 45.2 20.7 Median age for Hispanic or Latino residents16.5 23.4
Owner/renter occupied households by race in Watertown
House owners and renters - White residents 5,195 63.0% Owner occupied3,056 37.0% Renter occupiedHouse owners and renters - Black or African American residents 19 100.0% Owner occupiedHouse owners and renters - American Indian / Alaska Native residents 10 100.0% Renter occupiedHouse owners and renters - Asian residents 1 2.8% Owner occupied40 97.2% Renter occupiedHouse owners and renters - Other race residents 10 9.1% Owner occupied103 90.9% Renter occupiedHouse owners and renters - Two or more races residents 434 51.7% Owner occupied405 48.3% Renter occupiedHouse owners and renters - White alone residents 5,100 63.1% Owner occupied2,986 36.9% Renter occupiedHouse owners and renters - Hispanic or Latino residents 287 43.6% Owner occupied371 56.4% Renter occupied
Language usage in Watertown
English speakers - Total 92.0% of residents of Watertown speak English at home.
6.3% of residents speak Spanish at home 798 58.3% Speak English very well571 41.7% Speak English less than very well1.6% of residents speak other language at home 133 36.9% Speak English very well227 63.1% Speak English less than very well
English speakers - Born in the United States 92.8% of residents of Watertown speak English at home.
7.1% of residents speak Spanish at home 194 56.1% Speak English very well152 43.9% Speak English less than very well
English speakers - Native, born elsewhere 60.7% of residents of Watertown speak English at home.
16.9% of residents speak Spanish at home 3 10.0% Speak English very well27 90.0% Speak English less than very well12.9% of residents speak other language at home 23 100.0% Speak English less than very well
English speakers - Foreign-born 18.2% of residents of Watertown speak English at home.
62.4% of residents speak Spanish at home 50 11.8% Speak English very well375 88.2% Speak English less than very well22.8% of residents speak other language at home 13 8.4% Speak English very well142 91.6% Speak English less than very well
White (Caucasian) - Speak only English Native:
98.2% (18,625)Foreign-born:
11.8% (38)
White (Caucasian) - Speak another language Native:
1.6% (311)Foreign-born:
91.4% (295)
American Indian / Alaska Native - Speak another language Native:
21.7% (6)Foreign-born:
100.0% (8)
Asian - Speak only English Native:
100.0% (1)Foreign-born:
82.4% (41)
Other race - Speak only English Native:
58.7% (112)Foreign-born:
6.2% (4)
Other race - Speak another language Native:
40.8% (78)Foreign-born:
93.4% (60)
Two or more races - Speak another language Native:
58.1% (1,092)Foreign-born:
100.0% (365)
White alone - Speak only English Native:
98.7% (18,244)Foreign-born:
17.5% (53)
White alone - Speak another language Native:
1.3% (236)Foreign-born:
76.8% (231)
Hispanic or Latino - Speak only English Native:
48.9% (914)Foreign-born:
0.9% (4)
Hispanic or Latino - Speak another language Native:
50.6% (946)Foreign-born:
100.0% (412)
Foreign-born residents in Watertown 680 residents are foreign born (1.8% Latin America , 0.5% Asia , 0.4% Europe ).
This city:
3.0%Wisconsin:
5.0%
Marital status for residents in Watertown Marital status - White (Caucasian) population 15 years and over
Males 35.4% Never married50.3% Now married0.5% Separated4.4% Widowed9.3% DivorcedFemales 29.1% Never married44.5% Now married0.7% Separated9.4% Widowed16.3% DivorcedWomen who gave birth in the past 12 months Now married:
54.0% (83)Unmarried:
46.0% (71)
Women who did not give birth in the past 12 months Now married:
37.4% (1,669)Unmarried:
62.6% (2,790)
Marital status - Black or African American population 15 years and over
Males 53.1% Never married29.7% Now married0.0% Separated0.0% Widowed17.2% DivorcedFemales 100.0% Never married0.0% Now married0.0% Separated0.0% Widowed0.0% DivorcedWomen who did not give birth in the past 12 months Now married:
0.0% (0)Unmarried:
100.0% (25)
Marital status - American Indian / Alaska Native population 15 years and over
Males 75.0% Never married25.0% Now married0.0% Separated0.0% Widowed0.0% DivorcedFemales 62.5% Never married37.5% Now married0.0% Separated0.0% Widowed0.0% DivorcedWomen who did not give birth in the past 12 months Now married:
37.5% (3)Unmarried:
62.5% (5)
Marital status - Asian population 15 years and over
Males 0.0% Never married100.0% Now married0.0% Separated0.0% Widowed0.0% DivorcedFemales 0.0% Never married10.0% Now married0.0% Separated0.0% Widowed90.0% DivorcedWomen who did not give birth in the past 12 months Now married:
10.0% (5)Unmarried:
90.0% (44)
Marital status - Other race population 15 years and over
Males 45.1% Never married39.2% Now married0.0% Separated0.0% Widowed15.7% DivorcedFemales 82.8% Never married17.2% Now married0.0% Separated0.0% Widowed0.0% DivorcedWomen who did not give birth in the past 12 months Now married:
16.7% (23)Unmarried:
83.3% (113)
Marital status - Two or more races population 15 years and over
Males 53.7% Never married37.4% Now married0.0% Separated0.0% Widowed8.9% DivorcedFemales 63.5% Never married26.1% Now married0.0% Separated0.0% Widowed10.4% DivorcedWomen who gave birth in the past 12 months Now married:
100.0% (22)Unmarried:
0.0% (0)
Women who did not give birth in the past 12 months Now married:
23.7% (240)Unmarried:
76.3% (772)
Marital status - White alone, not Hispanic / Latino population 15 years and over
Males 34.8% Never married50.5% Now married0.5% Separated4.6% Widowed9.5% DivorcedFemales 28.5% Never married44.3% Now married0.7% Separated9.7% Widowed16.8% DivorcedWomen who gave birth in the past 12 months Now married:
54.0% (85)Unmarried:
46.0% (73)
Women who did not give birth in the past 12 months Now married:
37.0% (1,573)Unmarried:
63.0% (2,674)
Marital status - Hispanic or Latino population 15 years and over
Males 53.5% Never married40.6% Now married0.0% Separated0.0% Widowed5.8% DivorcedFemales 61.1% Never married33.5% Now married0.0% Separated0.7% Widowed4.7% DivorcedWomen who gave birth in the past 12 months Now married:
100.0% (16)Unmarried:
0.0% (0)
Women who did not give birth in the past 12 months Now married:
28.7% (266)Unmarried:
71.3% (661)
Ancestries in Watertown
4,810 44.2% German710 6.5% American645 5.9% Irish585 5.4% English478 4.4% Polish390 3.6% European280 2.6% Norwegian192 1.8% French95 0.9% Albanian74 0.7% Czech70 0.6% Swedish67 0.6% Italian64 0.6% Scandinavian53 0.5% Scottish48 0.4% Scotch-Irish47 0.4% Belgian41 0.4% Croatian37 0.3% Russian36 0.3% Danish23 0.2% Welsh21 0.2% Slovene18 0.2% Lithuanian15 0.1% French Canadian12 0.1% Finnish10 0.09% Czechoslovakian9 0.08% Greek8 0.07% Romanian5 0.05% Dutch5 0.05% Slovak3 0.03% Lebanese
Geographical mobility in Watertown Same house 1 year ago 17,440 87.0% White (Caucasian)74 70.3% Black or African American37 100.0% American Indian / Alaska Native52 99.6% Asian214 84.8% Other race2,494 97.8% Two or more races16,827 86.8% White alone, not Hispanic / Latino2,435 93.9% Hispanic or LatinoMoved within same county 481 2.4% White / Caucasian4 3.9% Black or African American469 2.4% White alone, not Hispanic / Latino20 0.8% Hispanic or LatinoMoved within same state 1,809 9.0% White / Caucasian22 21.3% Black or African American11 4.2% Other race68 2.7% Two or more races1,783 9.2% White alone, not Hispanic / Latino110 4.2% Hispanic or LatinoMoved from different state 382 1.9% White / Caucasian31 12.1% Other race11 0.4% Two or more races396 2.0% White alone, not Hispanic / Latino37 1.4% Hispanic or LatinoMoved from abroad 30 0.1% White30 0.2% White alone, not Hispanic / Latino
Children Nativity (place of birth) in Watertown
Children under 6 years - Living with two parents Both parents native 564 100.0% NativeBoth parents foreign-born 110 100.0% NativeOne native, one foreign-born parent 19 100.0% NativeChildren under 6 years - Living with one parent Native parent 650 100.0% NativeChildren 6 to 17 years - Living with two parents Both parents native 1,643 100.0% NativeBoth parents foreign-born 275 100.0% NativeOne native, one foreign-born parent 1 98.6% NativeChildren 6 to 17 years - Living with one parent Native parent 1,216 100.0% NativeForeign-born parent 75 48.4% Native80 51.6% Foreign-born
Grandparents responsible for own grandchildren in Watertown
Grandparents (30 to 59 years) White / Caucasian 150 73.2% Responsible for grandchildren55 26.8% Not responsible for grandchildrenWhite alone, not Hispanic / Latino 156 73.2% Responsible for grandchildren57 26.8% Not responsible for grandchildrenGrandparents (60 years and over) White / Caucasian 20 34.2% Responsible for grandchildren38 65.8% Not responsible for grandchildrenWhite alone, not Hispanic / Latino 20 33.5% Responsible for grandchildren40 66.5% Not responsible for grandchildren