Races in Waterville, Maine (ME) Detailed Stats
Data:
Races - White alone (%)
Races - White alone (% change since 2000)
Races - Black alone (%)
Races - Black alone (% change since 2000)
Races - American Indian alone (%)
Races - American Indian alone (% change since 2000)
Races - Asian alone (%)
Races - Asian alone (% change since 2000)
Races - Hispanic (%)
Races - Hispanic (% change since 2000)
Races - Native Hawaiian and Other Pacific Islander alone (%)
Races - Native Hawaiian and Other Pacific Islander alone (% change since 2000)
Races - Two or more races(%)
Races - Two or more races(% change since 2000)
Races - Other race alone (%)
Races - Other race alone (% change since 2000)
Racial diversity
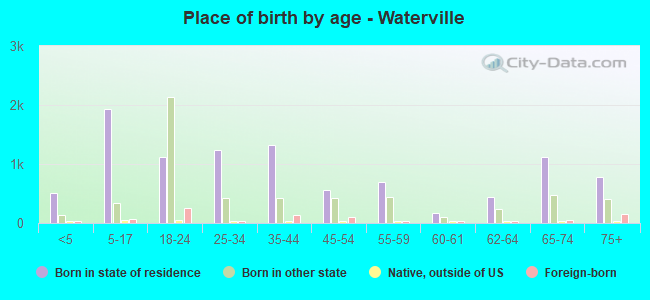
Place of birth - Born in state of residence (%)
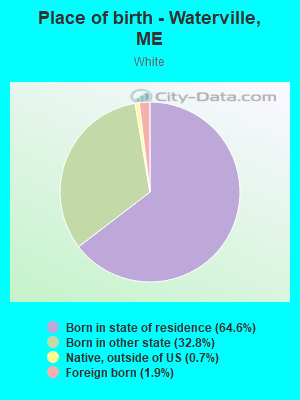
Place of birth - Born in state of residence (%) - White
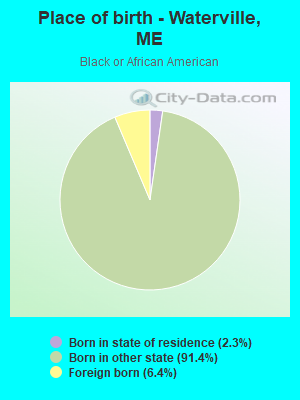
Place of birth - Born in state of residence (%) - Black or African American
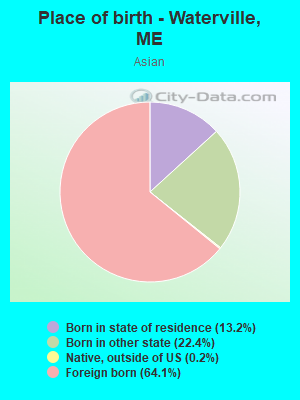
Place of birth - Born in state of residence (%) - Asian
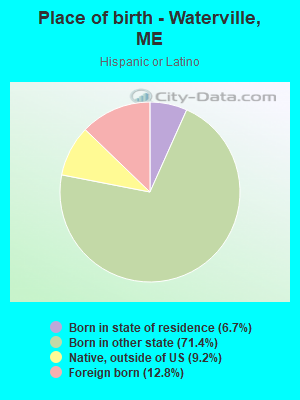
Place of birth - Born in state of residence (%) - Hispanic or Latino
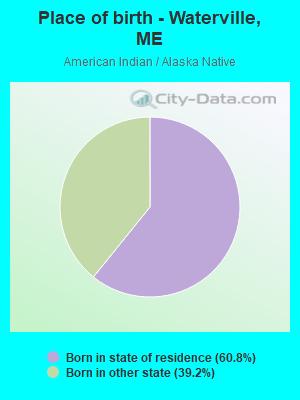
Place of birth - Born in state of residence (%) - American Indian and Alaska Native
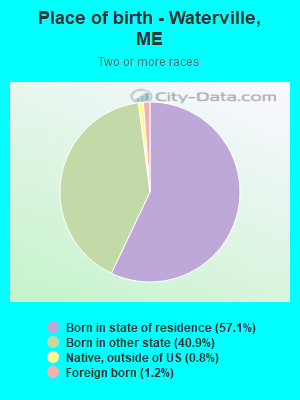
Place of birth - Born in state of residence (%) - Multirace
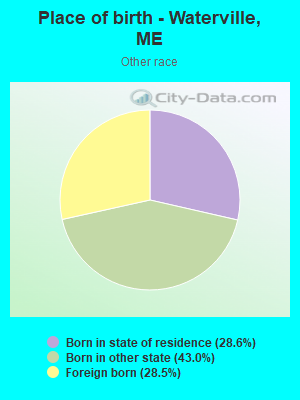
Place of birth - Born in state of residence (%) - Other Race
Place of birth - Born in other state (%)
Place of birth - Born in other state (%) - White
Place of birth - Born in other state (%) - Black or African American
Place of birth - Born in other state (%) - Asian
Place of birth - Born in other state (%) - Hispanic or Latino
Place of birth - Born in other state (%) - American Indian and Alaska Native
Place of birth - Born in other state (%) - Multirace
Place of birth - Born in other state (%) - Other Race
Place of birth - Native, outside of US (%)
Place of birth - Native, outside of US (%) - White
Place of birth - Native, outside of US (%) - Black or African American
Place of birth - Native, outside of US (%) - Asian
Place of birth - Native, outside of US (%) - Hispanic or Latino
Place of birth - Native, outside of US (%) - American Indian and Alaska Native
Place of birth - Native, outside of US (%) - Multirace
Place of birth - Native, outside of US (%) - Other Race
Place of birth - Foreign born (%)
Place of birth - Foreign born (%) - White
Place of birth - Foreign born (%) - Black or African American
Place of birth - Foreign born (%) - Asian
Place of birth - Foreign born (%) - Hispanic or Latino
Place of birth - Foreign born (%) - American Indian and Alaska Native
Place of birth - Foreign born (%) - Multirace
Place of birth - Foreign born (%) - Other Race
Residents speaking English at home (%)
Residents speaking English at home - Born in the United States (%)
Residents speaking English at home - Native, born elsewhere (%)
Residents speaking English at home - Foreign born (%)
Residents speaking Spanish at home (%)
Residents speaking Spanish at home - Born in the United States (%)
Residents speaking Spanish at home - Native, born elsewhere (%)
Residents speaking Spanish at home - Foreign born (%)
Residents speaking other language at home (%)
Residents speaking other language at home - Born in the United States (%)
Residents speaking other language at home - Native, born elsewhere (%)
Residents speaking other language at home - Foreign born (%)
Marital status - Never married (%)
Marital status - Now married (%)
Marital status - Separated (%)
Marital status - Widowed (%)
Marital status - Divorced (%)
Ancestries Reported - Arab (%)
Ancestries Reported - Czech (%)
Ancestries Reported - Danish (%)
Ancestries Reported - Dutch (%)
Ancestries Reported - English (%)
Ancestries Reported - French (%)
Ancestries Reported - French Canadian (%)
Ancestries Reported - German (%)
Ancestries Reported - Greek (%)
Ancestries Reported - Hungarian (%)
Ancestries Reported - Irish (%)
Ancestries Reported - Italian (%)
Ancestries Reported - Lithuanian (%)
Ancestries Reported - Norwegian (%)
Ancestries Reported - Polish (%)
Ancestries Reported - Portuguese (%)
Ancestries Reported - Russian (%)
Ancestries Reported - Scotch-Irish (%)
Ancestries Reported - Scottish (%)
Ancestries Reported - Slovak (%)
Ancestries Reported - Subsaharan African (%)
Ancestries Reported - Swedish (%)
Ancestries Reported - Swiss (%)
Ancestries Reported - Ukrainian (%)
Ancestries Reported - United States (%)
Ancestries Reported - Welsh (%)
Ancestries Reported - West Indian (%)
Ancestries Reported - Other (%)
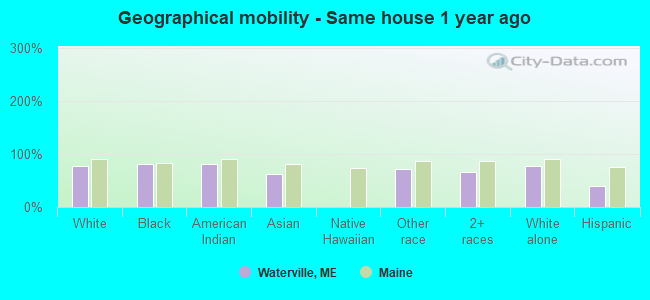
Geographical mobility - Same house 1 year ago (%)
Geographical mobility - Same house 1 year ago (%) - White
Geographical mobility - Same house 1 year ago (%) - Black or African American
Geographical mobility - Same house 1 year ago (%) - Asian
Geographical mobility - Same house 1 year ago (%) - Hispanic or Latino
Geographical mobility - Same house 1 year ago (%) - American Indian and Alaska Native
Geographical mobility - Same house 1 year ago (%) - Multirace
Geographical mobility - Same house 1 year ago (%) - Other Race
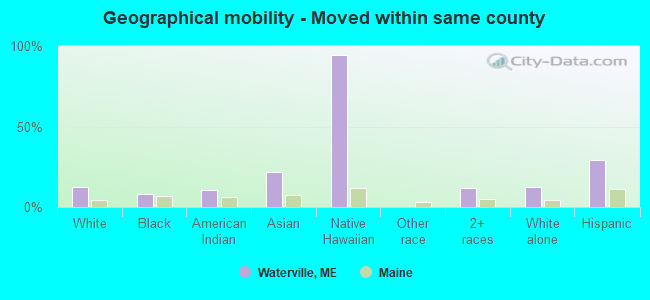
Geographical mobility - Moved within same county (%)
Geographical mobility - Moved within same county (%) - White
Geographical mobility - Moved within same county (%) - Black or African American
Geographical mobility - Moved within same county (%) - Asian
Geographical mobility - Moved within same county (%) - Hispanic or Latino
Geographical mobility - Moved within same county (%) - American Indian and Alaska Native
Geographical mobility - Moved within same county (%) - Multirace
Geographical mobility - Moved within same county (%) - Other Race
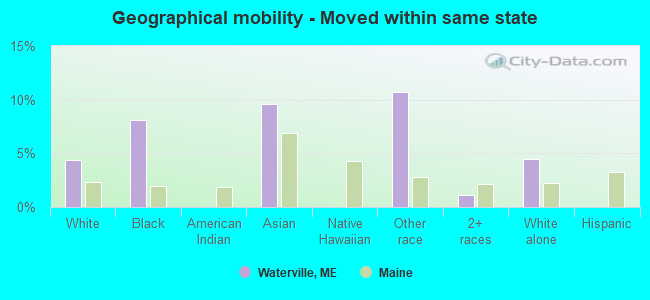
Geographical mobility - Moved from different county within same state (%)
Geographical mobility - Moved from different county within same state (%) - White
Geographical mobility - Moved from different county within same state (%) - Black or African American
Geographical mobility - Moved from different county within same state (%) - Asian
Geographical mobility - Moved from different county within same state (%) - Hispanic or Latino
Geographical mobility - Moved from different county within same state (%) - American Indian and Alaska Native
Geographical mobility - Moved from different county within same state (%) - Multirace
Geographical mobility - Moved from different county within same state (%) - Other Race
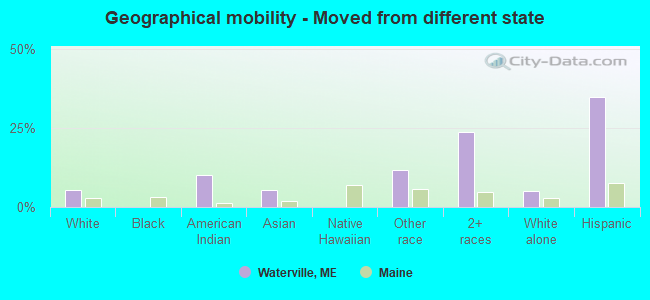
Geographical mobility - Moved from different state (%)
Geographical mobility - Moved from different state (%) - White
Geographical mobility - Moved from different state (%) - Black or African American
Geographical mobility - Moved from different state (%) - Asian
Geographical mobility - Moved from different state (%) - Hispanic or Latino
Geographical mobility - Moved from different state (%) - American Indian and Alaska Native
Geographical mobility - Moved from different state (%) - Multirace
Geographical mobility - Moved from different state (%) - Other Race
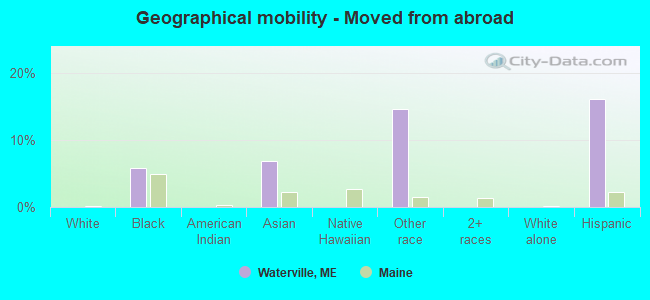
Geographical mobility - Moved from abroad (%)
Geographical mobility - Moved from abroad (%) - White
Geographical mobility - Moved from abroad (%) - Black or African American
Geographical mobility - Moved from abroad (%) - Asian
Geographical mobility - Moved from abroad (%) - Hispanic or Latino
Geographical mobility - Moved from abroad (%) - American Indian and Alaska Native
Geographical mobility - Moved from abroad (%) - Multirace
Geographical mobility - Moved from abroad (%) - Other Race
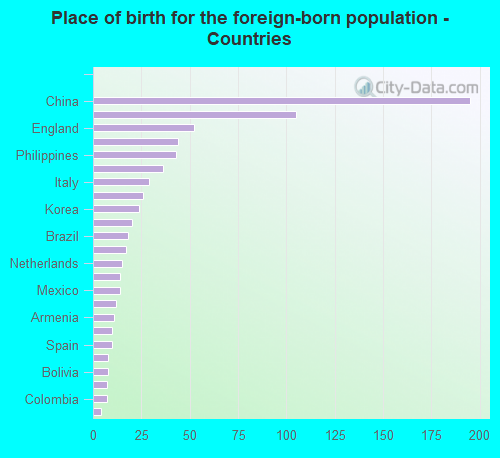
Place of birth for the foreign-born population - Ireland (%)
Place of birth for the foreign-born population - Denmark (%)
Place of birth for the foreign-born population - Norway (%)
Place of birth for the foreign-born population - Sweden (%)
Place of birth for the foreign-born population - United Kingdom (%)
Place of birth for the foreign-born population - England (%)
Place of birth for the foreign-born population - Scotland (%)
Place of birth for the foreign-born population - Other Northern Europe (%)
Place of birth for the foreign-born population - Austria (%)
Place of birth for the foreign-born population - Belgium (%)
Place of birth for the foreign-born population - France (%)
Place of birth for the foreign-born population - Germany (%)
Place of birth for the foreign-born population - Netherlands (%)
Place of birth for the foreign-born population - Switzerland (%)
Place of birth for the foreign-born population - Other Western Europe (%)
Place of birth for the foreign-born population - Greece (%)
Place of birth for the foreign-born population - Italy (%)
Place of birth for the foreign-born population - Portugal (%)
Place of birth for the foreign-born population - Spain (%)
Place of birth for the foreign-born population - Other Southern Europe (%)
Place of birth for the foreign-born population - Albania (%)
Place of birth for the foreign-born population - Belarus (%)
Place of birth for the foreign-born population - Bosnia and Herzegovina (%)
Place of birth for the foreign-born population - Bulgaria (%)
Place of birth for the foreign-born population - Croatia (%)
Place of birth for the foreign-born population - Czechoslovakia (%)
Place of birth for the foreign-born population - Hungary (%)
Place of birth for the foreign-born population - Latvia (%)
Place of birth for the foreign-born population - Lithuania (%)
Place of birth for the foreign-born population - North Macedonia (Macedonia) (%)
Place of birth for the foreign-born population - Moldova (%)
Place of birth for the foreign-born population - Poland (%)
Place of birth for the foreign-born population - Romania (%)
Place of birth for the foreign-born population - Russia (%)
Place of birth for the foreign-born population - Serbia (%)
Place of birth for the foreign-born population - Ukraine (%)
Place of birth for the foreign-born population - Other Eastern Europe (%)
Place of birth for the foreign-born population - China (%)
Place of birth for the foreign-born population - Hong Kong (%)
Place of birth for the foreign-born population - Taiwan (%)
Place of birth for the foreign-born population - Japan (%)
Place of birth for the foreign-born population - Korea (%)
Place of birth for the foreign-born population - Other Eastern Asia (%)
Place of birth for the foreign-born population - Afghanistan (%)
Place of birth for the foreign-born population - Bangladesh (%)
Place of birth for the foreign-born population - India (%)
Place of birth for the foreign-born population - Iran (%)
Place of birth for the foreign-born population - Kazakhstan (%)
Place of birth for the foreign-born population - Nepal (%)
Place of birth for the foreign-born population - Pakistan (%)
Place of birth for the foreign-born population - Sri Lanka (%)
Place of birth for the foreign-born population - Uzbekistan (%)
Place of birth for the foreign-born population - Other South Central Asia (%)
Place of birth for the foreign-born population - Burma (%)
Place of birth for the foreign-born population - Cambodia (%)
Place of birth for the foreign-born population - Indonesia (%)
Place of birth for the foreign-born population - Laos (%)
Place of birth for the foreign-born population - Malaysia (%)
Place of birth for the foreign-born population - Philippines (%)
Place of birth for the foreign-born population - Singapore (%)
Place of birth for the foreign-born population - Thailand (%)
Place of birth for the foreign-born population - Vietnam (%)
Place of birth for the foreign-born population - Other South Eastern Asia (%)
Place of birth for the foreign-born population - Armenia (%)
Place of birth for the foreign-born population - Iraq (%)
Place of birth for the foreign-born population - Israel (%)
Place of birth for the foreign-born population - Jordan (%)
Place of birth for the foreign-born population - Kuwait (%)
Place of birth for the foreign-born population - Lebanon (%)
Place of birth for the foreign-born population - Saudi Arabia (%)
Place of birth for the foreign-born population - Syria (%)
Place of birth for the foreign-born population - Turkey (%)
Place of birth for the foreign-born population - Yemen (%)
Place of birth for the foreign-born population - Other Western Asia (%)
Place of birth for the foreign-born population - Eritrea (%)
Place of birth for the foreign-born population - Ethiopia (%)
Place of birth for the foreign-born population - Kenya (%)
Place of birth for the foreign-born population - Somalia (%)
Place of birth for the foreign-born population - Uganda (%)
Place of birth for the foreign-born population - Zimbabwe (%)
Place of birth for the foreign-born population - Other Eastern Africa (%)
Place of birth for the foreign-born population - Cameroon (%)
Place of birth for the foreign-born population - Congo (%)
Place of birth for the foreign-born population - Democratic Republic of Congo (Zaire) (%)
Place of birth for the foreign-born population - Other Middle Africa (%)
Place of birth for the foreign-born population - Egypt (%)
Place of birth for the foreign-born population - Morocco (%)
Place of birth for the foreign-born population - Sudan (%)
Place of birth for the foreign-born population - Other Northern Africa (%)
Place of birth for the foreign-born population - South Africa (%)
Place of birth for the foreign-born population - Other Southern Africa (%)
Place of birth for the foreign-born population - Cabo Verde (%)
Place of birth for the foreign-born population - Ghana (%)
Place of birth for the foreign-born population - Liberia (%)
Place of birth for the foreign-born population - Nigeria (%)
Place of birth for the foreign-born population - Senegal (%)
Place of birth for the foreign-born population - Sierra Leone (%)
Place of birth for the foreign-born population - Other Western Africa (%)
Place of birth for the foreign-born population - Australia (%)
Place of birth for the foreign-born population - New Zealand (%)
Place of birth for the foreign-born population - Fiji (%)
Place of birth for the foreign-born population - Micronesia (%)
Place of birth for the foreign-born population - Bahamas (%)
Place of birth for the foreign-born population - Barbados (%)
Place of birth for the foreign-born population - Cuba (%)
Place of birth for the foreign-born population - Dominica (%)
Place of birth for the foreign-born population - Dominican Republic (%)
Place of birth for the foreign-born population - Grenada (%)
Place of birth for the foreign-born population - Haiti (%)
Place of birth for the foreign-born population - Jamaica (%)
Place of birth for the foreign-born population - St. Vincent and the Grenadines (%)
Place of birth for the foreign-born population - Trinidad and Tobago (%)
Place of birth for the foreign-born population - West Indies (%)
Place of birth for the foreign-born population - Other Caribbean (%)
Place of birth for the foreign-born population - Belize (%)
Place of birth for the foreign-born population - Costa Rica (%)
Place of birth for the foreign-born population - El Salvador (%)
Place of birth for the foreign-born population - Guatemala (%)
Place of birth for the foreign-born population - Honduras (%)
Place of birth for the foreign-born population - Mexico (%)
Place of birth for the foreign-born population - Nicaragua (%)
Place of birth for the foreign-born population - Panama (%)
Place of birth for the foreign-born population - Other Central America (%)
Place of birth for the foreign-born population - Argentina (%)
Place of birth for the foreign-born population - Bolivia (%)
Place of birth for the foreign-born population - Brazil (%)
Place of birth for the foreign-born population - Chile (%)
Place of birth for the foreign-born population - Colombia (%)
Place of birth for the foreign-born population - Ecuador (%)
Place of birth for the foreign-born population - Guyana (%)
Place of birth for the foreign-born population - Peru (%)
Place of birth for the foreign-born population - Uruguay (%)
Place of birth for the foreign-born population - Venezuela (%)
Place of birth for the foreign-born population - Other South America (%)
Place of birth for the foreign-born population - Canada (%)
Place of birth for the foreign-born population - Other Northern America (%)
Place of birth for the foreign-born population - Other (%)
Latest news about races in Waterville, ME collected exclusively by city-data.com from local newspapers, TV, and radio stations
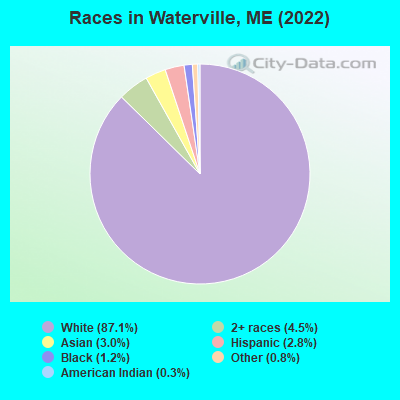
According to 2022 data, the most numerous races in Waterville, ME are White alone (13,918 residents), Two or more races (713 residents), and Hispanic (446 residents). 92.6% of Waterville residents speak English at home. 4.6% of Waterville, ME residents are foreign-born (2.4% born in Asia, 0.9% born in Europe, 0.7% born in North America), which is 35.4% greater than the foreign-born rate of 3.0% across the entire state of Maine.
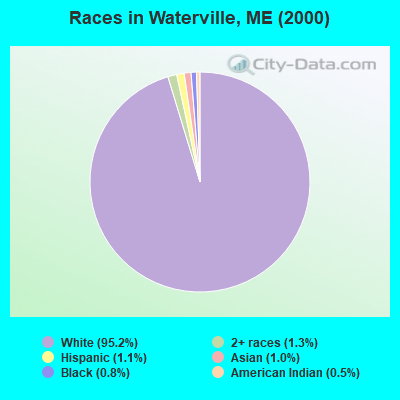
Race distribution in Waterville
2000 2022
1,230,297 96.5% White alone 11,731 0.9% Two or more races 9,360 0.7% Hispanic 9,014 0.7% Asian alone 6,440 0.5% Black alone 6,911 0.5% American Indian alone 836 0.07% Other race alone 334 0.03% Native Hawaiian and Other
1,249,233 90.2% White alone 58,357 4.2% Two or more races 28,717 2.1% Hispanic 21,583 1.6% Black alone 16,151 1.2% Asian alone 5,873 0.4% Other race alone 5,205 0.4% American Indian alone 221 0.02% Native Hawaiian and Other
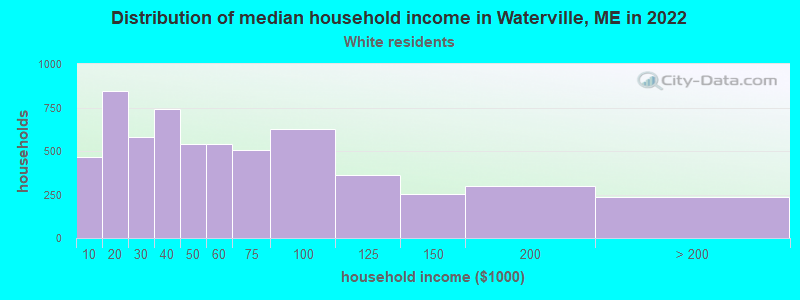
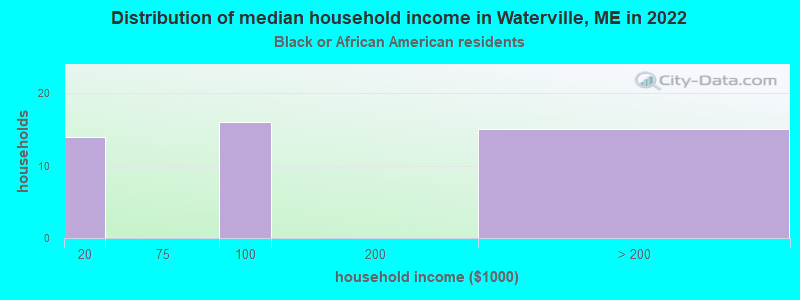
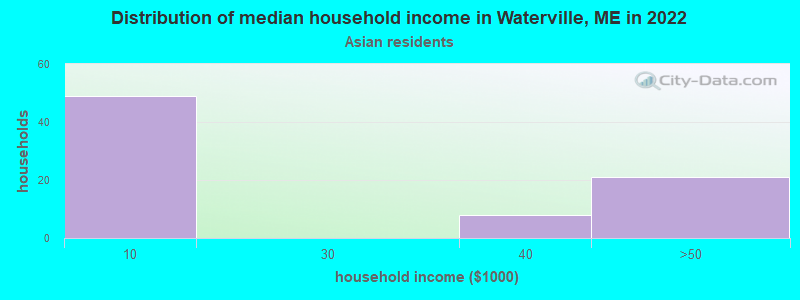
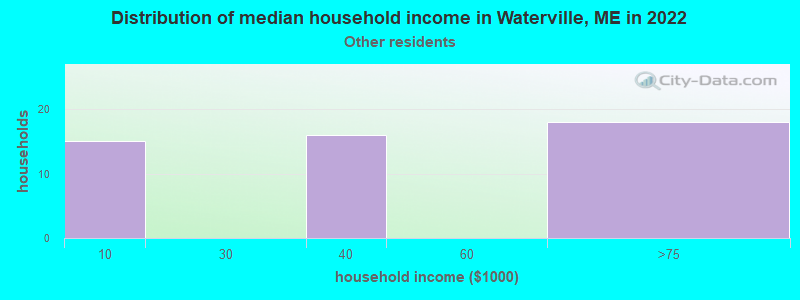
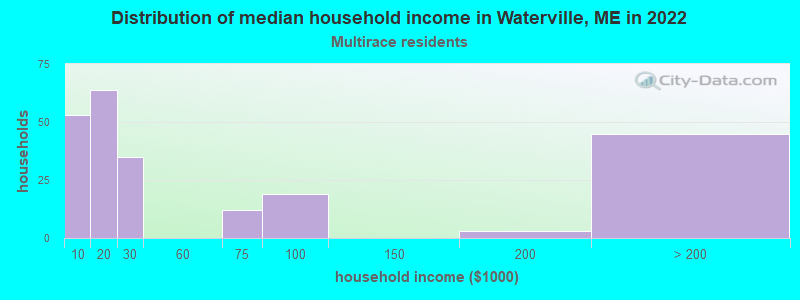
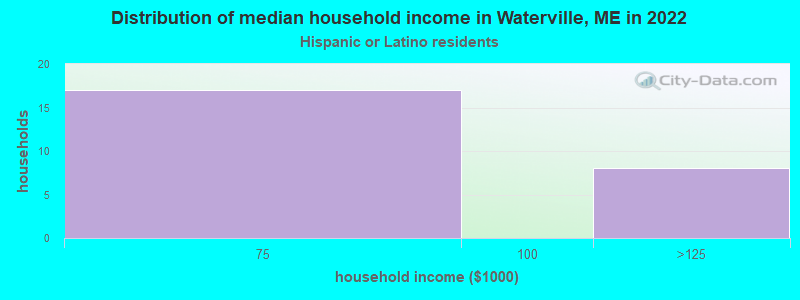
Income and house value in Waterville Median household income in 2022 $46,199 White non-Hispanic householders$21,001 Two or more races householdersMedian 2022 house value $183,605 White Non-Hispanic householders $168,636 Asian householders$441,822 Two or more races householders$263,128 Hispanic or Latino householders
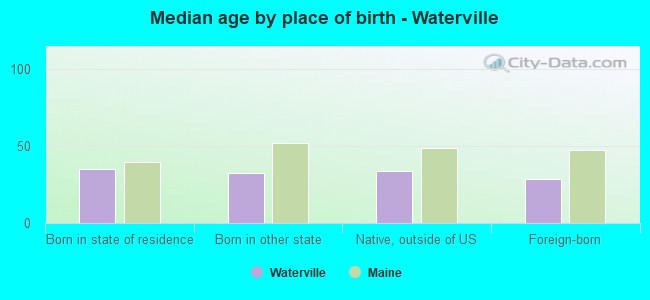
Median age by race in Waterville
36.6 Median age for White residents34.1 40.0 15.2 Median age for Black or African American residents9.8 23.2 35.7 Median age for American Indian / Alaska Native residents42.3 -708,108,107.4 33.0 Median age for Asian residents36.3 18.9 -666,666,666.0 Median age for Native Hawaiian / Pacific Islander residents-666,666,666.0 -666,666,666.0 15.9 Median age for Other race residents16.7 18.6 23.8 Median age for Two or more races residents36.4 27.6 36.6 Median age for White alone residents34.4 40.2 21.1 Median age for Hispanic or Latino residents22.8 24.7
Owner/renter occupied households by race in Waterville
House owners and renters - White residents 2,922 48.9% Owner occupied3,054 51.1% Renter occupiedHouse owners and renters - Black or African American residents 23 42.3% Owner occupied31 57.7% Renter occupiedHouse owners and renters - American Indian / Alaska Native residents 22 100.0% Renter occupiedHouse owners and renters - Asian residents 31 41.3% Owner occupied44 58.7% Renter occupiedHouse owners and renters - Other race residents 16 32.8% Owner occupied32 67.2% Renter occupiedHouse owners and renters - Two or more races residents 59 24.8% Owner occupied179 75.2% Renter occupiedHouse owners and renters - White alone residents 2,916 48.6% Owner occupied3,082 51.4% Renter occupiedHouse owners and renters - Hispanic or Latino residents 34 100.0% Owner occupied
Language usage in Waterville
English speakers - Total 92.6% of residents of Waterville speak English at home.
2.6% of residents speak Spanish at home 371 93.9% Speak English very well24 6.1% Speak English less than very well5.7% of residents speak other language at home 658 76.2% Speak English very well206 23.8% Speak English less than very well
English speakers - Born in the United States 92.1% of residents of Waterville speak English at home.
2.9% of residents speak Spanish at home 141 93.4% Speak English very well10 6.6% Speak English less than very well6.7% of residents speak other language at home 335 96.8% Speak English very well11 3.2% Speak English less than very well
English speakers - Native, born elsewhere 80.4% of residents of Waterville speak English at home.
7.6% of residents speak Spanish at home 7 100.0% Speak English very well35.9% of residents speak other language at home 33 100.0% Speak English very well
English speakers - Foreign-born 29.3% of residents of Waterville speak English at home.
11.1% of residents speak Spanish at home 25 27.2% Speak English very well67 72.8% Speak English less than very well49.2% of residents speak other language at home 241 58.9% Speak English very well168 41.1% Speak English less than very well
White (Caucasian) - Speak only English Native:
96.9% (12,905)Foreign-born:
45.7% (124)
White (Caucasian) - Speak another language Native:
3.1% (411)Foreign-born:
49.9% (135)
Black or African American - Speak only English Native:
100.0% (117)Foreign-born:
64.3% (22)
Asian - Speak another language Native:
65.6% (53)Foreign-born:
87.6% (353)
Other race - Speak only English Native:
77.7% (80)Foreign-born:
59.1% (28)
Other race - Speak another language Native:
21.4% (22)Foreign-born:
50.0% (24)
Two or more races - Speak another language Native:
7.4% (52)Foreign-born:
94.2% (9)
White alone - Speak only English Native:
97.0% (12,794)Foreign-born:
50.6% (131)
White alone - Speak another language Native:
2.9% (388)Foreign-born:
46.1% (119)
Hispanic or Latino - Speak only English Native:
66.7% (177)Foreign-born:
19.1% (12)
Hispanic or Latino - Speak another language Native:
26.1% (69)Foreign-born:
78.7% (48)
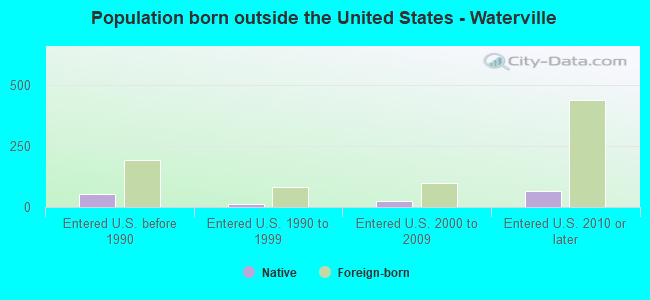
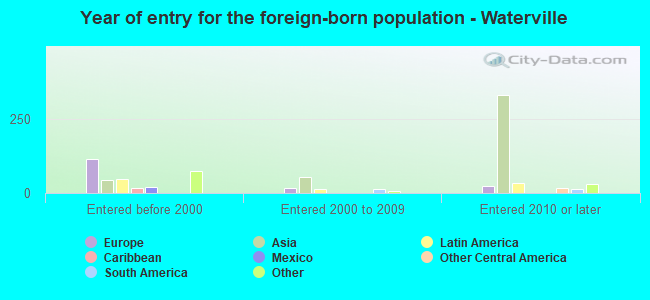
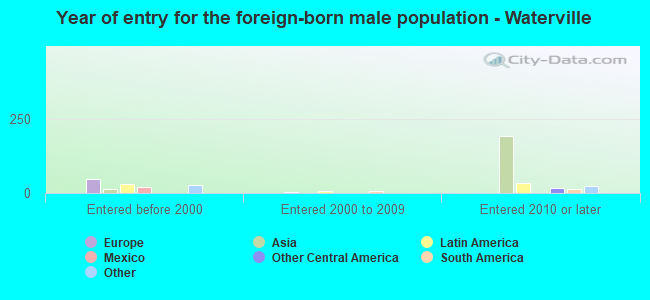
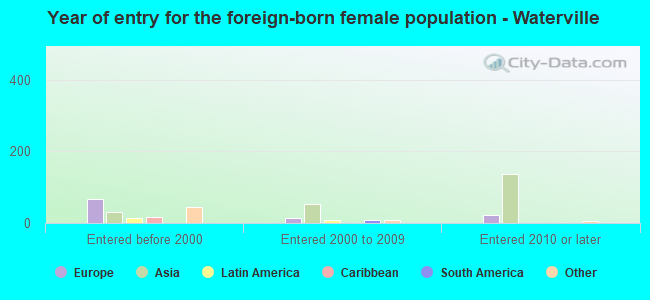
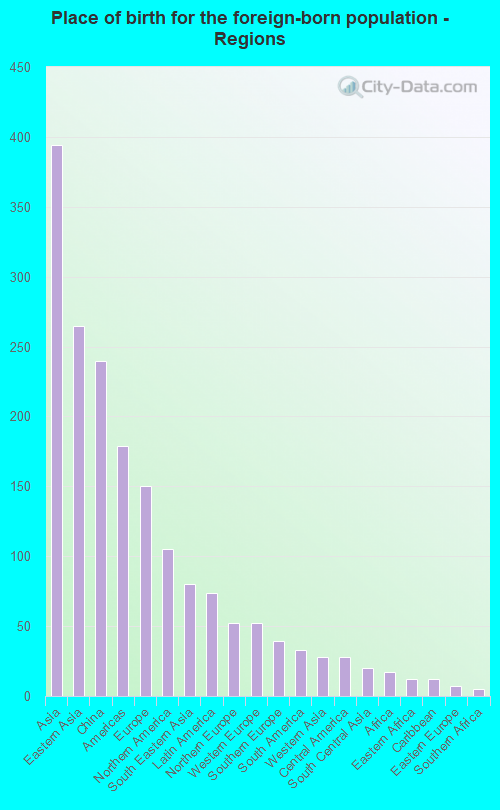
Foreign-born residents in Waterville 742 residents are foreign born (2.4% Asia , 0.9% Europe , 0.7% North America ).
Marital status for residents in Waterville Marital status - White (Caucasian) population 15 years and over
Males 42.5% Never married40.0% Now married0.4% Separated2.3% Widowed14.8% DivorcedFemales 39.1% Never married31.6% Now married2.1% Separated11.9% Widowed15.3% DivorcedWomen who gave birth in the past 12 months Now married:
40.8% (80)Unmarried:
59.2% (116)
Women who did not give birth in the past 12 months Now married:
25.2% (795)Unmarried:
74.8% (2,358)
Marital status - Black or African American population 15 years and over
Males 82.1% Never married17.9% Now married0.0% Separated0.0% Widowed0.0% DivorcedFemales 70.5% Never married11.4% Now married0.0% Separated0.0% Widowed18.1% DivorcedWomen who did not give birth in the past 12 months Now married:
14.0% (12)Unmarried:
86.0% (73)
Marital status - Asian population 15 years and over
Males 95.8% Never married4.2% Now married0.0% Separated0.0% Widowed0.0% DivorcedFemales 76.9% Never married17.2% Now married0.0% Separated5.9% Widowed0.0% DivorcedWomen who gave birth in the past 12 months Now married:
100.0% (11)Unmarried:
0.0% (0)
Women who did not give birth in the past 12 months Now married:
0.0% (0)Unmarried:
100.0% (172)
Marital status - Other race population 15 years and over
Males 55.3% Never married10.5% Now married0.0% Separated0.0% Widowed34.2% DivorcedFemales 60.5% Never married39.5% Now married0.0% Separated0.0% Widowed0.0% DivorcedWomen who did not give birth in the past 12 months Now married:
39.5% (20)Unmarried:
60.5% (30)
Marital status - Two or more races population 15 years and over
Males 44.8% Never married42.0% Now married0.0% Separated13.3% Widowed0.0% DivorcedFemales 58.8% Never married16.7% Now married6.8% Separated9.9% Widowed7.7% DivorcedWomen who gave birth in the past 12 months Now married:
100.0% (28)Unmarried:
0.0% (0)
Women who did not give birth in the past 12 months Now married:
0.0% (0)Unmarried:
100.0% (250)
Marital status - White alone, not Hispanic / Latino population 15 years and over
Males 42.0% Never married40.2% Now married0.4% Separated2.3% Widowed15.0% DivorcedFemales 39.2% Never married31.3% Now married2.1% Separated11.9% Widowed15.5% DivorcedWomen who gave birth in the past 12 months Now married:
40.8% (80)Unmarried:
59.2% (116)
Women who did not give birth in the past 12 months Now married:
24.5% (759)Unmarried:
75.5% (2,337)
Marital status - Hispanic or Latino population 15 years and over
Males 80.9% Never married9.9% Now married0.0% Separated0.0% Widowed9.2% DivorcedFemales 31.1% Never married59.4% Now married0.0% Separated9.4% Widowed0.0% DivorcedWomen who did not give birth in the past 12 months Now married:
62.5% (57)Unmarried:
37.5% (34)
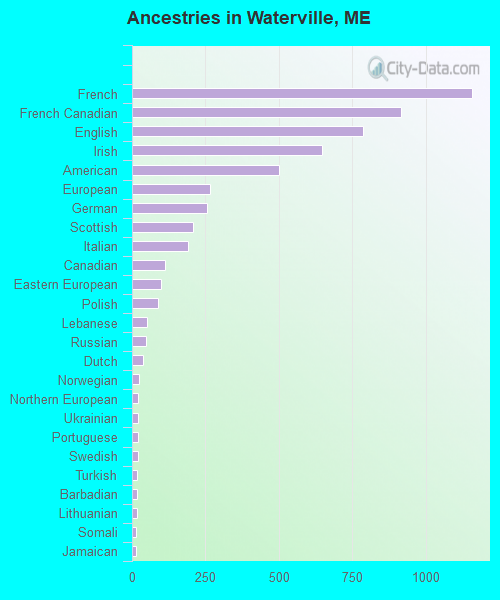
Ancestries in Waterville
1,157 17.4% French915 13.8% French Canadian787 11.8% English645 9.7% Irish501 7.5% American265 4.0% European255 3.8% German208 3.1% Scottish191 2.9% Italian112 1.7% Canadian98 1.5% Eastern European90 1.4% Polish50 0.8% Lebanese48 0.7% Russian37 0.6% Dutch25 0.4% Norwegian22 0.3% Northern European22 0.3% Ukrainian19 0.3% Portuguese19 0.3% Swedish18 0.3% Turkish17 0.3% Barbadian16 0.2% Lithuanian13 0.2% Somali12 0.2% Jamaican10 0.2% Finnish8 0.1% Welsh5 0.08% Scotch-Irish3 0.05% African
Children Nativity (place of birth) in Waterville
Children under 6 years - Living with two parents Both parents native 347 100.0% NativeOne native, one foreign-born parent 37 100.0% NativeChildren under 6 years - Living with one parent Native parent 550 100.0% NativeChildren 6 to 17 years - Living with two parents Both parents native 806 100.0% NativeBoth parents foreign-born 5 100.0% NativeOne native, one foreign-born parent 78 100.0% NativeChildren 6 to 17 years - Living with one parent Native parent 1,053 100.0% NativeForeign-born parent 17 55.7% Native14 44.3% Foreign-born
Grandparents responsible for own grandchildren in Waterville
Grandparents (30 to 59 years) White / Caucasian 84 41.9% Responsible for grandchildren117 58.1% Not responsible for grandchildrenWhite alone, not Hispanic / Latino 84 41.9% Responsible for grandchildren117 58.1% Not responsible for grandchildrenGrandparents (60 years and over) White / Caucasian 21 30.0% Responsible for grandchildren49 70.0% Not responsible for grandchildrenWhite alone, not Hispanic / Latino 21 29.8% Responsible for grandchildren49 70.2% Not responsible for grandchildren