Races in Waukee, Iowa (IA) Detailed Stats
Data:
Races - White alone (%)
Races - White alone (% change since 2000)
Races - Black alone (%)
Races - Black alone (% change since 2000)
Races - American Indian alone (%)
Races - American Indian alone (% change since 2000)
Races - Asian alone (%)
Races - Asian alone (% change since 2000)
Races - Hispanic (%)
Races - Hispanic (% change since 2000)
Races - Native Hawaiian and Other Pacific Islander alone (%)
Races - Native Hawaiian and Other Pacific Islander alone (% change since 2000)
Races - Two or more races(%)
Races - Two or more races(% change since 2000)
Races - Other race alone (%)
Races - Other race alone (% change since 2000)
Racial diversity
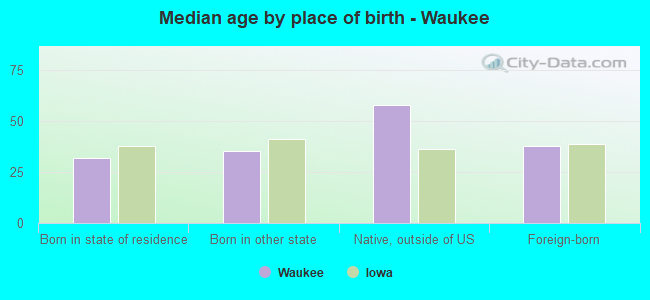
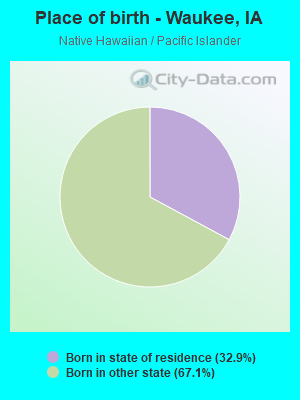
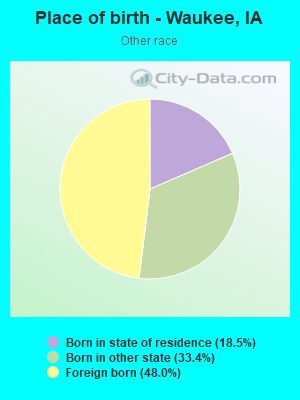
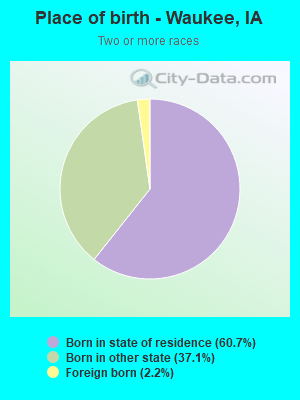
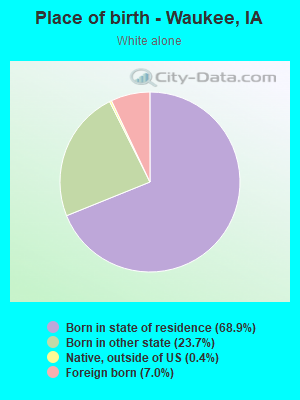
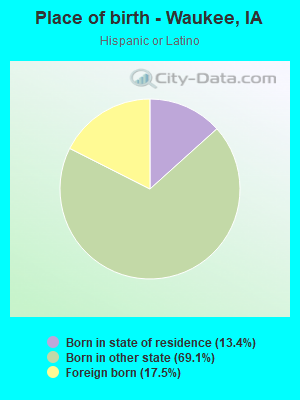
Place of birth - Born in state of residence (%)
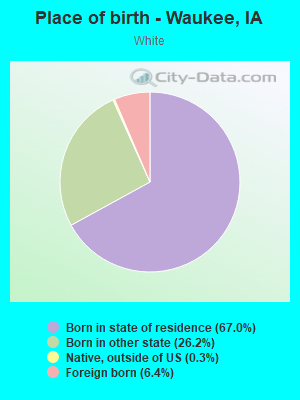
Place of birth - Born in state of residence (%) - White
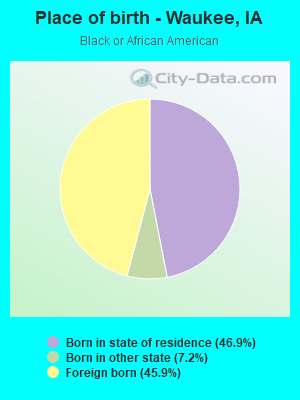
Place of birth - Born in state of residence (%) - Black or African American
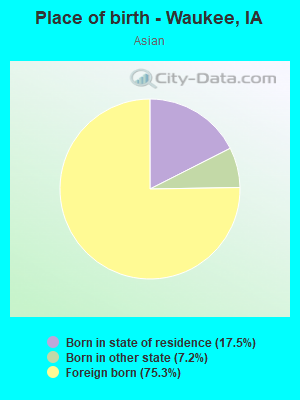
Place of birth - Born in state of residence (%) - Asian
Place of birth - Born in state of residence (%) - Hispanic or Latino
Place of birth - Born in state of residence (%) - American Indian and Alaska Native
Place of birth - Born in state of residence (%) - Multirace
Place of birth - Born in state of residence (%) - Other Race
Place of birth - Born in other state (%)
Place of birth - Born in other state (%) - White
Place of birth - Born in other state (%) - Black or African American
Place of birth - Born in other state (%) - Asian
Place of birth - Born in other state (%) - Hispanic or Latino
Place of birth - Born in other state (%) - American Indian and Alaska Native
Place of birth - Born in other state (%) - Multirace
Place of birth - Born in other state (%) - Other Race
Place of birth - Native, outside of US (%)
Place of birth - Native, outside of US (%) - White
Place of birth - Native, outside of US (%) - Black or African American
Place of birth - Native, outside of US (%) - Asian
Place of birth - Native, outside of US (%) - Hispanic or Latino
Place of birth - Native, outside of US (%) - American Indian and Alaska Native
Place of birth - Native, outside of US (%) - Multirace
Place of birth - Native, outside of US (%) - Other Race
Place of birth - Foreign born (%)
Place of birth - Foreign born (%) - White
Place of birth - Foreign born (%) - Black or African American
Place of birth - Foreign born (%) - Asian
Place of birth - Foreign born (%) - Hispanic or Latino
Place of birth - Foreign born (%) - American Indian and Alaska Native
Place of birth - Foreign born (%) - Multirace
Place of birth - Foreign born (%) - Other Race
Residents speaking English at home (%)
Residents speaking English at home - Born in the United States (%)
Residents speaking English at home - Native, born elsewhere (%)
Residents speaking English at home - Foreign born (%)
Residents speaking Spanish at home (%)
Residents speaking Spanish at home - Born in the United States (%)
Residents speaking Spanish at home - Native, born elsewhere (%)
Residents speaking Spanish at home - Foreign born (%)
Residents speaking other language at home (%)
Residents speaking other language at home - Born in the United States (%)
Residents speaking other language at home - Native, born elsewhere (%)
Residents speaking other language at home - Foreign born (%)
Marital status - Never married (%)
Marital status - Now married (%)
Marital status - Separated (%)
Marital status - Widowed (%)
Marital status - Divorced (%)
Ancestries Reported - Arab (%)
Ancestries Reported - Czech (%)
Ancestries Reported - Danish (%)
Ancestries Reported - Dutch (%)
Ancestries Reported - English (%)
Ancestries Reported - French (%)
Ancestries Reported - French Canadian (%)
Ancestries Reported - German (%)
Ancestries Reported - Greek (%)
Ancestries Reported - Hungarian (%)
Ancestries Reported - Irish (%)
Ancestries Reported - Italian (%)
Ancestries Reported - Lithuanian (%)
Ancestries Reported - Norwegian (%)
Ancestries Reported - Polish (%)
Ancestries Reported - Portuguese (%)
Ancestries Reported - Russian (%)
Ancestries Reported - Scotch-Irish (%)
Ancestries Reported - Scottish (%)
Ancestries Reported - Slovak (%)
Ancestries Reported - Subsaharan African (%)
Ancestries Reported - Swedish (%)
Ancestries Reported - Swiss (%)
Ancestries Reported - Ukrainian (%)
Ancestries Reported - United States (%)
Ancestries Reported - Welsh (%)
Ancestries Reported - West Indian (%)
Ancestries Reported - Other (%)
Geographical mobility - Same house 1 year ago (%)
Geographical mobility - Same house 1 year ago (%) - White
Geographical mobility - Same house 1 year ago (%) - Black or African American
Geographical mobility - Same house 1 year ago (%) - Asian
Geographical mobility - Same house 1 year ago (%) - Hispanic or Latino
Geographical mobility - Same house 1 year ago (%) - American Indian and Alaska Native
Geographical mobility - Same house 1 year ago (%) - Multirace
Geographical mobility - Same house 1 year ago (%) - Other Race
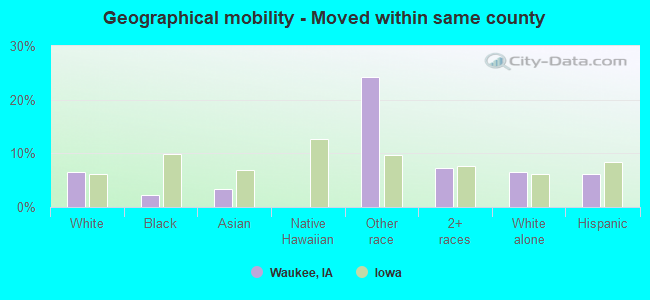
Geographical mobility - Moved within same county (%)
Geographical mobility - Moved within same county (%) - White
Geographical mobility - Moved within same county (%) - Black or African American
Geographical mobility - Moved within same county (%) - Asian
Geographical mobility - Moved within same county (%) - Hispanic or Latino
Geographical mobility - Moved within same county (%) - American Indian and Alaska Native
Geographical mobility - Moved within same county (%) - Multirace
Geographical mobility - Moved within same county (%) - Other Race
Geographical mobility - Moved from different county within same state (%)
Geographical mobility - Moved from different county within same state (%) - White
Geographical mobility - Moved from different county within same state (%) - Black or African American
Geographical mobility - Moved from different county within same state (%) - Asian
Geographical mobility - Moved from different county within same state (%) - Hispanic or Latino
Geographical mobility - Moved from different county within same state (%) - American Indian and Alaska Native
Geographical mobility - Moved from different county within same state (%) - Multirace
Geographical mobility - Moved from different county within same state (%) - Other Race
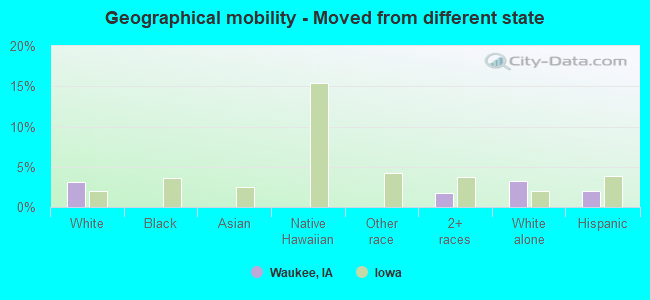
Geographical mobility - Moved from different state (%)
Geographical mobility - Moved from different state (%) - White
Geographical mobility - Moved from different state (%) - Black or African American
Geographical mobility - Moved from different state (%) - Asian
Geographical mobility - Moved from different state (%) - Hispanic or Latino
Geographical mobility - Moved from different state (%) - American Indian and Alaska Native
Geographical mobility - Moved from different state (%) - Multirace
Geographical mobility - Moved from different state (%) - Other Race
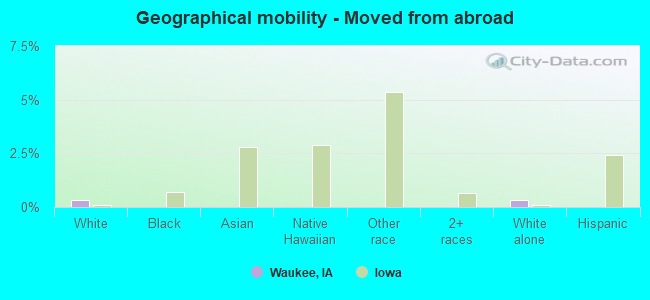
Geographical mobility - Moved from abroad (%)
Geographical mobility - Moved from abroad (%) - White
Geographical mobility - Moved from abroad (%) - Black or African American
Geographical mobility - Moved from abroad (%) - Asian
Geographical mobility - Moved from abroad (%) - Hispanic or Latino
Geographical mobility - Moved from abroad (%) - American Indian and Alaska Native
Geographical mobility - Moved from abroad (%) - Multirace
Geographical mobility - Moved from abroad (%) - Other Race
Place of birth for the foreign-born population - Ireland (%)
Place of birth for the foreign-born population - Denmark (%)
Place of birth for the foreign-born population - Norway (%)
Place of birth for the foreign-born population - Sweden (%)
Place of birth for the foreign-born population - United Kingdom (%)
Place of birth for the foreign-born population - England (%)
Place of birth for the foreign-born population - Scotland (%)
Place of birth for the foreign-born population - Other Northern Europe (%)
Place of birth for the foreign-born population - Austria (%)
Place of birth for the foreign-born population - Belgium (%)
Place of birth for the foreign-born population - France (%)
Place of birth for the foreign-born population - Germany (%)
Place of birth for the foreign-born population - Netherlands (%)
Place of birth for the foreign-born population - Switzerland (%)
Place of birth for the foreign-born population - Other Western Europe (%)
Place of birth for the foreign-born population - Greece (%)
Place of birth for the foreign-born population - Italy (%)
Place of birth for the foreign-born population - Portugal (%)
Place of birth for the foreign-born population - Spain (%)
Place of birth for the foreign-born population - Other Southern Europe (%)
Place of birth for the foreign-born population - Albania (%)
Place of birth for the foreign-born population - Belarus (%)
Place of birth for the foreign-born population - Bosnia and Herzegovina (%)
Place of birth for the foreign-born population - Bulgaria (%)
Place of birth for the foreign-born population - Croatia (%)
Place of birth for the foreign-born population - Czechoslovakia (%)
Place of birth for the foreign-born population - Hungary (%)
Place of birth for the foreign-born population - Latvia (%)
Place of birth for the foreign-born population - Lithuania (%)
Place of birth for the foreign-born population - North Macedonia (Macedonia) (%)
Place of birth for the foreign-born population - Moldova (%)
Place of birth for the foreign-born population - Poland (%)
Place of birth for the foreign-born population - Romania (%)
Place of birth for the foreign-born population - Russia (%)
Place of birth for the foreign-born population - Serbia (%)
Place of birth for the foreign-born population - Ukraine (%)
Place of birth for the foreign-born population - Other Eastern Europe (%)
Place of birth for the foreign-born population - China (%)
Place of birth for the foreign-born population - Hong Kong (%)
Place of birth for the foreign-born population - Taiwan (%)
Place of birth for the foreign-born population - Japan (%)
Place of birth for the foreign-born population - Korea (%)
Place of birth for the foreign-born population - Other Eastern Asia (%)
Place of birth for the foreign-born population - Afghanistan (%)
Place of birth for the foreign-born population - Bangladesh (%)
Place of birth for the foreign-born population - India (%)
Place of birth for the foreign-born population - Iran (%)
Place of birth for the foreign-born population - Kazakhstan (%)
Place of birth for the foreign-born population - Nepal (%)
Place of birth for the foreign-born population - Pakistan (%)
Place of birth for the foreign-born population - Sri Lanka (%)
Place of birth for the foreign-born population - Uzbekistan (%)
Place of birth for the foreign-born population - Other South Central Asia (%)
Place of birth for the foreign-born population - Burma (%)
Place of birth for the foreign-born population - Cambodia (%)
Place of birth for the foreign-born population - Indonesia (%)
Place of birth for the foreign-born population - Laos (%)
Place of birth for the foreign-born population - Malaysia (%)
Place of birth for the foreign-born population - Philippines (%)
Place of birth for the foreign-born population - Singapore (%)
Place of birth for the foreign-born population - Thailand (%)
Place of birth for the foreign-born population - Vietnam (%)
Place of birth for the foreign-born population - Other South Eastern Asia (%)
Place of birth for the foreign-born population - Armenia (%)
Place of birth for the foreign-born population - Iraq (%)
Place of birth for the foreign-born population - Israel (%)
Place of birth for the foreign-born population - Jordan (%)
Place of birth for the foreign-born population - Kuwait (%)
Place of birth for the foreign-born population - Lebanon (%)
Place of birth for the foreign-born population - Saudi Arabia (%)
Place of birth for the foreign-born population - Syria (%)
Place of birth for the foreign-born population - Turkey (%)
Place of birth for the foreign-born population - Yemen (%)
Place of birth for the foreign-born population - Other Western Asia (%)
Place of birth for the foreign-born population - Eritrea (%)
Place of birth for the foreign-born population - Ethiopia (%)
Place of birth for the foreign-born population - Kenya (%)
Place of birth for the foreign-born population - Somalia (%)
Place of birth for the foreign-born population - Uganda (%)
Place of birth for the foreign-born population - Zimbabwe (%)
Place of birth for the foreign-born population - Other Eastern Africa (%)
Place of birth for the foreign-born population - Cameroon (%)
Place of birth for the foreign-born population - Congo (%)
Place of birth for the foreign-born population - Democratic Republic of Congo (Zaire) (%)
Place of birth for the foreign-born population - Other Middle Africa (%)
Place of birth for the foreign-born population - Egypt (%)
Place of birth for the foreign-born population - Morocco (%)
Place of birth for the foreign-born population - Sudan (%)
Place of birth for the foreign-born population - Other Northern Africa (%)
Place of birth for the foreign-born population - South Africa (%)
Place of birth for the foreign-born population - Other Southern Africa (%)
Place of birth for the foreign-born population - Cabo Verde (%)
Place of birth for the foreign-born population - Ghana (%)
Place of birth for the foreign-born population - Liberia (%)
Place of birth for the foreign-born population - Nigeria (%)
Place of birth for the foreign-born population - Senegal (%)
Place of birth for the foreign-born population - Sierra Leone (%)
Place of birth for the foreign-born population - Other Western Africa (%)
Place of birth for the foreign-born population - Australia (%)
Place of birth for the foreign-born population - New Zealand (%)
Place of birth for the foreign-born population - Fiji (%)
Place of birth for the foreign-born population - Micronesia (%)
Place of birth for the foreign-born population - Bahamas (%)
Place of birth for the foreign-born population - Barbados (%)
Place of birth for the foreign-born population - Cuba (%)
Place of birth for the foreign-born population - Dominica (%)
Place of birth for the foreign-born population - Dominican Republic (%)
Place of birth for the foreign-born population - Grenada (%)
Place of birth for the foreign-born population - Haiti (%)
Place of birth for the foreign-born population - Jamaica (%)
Place of birth for the foreign-born population - St. Vincent and the Grenadines (%)
Place of birth for the foreign-born population - Trinidad and Tobago (%)
Place of birth for the foreign-born population - West Indies (%)
Place of birth for the foreign-born population - Other Caribbean (%)
Place of birth for the foreign-born population - Belize (%)
Place of birth for the foreign-born population - Costa Rica (%)
Place of birth for the foreign-born population - El Salvador (%)
Place of birth for the foreign-born population - Guatemala (%)
Place of birth for the foreign-born population - Honduras (%)
Place of birth for the foreign-born population - Mexico (%)
Place of birth for the foreign-born population - Nicaragua (%)
Place of birth for the foreign-born population - Panama (%)
Place of birth for the foreign-born population - Other Central America (%)
Place of birth for the foreign-born population - Argentina (%)
Place of birth for the foreign-born population - Bolivia (%)
Place of birth for the foreign-born population - Brazil (%)
Place of birth for the foreign-born population - Chile (%)
Place of birth for the foreign-born population - Colombia (%)
Place of birth for the foreign-born population - Ecuador (%)
Place of birth for the foreign-born population - Guyana (%)
Place of birth for the foreign-born population - Peru (%)
Place of birth for the foreign-born population - Uruguay (%)
Place of birth for the foreign-born population - Venezuela (%)
Place of birth for the foreign-born population - Other South America (%)
Place of birth for the foreign-born population - Canada (%)
Place of birth for the foreign-born population - Other Northern America (%)
Place of birth for the foreign-born population - Other (%)
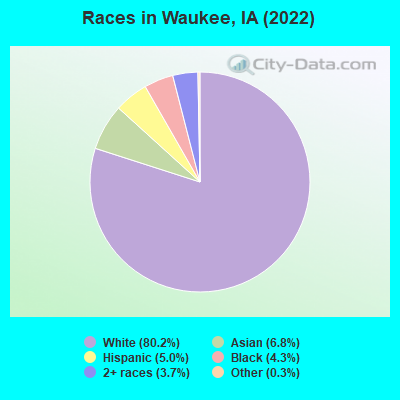
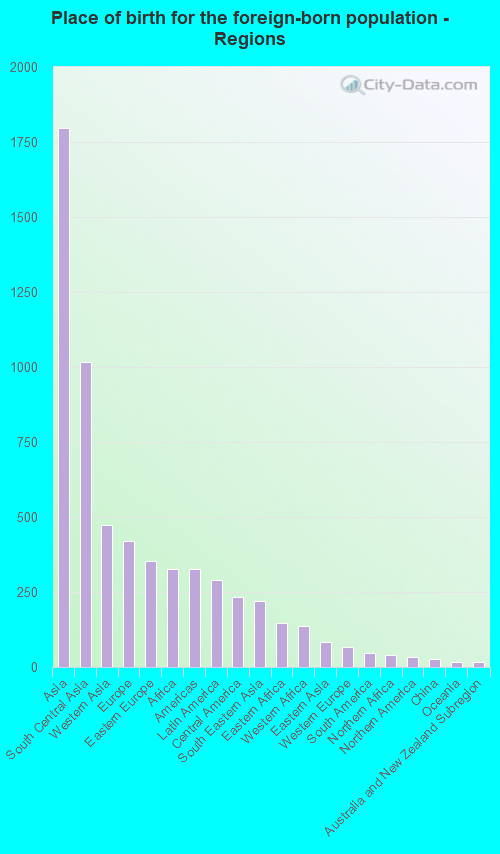
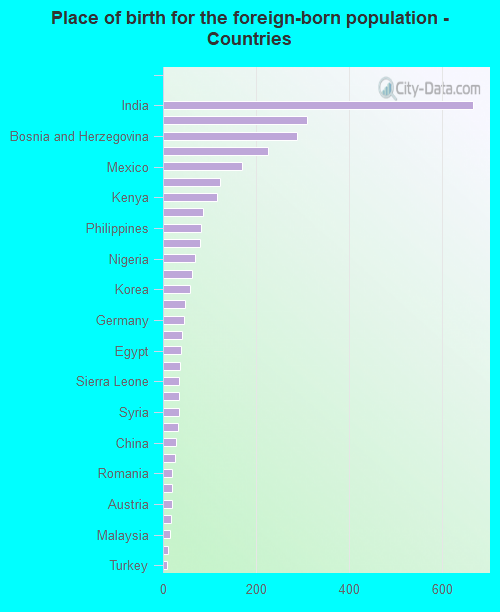
According to 2022 data, the most numerous races in Waukee, IA are White alone (21,623 residents), Hispanic (1,351 residents), and Black alone (1,160 residents). 85.2% of Waukee residents speak English at home. 10.7% of Waukee, IA residents are foreign-born (7.0% born in Asia, 1.6% born in Europe, 1.3% born in Africa, 1.1% born in Latin America), which is 53.4% greater than the foreign-born rate of 5.0% across the entire state of Iowa.
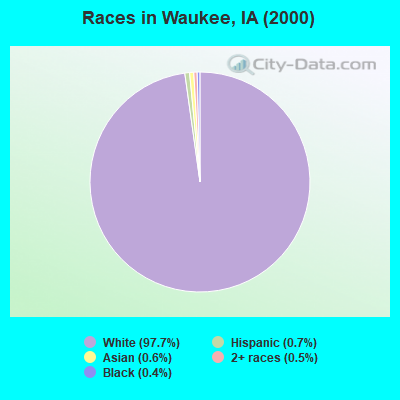
Race distribution in Waukee
2000 2022
2,710,344 92.6% White alone 82,473 2.8% Hispanic 60,744 2.1% Black alone 36,345 1.2% Asian alone 25,472 0.9% Two or more races 7,955 0.3% American Indian alone 2,103 0.07% Other race alone 888 0.03% Native Hawaiian and Other
2,650,110 82.8% White alone 218,024 6.8% Hispanic 119,004 3.7% Black alone 115,286 3.6% Two or more races 74,892 2.3% Asian alone 9,260 0.3% Other race alone 8,595 0.3% Native Hawaiian and Other 5,346 0.2% American Indian alone
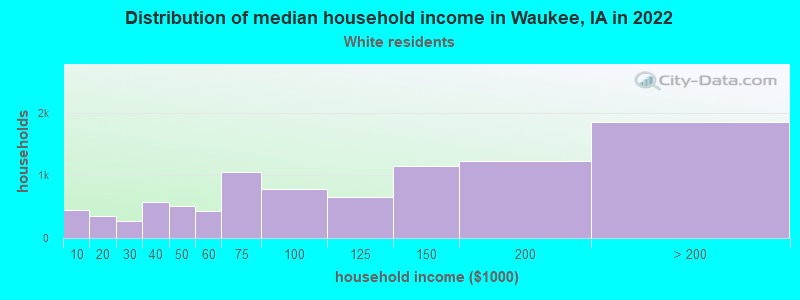
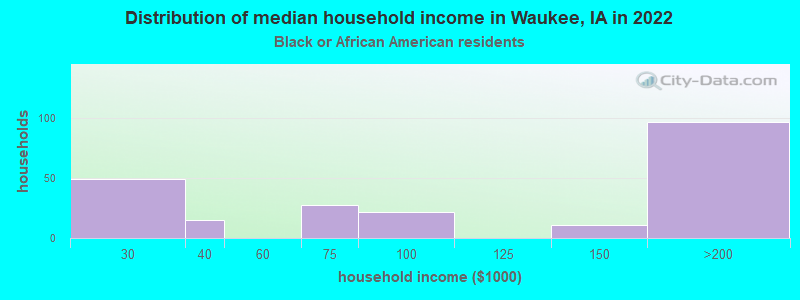
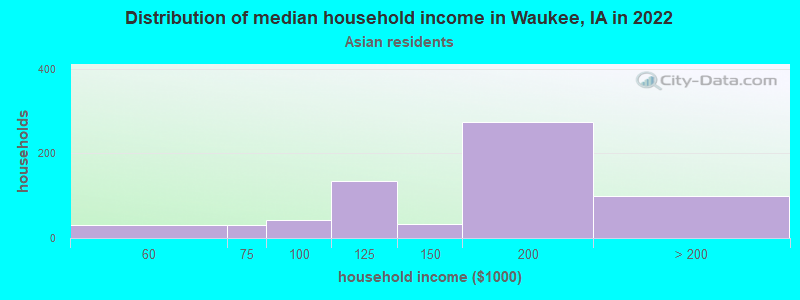
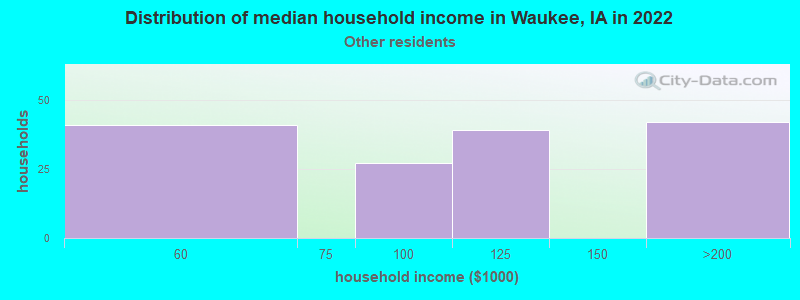
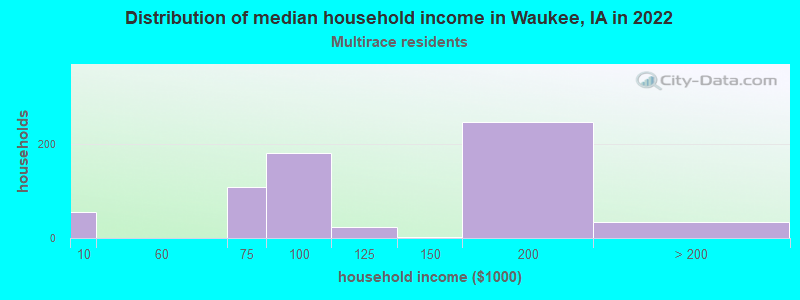
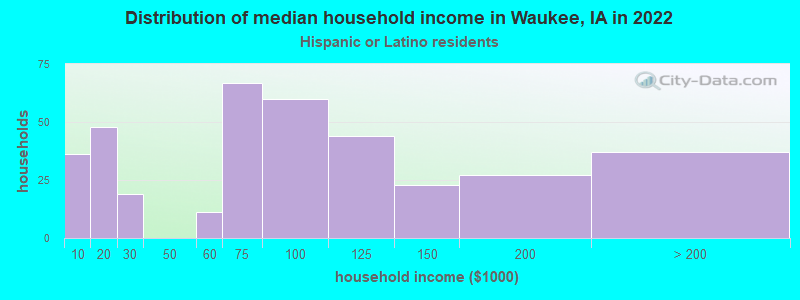
Income and house value in Waukee Median household income in 2022 $112,383 White non-Hispanic householders$170,290 Black householdersover $200,000 Asian householders$108,813 Two or more races householders$80,036 Hispanic or Latino race householdersMedian 2022 house value $383,055 White Non-Hispanic householders$189,055 Black or African American householdersover $1,000,000 Hispanic or Latino householders
Median age by race in Waukee
35.3 Median age for White residents34.0 37.2 37.0 Median age for Black or African American residents41.1 45.7 -664,734,298.9 Median age for American Indian / Alaska Native residents-668,621,700.2 -670,912,950.5 36.8 Median age for Asian residents33.6 38.5 29.0 Median age for Native Hawaiian / Pacific Islander residents-776,978,416.5 -504,347,825.6 45.3 Median age for Other race residents27.2 -1,037,037,036.0 14.6 Median age for Two or more races residents13.3 20.8 35.6 Median age for White alone residents35.1 37.5 26.9 Median age for Hispanic or Latino residents25.0 34.9
Owner/renter occupied households by race in Waukee
House owners and renters - White residents 6,617 71.3% Owner occupied2,669 28.7% Renter occupiedHouse owners and renters - Black or African American residents 257 71.2% Owner occupied104 28.8% Renter occupiedHouse owners and renters - Asian residents 625 88.6% Owner occupied81 11.4% Renter occupiedHouse owners and renters - Native Hawaiian / Pacific Islander residents 20 100.0% Owner occupiedHouse owners and renters - Other race residents 32 20.8% Owner occupied122 79.2% Renter occupiedHouse owners and renters - Two or more races residents 245 71.6% Owner occupied98 28.4% Renter occupiedHouse owners and renters - White alone residents 6,534 72.1% Owner occupied2,532 27.9% Renter occupiedHouse owners and renters - Hispanic or Latino residents 144 34.3% Owner occupied276 65.7% Renter occupied
Language usage in Waukee
English speakers - Total 85.2% of residents of Waukee speak English at home.
2.8% of residents speak Spanish at home 659 93.1% Speak English very well49 6.9% Speak English less than very well12.6% of residents speak other language at home 2,263 72.2% Speak English very well870 27.8% Speak English less than very well
English speakers - Born in the United States 91.6% of residents of Waukee speak English at home.
4.4% of residents speak Spanish at home 292 100.0% Speak English very well4.5% of residents speak other language at home 283 95.6% Speak English very well13 4.4% Speak English less than very well
All residents speak only English at home
English speakers - Foreign-born 13.8% of residents of Waukee speak English at home.
12.7% of residents speak Spanish at home 392 89.5% Speak English very well46 10.5% Speak English less than very well76.0% of residents speak other language at home 1,816 69.0% Speak English very well815 31.0% Speak English less than very well
White (Caucasian) - Speak only English Native:
98.2% (19,091)Foreign-born:
12.2% (177)
White (Caucasian) - Speak another language Native:
1.9% (375)Foreign-born:
87.9% (1,279)
Black or African American - Speak only English Native:
100.0% (509)Foreign-born:
17.1% (52)
Asian - Speak only English Native:
68.5% (276)Foreign-born:
13.6% (178)
Asian - Speak another language Native:
31.4% (127)Foreign-born:
78.8% (1,028)
Other race - Speak only English Native:
100.0% (195)Foreign-born:
27.4% (52)
Two or more races - Speak another language Native:
24.2% (312)Foreign-born:
97.8% (75)
White alone - Speak only English Native:
98.5% (18,440)Foreign-born:
11.5% (177)
White alone - Speak another language Native:
1.5% (274)Foreign-born:
89.3% (1,376)
Hispanic or Latino - Speak only English Native:
78.3% (791)Foreign-born:
12.8% (35)
Hispanic or Latino - Speak another language Native:
25.4% (257)Foreign-born:
90.1% (246)
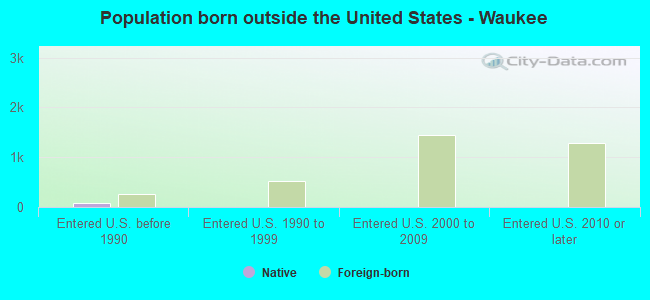
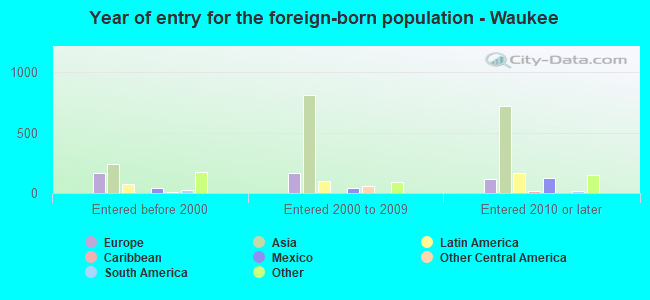
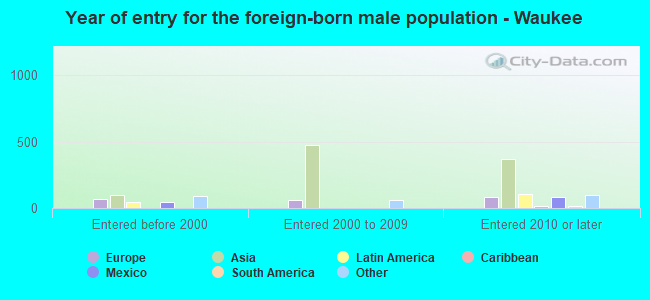
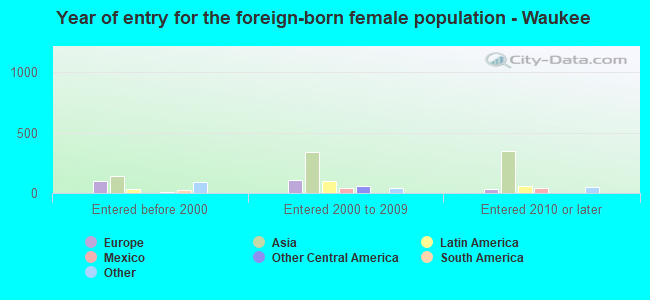
Foreign-born residents in Waukee 2,890 residents are foreign born (7.0% Asia , 1.6% Europe , 1.3% Africa , 1.1% Latin America ).
Marital status for residents in Waukee Marital status - White (Caucasian) population 15 years and over
Males 29.9% Never married59.8% Now married2.2% Separated1.1% Widowed7.0% DivorcedFemales 24.6% Never married56.3% Now married0.3% Separated6.4% Widowed12.3% DivorcedWomen who gave birth in the past 12 months Now married:
91.0% (340)Unmarried:
9.0% (34)
Women who did not give birth in the past 12 months Now married:
55.5% (3,016)Unmarried:
44.5% (2,420)
Marital status - Black or African American population 15 years and over
Males 16.0% Never married73.2% Now married0.0% Separated0.0% Widowed10.8% DivorcedFemales 39.4% Never married39.4% Now married6.8% Separated0.0% Widowed14.5% DivorcedWomen who gave birth in the past 12 months Now married:
100.0% (11)Unmarried:
0.0% (0)
Women who did not give birth in the past 12 months Now married:
51.1% (89)Unmarried:
48.9% (85)
Marital status - Asian population 15 years and over
Males 30.3% Never married69.7% Now married0.0% Separated0.0% Widowed0.0% DivorcedFemales 17.6% Never married78.5% Now married0.0% Separated0.0% Widowed3.9% DivorcedWomen who gave birth in the past 12 months Now married:
0.0% (0)Unmarried:
100.0% (11)
Women who did not give birth in the past 12 months Now married:
72.5% (313)Unmarried:
27.5% (119)
Marital status - Native Hawaiian / Pacific Islander population 15 years and over
Males 100.0% Never married0.0% Now married0.0% Separated0.0% Widowed0.0% DivorcedFemales 0.0% Never married0.0% Now married0.0% Separated0.0% Widowed100.0% DivorcedWomen who gave birth in the past 12 months Now married:
0.0% (0)Unmarried:
100.0% (21)
Marital status - Other race population 15 years and over
Males 57.4% Never married42.6% Now married0.0% Separated0.0% Widowed0.0% DivorcedFemales 40.5% Never married59.5% Now married0.0% Separated0.0% Widowed0.0% DivorcedWomen who did not give birth in the past 12 months Now married:
59.5% (28)Unmarried:
40.5% (19)
Marital status - Two or more races population 15 years and over
Males 31.4% Never married60.4% Now married0.0% Separated0.0% Widowed8.2% DivorcedFemales 33.7% Never married66.3% Now married0.0% Separated0.0% Widowed0.0% DivorcedWomen who gave birth in the past 12 months Now married:
100.0% (139)Unmarried:
0.0% (0)
Women who did not give birth in the past 12 months Now married:
54.4% (196)Unmarried:
45.6% (164)
Marital status - White alone, not Hispanic / Latino population 15 years and over
Males 29.7% Never married60.1% Now married1.9% Separated1.1% Widowed7.2% DivorcedFemales 24.0% Never married56.6% Now married0.3% Separated6.5% Widowed12.6% DivorcedWomen who gave birth in the past 12 months Now married:
100.0% (340)Unmarried:
0.0% (0)
Women who did not give birth in the past 12 months Now married:
55.6% (2,961)Unmarried:
44.4% (2,363)
Marital status - Hispanic or Latino population 15 years and over
Males 41.1% Never married47.7% Now married5.5% Separated0.0% Widowed5.7% DivorcedFemales 50.0% Never married45.2% Now married0.0% Separated0.0% Widowed4.8% DivorcedWomen who gave birth in the past 12 months Now married:
0.0% (0)Unmarried:
100.0% (48)
Women who did not give birth in the past 12 months Now married:
53.3% (115)Unmarried:
46.7% (101)
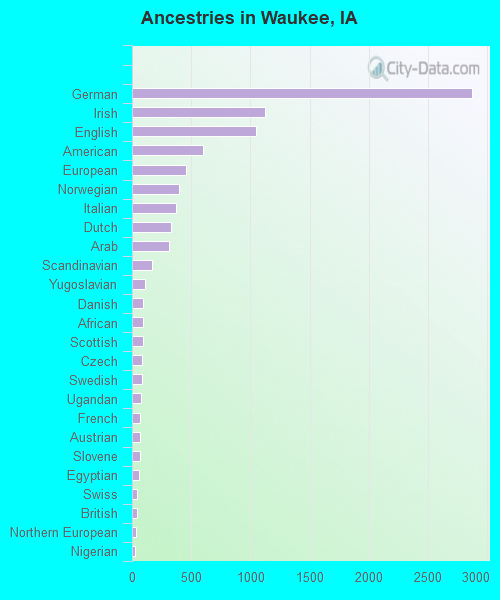
Ancestries in Waukee
2,873 22.9% German1,128 9.0% Irish1,044 8.3% English602 4.8% American458 3.7% European393 3.1% Norwegian371 3.0% Italian332 2.6% Dutch313 2.5% Arab168 1.3% Scandinavian110 0.9% Yugoslavian97 0.8% Danish96 0.8% African94 0.7% Scottish81 0.6% Czech81 0.6% Swedish78 0.6% Ugandan71 0.6% French69 0.6% Austrian67 0.5% Slovene57 0.5% Egyptian44 0.4% Swiss39 0.3% British30 0.2% Northern European28 0.2% Nigerian26 0.2% Romanian25 0.2% Slavic24 0.2% Turkish19 0.2% Polish17 0.1% Kenyan16 0.1% Russian15 0.1% French Canadian12 0.10% Belgian10 0.08% Croatian10 0.08% Scotch-Irish2 0.02% Brazilian
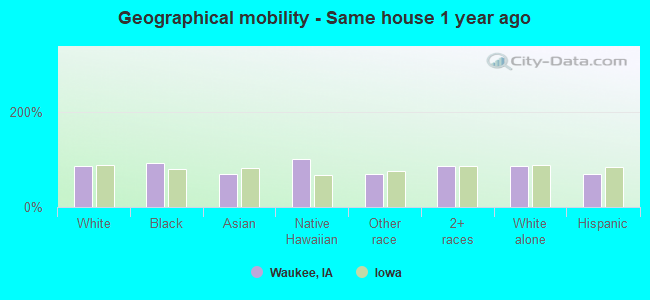
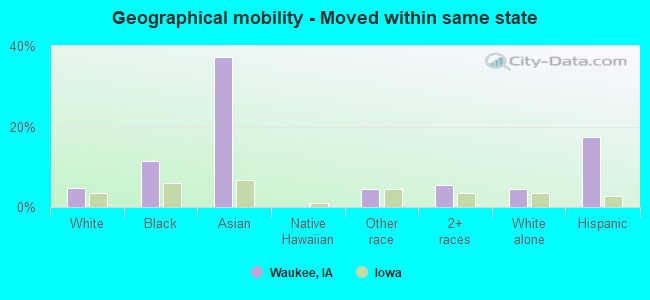
Geographical mobility in Waukee Same house 1 year ago 18,844 85.4% White (Caucasian)790 93.0% Black or African American1,089 70.2% Asian19 100.0% Native Hawaiian / Pacific Islander265 69.7% Other race1,402 84.9% Two or more races18,236 85.7% White alone, not Hispanic / Latino823 69.2% Hispanic or LatinoMoved within same county 1,446 6.6% White / Caucasian19 2.3% Black or African American53 3.4% Asian92 24.3% Other race120 7.2% Two or more races1,379 6.5% White alone, not Hispanic / Latino73 6.1% Hispanic or LatinoMoved within same state 1,047 4.7% White / Caucasian98 11.5% Black or African American577 37.2% Asian17 4.4% Other race91 5.5% Two or more races963 4.5% White alone, not Hispanic / Latino206 17.3% Hispanic or LatinoMoved from different state 682 3.1% White / Caucasian29 1.7% Two or more races700 3.3% White alone, not Hispanic / Latino23 1.9% Hispanic or LatinoMoved from abroad 73 0.3% White73 0.3% White alone, not Hispanic / Latino
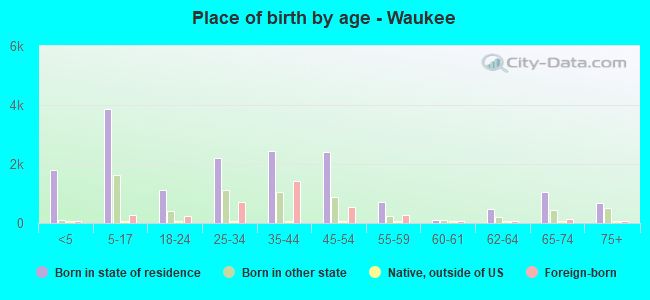
Children Nativity (place of birth) in Waukee
Children under 6 years - Living with two parents Both parents native 1,456 100.0% NativeBoth parents foreign-born 463 93.1% Native35 6.9% Foreign-bornOne native, one foreign-born parent 41 100.0% NativeChildren under 6 years - Living with one parent Native parent 196 100.0% NativeForeign-born parent 93 100.0% NativeChildren 6 to 17 years - Living with two parents Both parents native 3,060 100.0% NativeBoth parents foreign-born 438 65.2% Native234 34.8% Foreign-bornOne native, one foreign-born parent 79 100.0% NativeChildren 6 to 17 years - Living with one parent Native parent 1,308 100.0% NativeForeign-born parent 261 48.6% Native276 51.4% Foreign-born
Grandparents responsible for own grandchildren in Waukee
Grandparents (30 to 59 years) White / Caucasian 28 100.0% Responsible for grandchildrenWhite alone, not Hispanic / Latino 28 100.0% Responsible for grandchildren
Grandparents (60 years and over) White / Caucasian 44 100.0% Not responsible for grandchildrenWhite alone, not Hispanic / Latino 46 100.0% Not responsible for grandchildren