Races in Waukesha, Wisconsin (WI) Detailed Stats
Data:
Races - White alone (%)
Races - White alone (% change since 2000)
Races - Black alone (%)
Races - Black alone (% change since 2000)
Races - American Indian alone (%)
Races - American Indian alone (% change since 2000)
Races - Asian alone (%)
Races - Asian alone (% change since 2000)
Races - Hispanic (%)
Races - Hispanic (% change since 2000)
Races - Native Hawaiian and Other Pacific Islander alone (%)
Races - Native Hawaiian and Other Pacific Islander alone (% change since 2000)
Races - Two or more races(%)
Races - Two or more races(% change since 2000)
Races - Other race alone (%)
Races - Other race alone (% change since 2000)
Racial diversity
Place of birth - Born in state of residence (%)
Place of birth - Born in state of residence (%) - White
Place of birth - Born in state of residence (%) - Black or African American
Place of birth - Born in state of residence (%) - Asian
Place of birth - Born in state of residence (%) - Hispanic or Latino
Place of birth - Born in state of residence (%) - American Indian and Alaska Native
Place of birth - Born in state of residence (%) - Multirace
Place of birth - Born in state of residence (%) - Other Race
Place of birth - Born in other state (%)
Place of birth - Born in other state (%) - White
Place of birth - Born in other state (%) - Black or African American
Place of birth - Born in other state (%) - Asian
Place of birth - Born in other state (%) - Hispanic or Latino
Place of birth - Born in other state (%) - American Indian and Alaska Native
Place of birth - Born in other state (%) - Multirace
Place of birth - Born in other state (%) - Other Race
Place of birth - Native, outside of US (%)
Place of birth - Native, outside of US (%) - White
Place of birth - Native, outside of US (%) - Black or African American
Place of birth - Native, outside of US (%) - Asian
Place of birth - Native, outside of US (%) - Hispanic or Latino
Place of birth - Native, outside of US (%) - American Indian and Alaska Native
Place of birth - Native, outside of US (%) - Multirace
Place of birth - Native, outside of US (%) - Other Race
Place of birth - Foreign born (%)
Place of birth - Foreign born (%) - White
Place of birth - Foreign born (%) - Black or African American
Place of birth - Foreign born (%) - Asian
Place of birth - Foreign born (%) - Hispanic or Latino
Place of birth - Foreign born (%) - American Indian and Alaska Native
Place of birth - Foreign born (%) - Multirace
Place of birth - Foreign born (%) - Other Race
Residents speaking English at home (%)
Residents speaking English at home - Born in the United States (%)
Residents speaking English at home - Native, born elsewhere (%)
Residents speaking English at home - Foreign born (%)
Residents speaking Spanish at home (%)
Residents speaking Spanish at home - Born in the United States (%)
Residents speaking Spanish at home - Native, born elsewhere (%)
Residents speaking Spanish at home - Foreign born (%)
Residents speaking other language at home (%)
Residents speaking other language at home - Born in the United States (%)
Residents speaking other language at home - Native, born elsewhere (%)
Residents speaking other language at home - Foreign born (%)
Marital status - Never married (%)
Marital status - Now married (%)
Marital status - Separated (%)
Marital status - Widowed (%)
Marital status - Divorced (%)
Ancestries Reported - Arab (%)
Ancestries Reported - Czech (%)
Ancestries Reported - Danish (%)
Ancestries Reported - Dutch (%)
Ancestries Reported - English (%)
Ancestries Reported - French (%)
Ancestries Reported - French Canadian (%)
Ancestries Reported - German (%)
Ancestries Reported - Greek (%)
Ancestries Reported - Hungarian (%)
Ancestries Reported - Irish (%)
Ancestries Reported - Italian (%)
Ancestries Reported - Lithuanian (%)
Ancestries Reported - Norwegian (%)
Ancestries Reported - Polish (%)
Ancestries Reported - Portuguese (%)
Ancestries Reported - Russian (%)
Ancestries Reported - Scotch-Irish (%)
Ancestries Reported - Scottish (%)
Ancestries Reported - Slovak (%)
Ancestries Reported - Subsaharan African (%)
Ancestries Reported - Swedish (%)
Ancestries Reported - Swiss (%)
Ancestries Reported - Ukrainian (%)
Ancestries Reported - United States (%)
Ancestries Reported - Welsh (%)
Ancestries Reported - West Indian (%)
Ancestries Reported - Other (%)
Geographical mobility - Same house 1 year ago (%)
Geographical mobility - Same house 1 year ago (%) - White
Geographical mobility - Same house 1 year ago (%) - Black or African American
Geographical mobility - Same house 1 year ago (%) - Asian
Geographical mobility - Same house 1 year ago (%) - Hispanic or Latino
Geographical mobility - Same house 1 year ago (%) - American Indian and Alaska Native
Geographical mobility - Same house 1 year ago (%) - Multirace
Geographical mobility - Same house 1 year ago (%) - Other Race
Geographical mobility - Moved within same county (%)
Geographical mobility - Moved within same county (%) - White
Geographical mobility - Moved within same county (%) - Black or African American
Geographical mobility - Moved within same county (%) - Asian
Geographical mobility - Moved within same county (%) - Hispanic or Latino
Geographical mobility - Moved within same county (%) - American Indian and Alaska Native
Geographical mobility - Moved within same county (%) - Multirace
Geographical mobility - Moved within same county (%) - Other Race
Geographical mobility - Moved from different county within same state (%)
Geographical mobility - Moved from different county within same state (%) - White
Geographical mobility - Moved from different county within same state (%) - Black or African American
Geographical mobility - Moved from different county within same state (%) - Asian
Geographical mobility - Moved from different county within same state (%) - Hispanic or Latino
Geographical mobility - Moved from different county within same state (%) - American Indian and Alaska Native
Geographical mobility - Moved from different county within same state (%) - Multirace
Geographical mobility - Moved from different county within same state (%) - Other Race
Geographical mobility - Moved from different state (%)
Geographical mobility - Moved from different state (%) - White
Geographical mobility - Moved from different state (%) - Black or African American
Geographical mobility - Moved from different state (%) - Asian
Geographical mobility - Moved from different state (%) - Hispanic or Latino
Geographical mobility - Moved from different state (%) - American Indian and Alaska Native
Geographical mobility - Moved from different state (%) - Multirace
Geographical mobility - Moved from different state (%) - Other Race
Geographical mobility - Moved from abroad (%)
Geographical mobility - Moved from abroad (%) - White
Geographical mobility - Moved from abroad (%) - Black or African American
Geographical mobility - Moved from abroad (%) - Asian
Geographical mobility - Moved from abroad (%) - Hispanic or Latino
Geographical mobility - Moved from abroad (%) - American Indian and Alaska Native
Geographical mobility - Moved from abroad (%) - Multirace
Geographical mobility - Moved from abroad (%) - Other Race
Place of birth for the foreign-born population - Ireland (%)
Place of birth for the foreign-born population - Denmark (%)
Place of birth for the foreign-born population - Norway (%)
Place of birth for the foreign-born population - Sweden (%)
Place of birth for the foreign-born population - United Kingdom (%)
Place of birth for the foreign-born population - England (%)
Place of birth for the foreign-born population - Scotland (%)
Place of birth for the foreign-born population - Other Northern Europe (%)
Place of birth for the foreign-born population - Austria (%)
Place of birth for the foreign-born population - Belgium (%)
Place of birth for the foreign-born population - France (%)
Place of birth for the foreign-born population - Germany (%)
Place of birth for the foreign-born population - Netherlands (%)
Place of birth for the foreign-born population - Switzerland (%)
Place of birth for the foreign-born population - Other Western Europe (%)
Place of birth for the foreign-born population - Greece (%)
Place of birth for the foreign-born population - Italy (%)
Place of birth for the foreign-born population - Portugal (%)
Place of birth for the foreign-born population - Spain (%)
Place of birth for the foreign-born population - Other Southern Europe (%)
Place of birth for the foreign-born population - Albania (%)
Place of birth for the foreign-born population - Belarus (%)
Place of birth for the foreign-born population - Bosnia and Herzegovina (%)
Place of birth for the foreign-born population - Bulgaria (%)
Place of birth for the foreign-born population - Croatia (%)
Place of birth for the foreign-born population - Czechoslovakia (%)
Place of birth for the foreign-born population - Hungary (%)
Place of birth for the foreign-born population - Latvia (%)
Place of birth for the foreign-born population - Lithuania (%)
Place of birth for the foreign-born population - North Macedonia (Macedonia) (%)
Place of birth for the foreign-born population - Moldova (%)
Place of birth for the foreign-born population - Poland (%)
Place of birth for the foreign-born population - Romania (%)
Place of birth for the foreign-born population - Russia (%)
Place of birth for the foreign-born population - Serbia (%)
Place of birth for the foreign-born population - Ukraine (%)
Place of birth for the foreign-born population - Other Eastern Europe (%)
Place of birth for the foreign-born population - China (%)
Place of birth for the foreign-born population - Hong Kong (%)
Place of birth for the foreign-born population - Taiwan (%)
Place of birth for the foreign-born population - Japan (%)
Place of birth for the foreign-born population - Korea (%)
Place of birth for the foreign-born population - Other Eastern Asia (%)
Place of birth for the foreign-born population - Afghanistan (%)
Place of birth for the foreign-born population - Bangladesh (%)
Place of birth for the foreign-born population - India (%)
Place of birth for the foreign-born population - Iran (%)
Place of birth for the foreign-born population - Kazakhstan (%)
Place of birth for the foreign-born population - Nepal (%)
Place of birth for the foreign-born population - Pakistan (%)
Place of birth for the foreign-born population - Sri Lanka (%)
Place of birth for the foreign-born population - Uzbekistan (%)
Place of birth for the foreign-born population - Other South Central Asia (%)
Place of birth for the foreign-born population - Burma (%)
Place of birth for the foreign-born population - Cambodia (%)
Place of birth for the foreign-born population - Indonesia (%)
Place of birth for the foreign-born population - Laos (%)
Place of birth for the foreign-born population - Malaysia (%)
Place of birth for the foreign-born population - Philippines (%)
Place of birth for the foreign-born population - Singapore (%)
Place of birth for the foreign-born population - Thailand (%)
Place of birth for the foreign-born population - Vietnam (%)
Place of birth for the foreign-born population - Other South Eastern Asia (%)
Place of birth for the foreign-born population - Armenia (%)
Place of birth for the foreign-born population - Iraq (%)
Place of birth for the foreign-born population - Israel (%)
Place of birth for the foreign-born population - Jordan (%)
Place of birth for the foreign-born population - Kuwait (%)
Place of birth for the foreign-born population - Lebanon (%)
Place of birth for the foreign-born population - Saudi Arabia (%)
Place of birth for the foreign-born population - Syria (%)
Place of birth for the foreign-born population - Turkey (%)
Place of birth for the foreign-born population - Yemen (%)
Place of birth for the foreign-born population - Other Western Asia (%)
Place of birth for the foreign-born population - Eritrea (%)
Place of birth for the foreign-born population - Ethiopia (%)
Place of birth for the foreign-born population - Kenya (%)
Place of birth for the foreign-born population - Somalia (%)
Place of birth for the foreign-born population - Uganda (%)
Place of birth for the foreign-born population - Zimbabwe (%)
Place of birth for the foreign-born population - Other Eastern Africa (%)
Place of birth for the foreign-born population - Cameroon (%)
Place of birth for the foreign-born population - Congo (%)
Place of birth for the foreign-born population - Democratic Republic of Congo (Zaire) (%)
Place of birth for the foreign-born population - Other Middle Africa (%)
Place of birth for the foreign-born population - Egypt (%)
Place of birth for the foreign-born population - Morocco (%)
Place of birth for the foreign-born population - Sudan (%)
Place of birth for the foreign-born population - Other Northern Africa (%)
Place of birth for the foreign-born population - South Africa (%)
Place of birth for the foreign-born population - Other Southern Africa (%)
Place of birth for the foreign-born population - Cabo Verde (%)
Place of birth for the foreign-born population - Ghana (%)
Place of birth for the foreign-born population - Liberia (%)
Place of birth for the foreign-born population - Nigeria (%)
Place of birth for the foreign-born population - Senegal (%)
Place of birth for the foreign-born population - Sierra Leone (%)
Place of birth for the foreign-born population - Other Western Africa (%)
Place of birth for the foreign-born population - Australia (%)
Place of birth for the foreign-born population - New Zealand (%)
Place of birth for the foreign-born population - Fiji (%)
Place of birth for the foreign-born population - Micronesia (%)
Place of birth for the foreign-born population - Bahamas (%)
Place of birth for the foreign-born population - Barbados (%)
Place of birth for the foreign-born population - Cuba (%)
Place of birth for the foreign-born population - Dominica (%)
Place of birth for the foreign-born population - Dominican Republic (%)
Place of birth for the foreign-born population - Grenada (%)
Place of birth for the foreign-born population - Haiti (%)
Place of birth for the foreign-born population - Jamaica (%)
Place of birth for the foreign-born population - St. Vincent and the Grenadines (%)
Place of birth for the foreign-born population - Trinidad and Tobago (%)
Place of birth for the foreign-born population - West Indies (%)
Place of birth for the foreign-born population - Other Caribbean (%)
Place of birth for the foreign-born population - Belize (%)
Place of birth for the foreign-born population - Costa Rica (%)
Place of birth for the foreign-born population - El Salvador (%)
Place of birth for the foreign-born population - Guatemala (%)
Place of birth for the foreign-born population - Honduras (%)
Place of birth for the foreign-born population - Mexico (%)
Place of birth for the foreign-born population - Nicaragua (%)
Place of birth for the foreign-born population - Panama (%)
Place of birth for the foreign-born population - Other Central America (%)
Place of birth for the foreign-born population - Argentina (%)
Place of birth for the foreign-born population - Bolivia (%)
Place of birth for the foreign-born population - Brazil (%)
Place of birth for the foreign-born population - Chile (%)
Place of birth for the foreign-born population - Colombia (%)
Place of birth for the foreign-born population - Ecuador (%)
Place of birth for the foreign-born population - Guyana (%)
Place of birth for the foreign-born population - Peru (%)
Place of birth for the foreign-born population - Uruguay (%)
Place of birth for the foreign-born population - Venezuela (%)
Place of birth for the foreign-born population - Other South America (%)
Place of birth for the foreign-born population - Canada (%)
Place of birth for the foreign-born population - Other Northern America (%)
Place of birth for the foreign-born population - Other (%)
Latest news about races in Waukesha, WI collected exclusively by city-data.com from local newspapers, TV, and radio stations
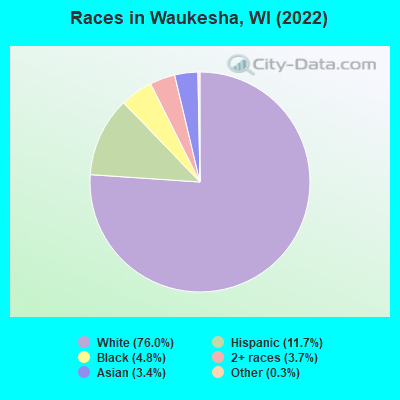
According to 2022 data, the most numerous races in Waukesha, WI are White alone (53,558 residents), Hispanic (8,253 residents), and Black alone (3,395 residents). 90.9% of Waukesha residents speak English at home. 7.2% of Waukesha, WI residents are foreign-born (4.0% born in Latin America, 2.1% born in Asia, 0.9% born in Europe), which is 30.7% greater than the foreign-born rate of 5.0% across the entire state of Wisconsin.
Race distribution in Waukesha
2000 2022
4,681,630 87.3% White alone 300,245 5.6% Black alone 192,921 3.6% Hispanic 87,995 1.6% Asian alone 51,921 1.0% Two or more races 43,980 0.8% American Indian alone 3,637 0.07% Other race alone 1,346 0.03% Native Hawaiian and Other
4,654,031 79.0% White alone 447,022 7.6% Hispanic 345,678 5.9% Black alone 217,532 3.7% Two or more races 172,242 2.9% Asian alone 33,762 0.6% American Indian alone 19,680 0.3% Other race alone 2,592 0.04% Native Hawaiian and Other
Income and house value in Waukesha Median household income in 2022 $78,295 White non-Hispanic householders$21,908 Black householders$145,784 Asian householders$62,153 Some other race householders$47,431 Two or more races householders$61,367 Hispanic or Latino race householdersMedian 2022 house value $306,189 White Non-Hispanic householders$329,574 Black or African American householders$297,010 American Indian or Alaska Native householders $405,848 Asian householders$253,737 Some other race householders$282,367 Two or more races householders$253,737 Hispanic or Latino householders
Median age by race in Waukesha
41.6 Median age for White residents39.1 42.9 16.5 Median age for Black or African American residents15.6 27.1 -666,666,666.0 Median age for American Indian / Alaska Native residents-666,666,666.0 -666,666,666.0 37.6 Median age for Asian residents28.9 38.7 -666,666,666.0 Median age for Native Hawaiian / Pacific Islander residents-666,666,666.0 -666,666,666.0 34.2 Median age for Other race residents34.6 29.6 22.3 Median age for Two or more races residents10.9 26.0 42.4 Median age for White alone residents39.9 43.1 28.3 Median age for Hispanic or Latino residents26.5 29.2
Owner/renter occupied households by race in Waukesha
House owners and renters - White residents 17,359 65.2% Owner occupied9,262 34.8% Renter occupiedHouse owners and renters - Black or African American residents 154 15.1% Owner occupied863 84.9% Renter occupiedHouse owners and renters - American Indian / Alaska Native residents 42 97.9% Owner occupied1 2.1% Renter occupiedHouse owners and renters - Asian residents 687 84.9% Owner occupied122 15.1% Renter occupiedHouse owners and renters - Other race residents 602 54.7% Owner occupied499 45.3% Renter occupiedHouse owners and renters - Two or more races residents 371 28.8% Owner occupied919 71.2% Renter occupiedHouse owners and renters - White alone residents 16,756 65.7% Owner occupied8,763 34.3% Renter occupiedHouse owners and renters - Hispanic or Latino residents 1,314 45.1% Owner occupied1,601 54.9% Renter occupied
Language usage in Waukesha
English speakers - Total 90.9% of residents of Waukesha speak English at home.
5.9% of residents speak Spanish at home 2,014 51.1% Speak English very well1,931 48.9% Speak English less than very well3.2% of residents speak other language at home 1,756 82.4% Speak English very well376 17.6% Speak English less than very well
English speakers - Born in the United States 93.1% of residents of Waukesha speak English at home.
6.5% of residents speak Spanish at home 855 94.2% Speak English very well53 5.8% Speak English less than very well0.4% of residents speak other language at home 50 100.0% Speak English very well
English speakers - Native, born elsewhere 55.6% of residents of Waukesha speak English at home.
28.1% of residents speak Spanish at home 18 21.7% Speak English very well65 78.3% Speak English less than very well16.3% of residents speak other language at home 48 100.0% Speak English very well
English speakers - Foreign-born 27.2% of residents of Waukesha speak English at home.
32.0% of residents speak Spanish at home 349 30.3% Speak English very well802 69.7% Speak English less than very well40.8% of residents speak other language at home 1,145 78.2% Speak English very well320 21.8% Speak English less than very well
White (Caucasian) - Speak only English Native:
97.3% (50,946)Foreign-born:
41.3% (408)
White (Caucasian) - Speak another language Native:
2.7% (1,394)Foreign-born:
58.7% (580)
Black or African American - Speak only English Native:
97.4% (2,001)Foreign-born:
70.7% (23)
Black or African American - Speak another language Native:
2.2% (45)Foreign-born:
9.0% (3)
American Indian / Alaska Native - Speak only English Native:
83.6% (192)Foreign-born:
29.2% (14)
American Indian / Alaska Native - Speak another language Native:
17.3% (40)Foreign-born:
70.5% (34)
Asian - Speak only English Native:
57.8% (521)Foreign-born:
30.1% (459)
Asian - Speak another language Native:
42.2% (380)Foreign-born:
69.9% (1,065)
Other race - Speak only English Native:
61.7% (926)Foreign-born:
12.5% (116)
Other race - Speak another language Native:
36.1% (542)Foreign-born:
86.8% (803)
Two or more races - Speak only English Native:
90.3% (3,164)Foreign-born:
7.4% (73)
Two or more races - Speak another language Native:
9.6% (336)Foreign-born:
86.5% (847)
White alone - Speak only English Native:
97.7% (49,506)Foreign-born:
47.7% (408)
White alone - Speak another language Native:
2.3% (1,174)Foreign-born:
52.3% (447)
Hispanic or Latino - Speak another language Native:
29.8% (1,857)Foreign-born:
100.0% (1,104)
Foreign-born residents in Waukesha 5,159 residents are foreign born (4.0% Latin America , 2.1% Asia , 0.9% Europe ).
This city:
7.2%Wisconsin:
5.0%
Marital status for residents in Waukesha Marital status - White (Caucasian) population 15 years and over
Males 40.7% Never married47.0% Now married0.6% Separated1.8% Widowed9.9% DivorcedFemales 34.2% Never married44.8% Now married0.4% Separated9.7% Widowed10.9% DivorcedWomen who gave birth in the past 12 months Now married:
67.1% (508)Unmarried:
32.9% (249)
Women who did not give birth in the past 12 months Now married:
38.2% (4,941)Unmarried:
61.8% (7,986)
Marital status - Black or African American population 15 years and over
Males 75.8% Never married19.1% Now married0.0% Separated0.0% Widowed5.2% DivorcedFemales 82.4% Never married10.3% Now married2.0% Separated2.1% Widowed3.2% DivorcedWomen who gave birth in the past 12 months Now married:
30.2% (15)Unmarried:
69.8% (36)
Women who did not give birth in the past 12 months Now married:
4.4% (28)Unmarried:
95.6% (614)
Marital status - American Indian / Alaska Native population 15 years and over
Males 63.7% Never married10.1% Now married0.6% Separated22.9% Widowed2.8% DivorcedFemales 73.5% Never married25.3% Now married0.0% Separated0.0% Widowed1.2% DivorcedWomen who did not give birth in the past 12 months Now married:
25.6% (20)Unmarried:
74.4% (58)
Marital status - Asian population 15 years and over
Males 21.5% Never married73.8% Now married0.0% Separated0.4% Widowed4.3% DivorcedFemales 18.4% Never married71.4% Now married0.0% Separated4.3% Widowed5.8% DivorcedWomen who gave birth in the past 12 months Now married:
100.0% (55)Unmarried:
0.0% (0)
Women who did not give birth in the past 12 months Now married:
70.9% (457)Unmarried:
29.1% (187)
Marital status - Other race population 15 years and over
Males 45.1% Never married44.7% Now married0.0% Separated0.5% Widowed9.8% DivorcedFemales 34.3% Never married60.0% Now married0.5% Separated0.6% Widowed4.5% DivorcedWomen who gave birth in the past 12 months Now married:
100.0% (7)Unmarried:
0.0% (0)
Women who did not give birth in the past 12 months Now married:
39.5% (140)Unmarried:
60.5% (214)
Marital status - Two or more races population 15 years and over
Males 58.2% Never married35.2% Now married0.0% Separated0.6% Widowed5.9% DivorcedFemales 43.9% Never married47.9% Now married2.9% Separated0.0% Widowed5.3% DivorcedWomen who did not give birth in the past 12 months Now married:
45.4% (598)Unmarried:
54.6% (718)
Marital status - White alone, not Hispanic / Latino population 15 years and over
Males 38.6% Never married48.4% Now married0.7% Separated1.9% Widowed10.4% DivorcedFemales 34.2% Never married44.5% Now married0.4% Separated9.7% Widowed11.2% DivorcedWomen who gave birth in the past 12 months Now married:
76.6% (508)Unmarried:
23.4% (155)
Women who did not give birth in the past 12 months Now married:
37.2% (4,672)Unmarried:
62.8% (7,901)
Marital status - Hispanic or Latino population 15 years and over
Males 51.0% Never married40.7% Now married0.0% Separated1.5% Widowed6.8% DivorcedFemales 39.8% Never married44.5% Now married1.4% Separated2.8% Widowed11.4% DivorcedWomen who gave birth in the past 12 months Now married:
13.4% (15)Unmarried:
86.6% (99)
Women who did not give birth in the past 12 months Now married:
39.5% (857)Unmarried:
60.5% (1,315)
Ancestries in Waukesha
9,348 30.6% German1,766 5.8% American1,626 5.3% Polish1,448 4.7% Irish1,391 4.6% European1,242 4.1% English760 2.5% Italian639 2.1% Norwegian327 1.1% Greek324 1.1% Dutch192 0.6% Scottish179 0.6% French172 0.6% Ukrainian166 0.5% Scandinavian152 0.5% South African150 0.5% Swedish137 0.4% Eastern European118 0.4% Czech99 0.3% Russian77 0.3% Romanian73 0.2% Cajun69 0.2% Lithuanian67 0.2% Portuguese66 0.2% Scotch-Irish63 0.2% French Canadian55 0.2% Austrian55 0.2% Swiss52 0.2% Croatian49 0.2% Welsh48 0.2% Danish46 0.2% Slovene45 0.1% Czechoslovakian39 0.1% Finnish34 0.1% British32 0.1% Iranian31 0.1% African30 0.10% Jamaican28 0.09% Hungarian27 0.09% Northern European26 0.09% Slavic21 0.07% Belgian19 0.06% Slovak14 0.05% Trinidadian and Tobagonian13 0.04% Israeli11 0.04% Canadian11 0.04% Latvian11 0.04% Luxembourger9 0.03% Egyptian7 0.02% Lebanese6 0.02% Serbian3 0.01% Armenian
Geographical mobility in Waukesha Same house 1 year ago 47,627 86.5% White (Caucasian)3,434 92.2% Black or African American278 100.0% American Indian / Alaska Native1,968 88.4% Asian1,223 82.3% Other race4,020 77.1% Two or more races46,328 87.1% White alone, not Hispanic / Latino7,315 81.8% Hispanic or LatinoMoved within same county 4,226 7.7% White / Caucasian22 0.6% Black or African American24 1.1% Asian174 11.7% Other race888 17.0% Two or more races3,745 7.0% White alone, not Hispanic / Latino1,410 15.8% Hispanic or LatinoMoved within same state 1,946 3.5% White / Caucasian212 5.7% Black or African American100 4.5% Asian23 1.5% Other race219 4.2% Two or more races1,861 3.5% White alone, not Hispanic / Latino228 2.6% Hispanic or LatinoMoved from different state 1,287 2.3% White / Caucasian55 1.5% Black or African American26 1.2% Asian24 1.6% Other race73 1.4% Two or more races1,255 2.4% White alone, not Hispanic / Latino86 1.0% Hispanic or LatinoMoved from abroad 49 2.2% Asian7 0.5% Other race120 2.3% Two or more races111 1.2% Hispanic or Latino
Children Nativity (place of birth) in Waukesha
Children under 6 years - Living with two parents Both parents native 2,453 100.0% NativeBoth parents foreign-born 317 95.4% Native15 4.6% Foreign-bornOne native, one foreign-born parent 150 100.0% NativeChildren under 6 years - Living with one parent Native parent 1,484 100.0% NativeForeign-born parent 35 100.0% NativeChildren 6 to 17 years - Living with two parents Both parents native 4,809 100.0% NativeBoth parents foreign-born 357 57.2% Native267 42.8% Foreign-bornOne native, one foreign-born parent 366 93.7% Native25 6.3% Foreign-bornChildren 6 to 17 years - Living with one parent Native parent 3,049 100.0% NativeForeign-born parent 246 51.3% Native233 48.7% Foreign-born
Grandparents responsible for own grandchildren in Waukesha
Grandparents (30 to 59 years) White / Caucasian 84 30.1% Responsible for grandchildren195 69.9% Not responsible for grandchildrenBlack or African American 15 100.0% Not responsible for grandchildrenTwo or more races 19 37.3% Responsible for grandchildren32 62.7% Not responsible for grandchildrenWhite alone, not Hispanic / Latino 69 25.5% Responsible for grandchildren200 74.5% Not responsible for grandchildrenHispanic or Latino 25 100.0% Responsible for grandchildrenGrandparents (60 years and over) White / Caucasian 51 17.6% Responsible for grandchildren240 82.4% Not responsible for grandchildrenWhite alone, not Hispanic / Latino 51 18.4% Responsible for grandchildren227 81.6% Not responsible for grandchildrenHispanic or Latino 10 100.0% Not responsible for grandchildren