Races in Waxahachie, Texas (TX) Detailed Stats
Data:
Races - White alone (%)
Races - White alone (% change since 2000)
Races - Black alone (%)
Races - Black alone (% change since 2000)
Races - American Indian alone (%)
Races - American Indian alone (% change since 2000)
Races - Asian alone (%)
Races - Asian alone (% change since 2000)
Races - Hispanic (%)
Races - Hispanic (% change since 2000)
Races - Native Hawaiian and Other Pacific Islander alone (%)
Races - Native Hawaiian and Other Pacific Islander alone (% change since 2000)
Races - Two or more races(%)
Races - Two or more races(% change since 2000)
Races - Other race alone (%)
Races - Other race alone (% change since 2000)
Racial diversity
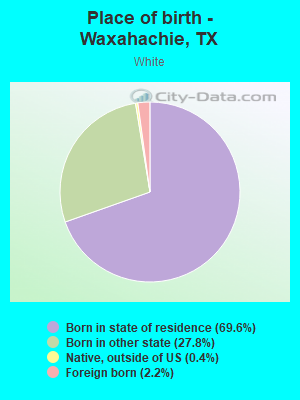
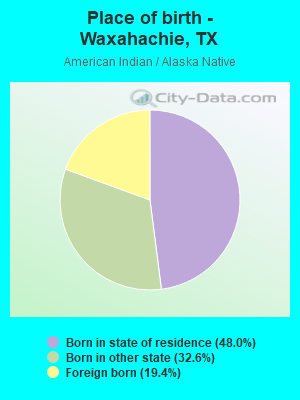
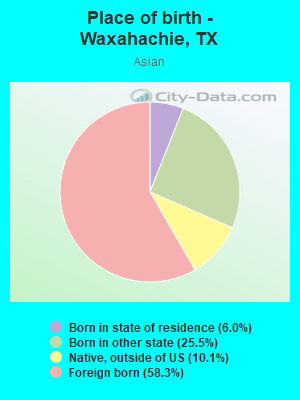
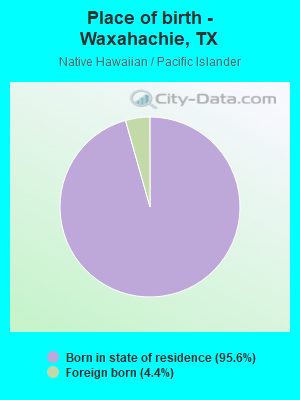
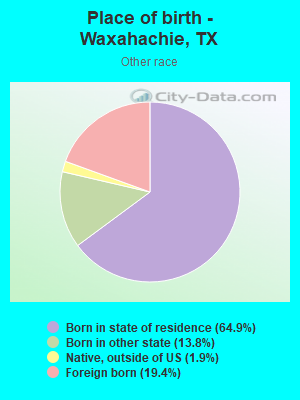
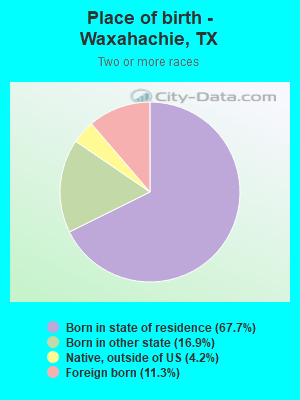
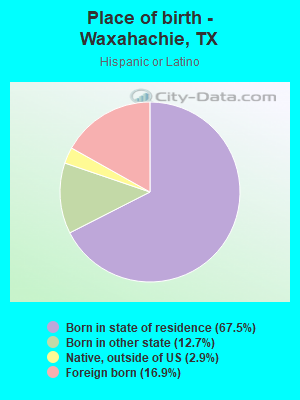
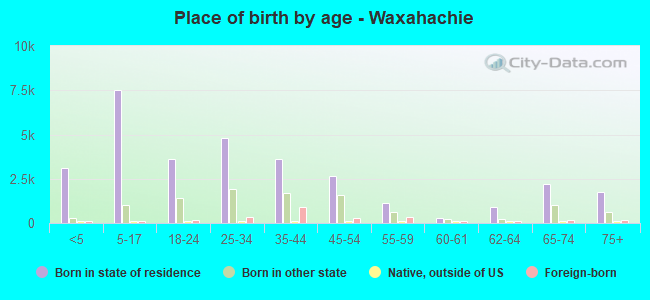
Place of birth - Born in state of residence (%)
Place of birth - Born in state of residence (%) - White
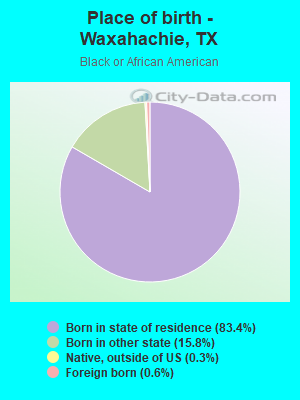
Place of birth - Born in state of residence (%) - Black or African American
Place of birth - Born in state of residence (%) - Asian
Place of birth - Born in state of residence (%) - Hispanic or Latino
Place of birth - Born in state of residence (%) - American Indian and Alaska Native
Place of birth - Born in state of residence (%) - Multirace
Place of birth - Born in state of residence (%) - Other Race
Place of birth - Born in other state (%)
Place of birth - Born in other state (%) - White
Place of birth - Born in other state (%) - Black or African American
Place of birth - Born in other state (%) - Asian
Place of birth - Born in other state (%) - Hispanic or Latino
Place of birth - Born in other state (%) - American Indian and Alaska Native
Place of birth - Born in other state (%) - Multirace
Place of birth - Born in other state (%) - Other Race
Place of birth - Native, outside of US (%)
Place of birth - Native, outside of US (%) - White
Place of birth - Native, outside of US (%) - Black or African American
Place of birth - Native, outside of US (%) - Asian
Place of birth - Native, outside of US (%) - Hispanic or Latino
Place of birth - Native, outside of US (%) - American Indian and Alaska Native
Place of birth - Native, outside of US (%) - Multirace
Place of birth - Native, outside of US (%) - Other Race
Place of birth - Foreign born (%)
Place of birth - Foreign born (%) - White
Place of birth - Foreign born (%) - Black or African American
Place of birth - Foreign born (%) - Asian
Place of birth - Foreign born (%) - Hispanic or Latino
Place of birth - Foreign born (%) - American Indian and Alaska Native
Place of birth - Foreign born (%) - Multirace
Place of birth - Foreign born (%) - Other Race
Residents speaking English at home (%)
Residents speaking English at home - Born in the United States (%)
Residents speaking English at home - Native, born elsewhere (%)
Residents speaking English at home - Foreign born (%)
Residents speaking Spanish at home (%)
Residents speaking Spanish at home - Born in the United States (%)
Residents speaking Spanish at home - Native, born elsewhere (%)
Residents speaking Spanish at home - Foreign born (%)
Residents speaking other language at home (%)
Residents speaking other language at home - Born in the United States (%)
Residents speaking other language at home - Native, born elsewhere (%)
Residents speaking other language at home - Foreign born (%)
Marital status - Never married (%)
Marital status - Now married (%)
Marital status - Separated (%)
Marital status - Widowed (%)
Marital status - Divorced (%)
Ancestries Reported - Arab (%)
Ancestries Reported - Czech (%)
Ancestries Reported - Danish (%)
Ancestries Reported - Dutch (%)
Ancestries Reported - English (%)
Ancestries Reported - French (%)
Ancestries Reported - French Canadian (%)
Ancestries Reported - German (%)
Ancestries Reported - Greek (%)
Ancestries Reported - Hungarian (%)
Ancestries Reported - Irish (%)
Ancestries Reported - Italian (%)
Ancestries Reported - Lithuanian (%)
Ancestries Reported - Norwegian (%)
Ancestries Reported - Polish (%)
Ancestries Reported - Portuguese (%)
Ancestries Reported - Russian (%)
Ancestries Reported - Scotch-Irish (%)
Ancestries Reported - Scottish (%)
Ancestries Reported - Slovak (%)
Ancestries Reported - Subsaharan African (%)
Ancestries Reported - Swedish (%)
Ancestries Reported - Swiss (%)
Ancestries Reported - Ukrainian (%)
Ancestries Reported - United States (%)
Ancestries Reported - Welsh (%)
Ancestries Reported - West Indian (%)
Ancestries Reported - Other (%)
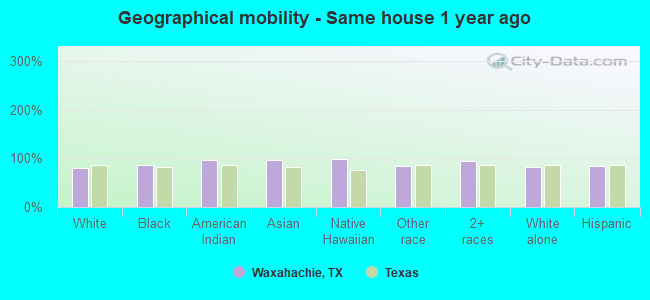
Geographical mobility - Same house 1 year ago (%)
Geographical mobility - Same house 1 year ago (%) - White
Geographical mobility - Same house 1 year ago (%) - Black or African American
Geographical mobility - Same house 1 year ago (%) - Asian
Geographical mobility - Same house 1 year ago (%) - Hispanic or Latino
Geographical mobility - Same house 1 year ago (%) - American Indian and Alaska Native
Geographical mobility - Same house 1 year ago (%) - Multirace
Geographical mobility - Same house 1 year ago (%) - Other Race
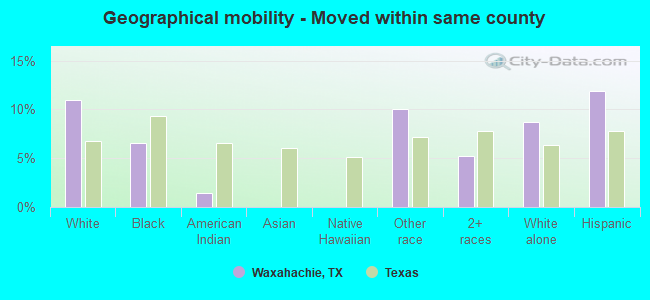
Geographical mobility - Moved within same county (%)
Geographical mobility - Moved within same county (%) - White
Geographical mobility - Moved within same county (%) - Black or African American
Geographical mobility - Moved within same county (%) - Asian
Geographical mobility - Moved within same county (%) - Hispanic or Latino
Geographical mobility - Moved within same county (%) - American Indian and Alaska Native
Geographical mobility - Moved within same county (%) - Multirace
Geographical mobility - Moved within same county (%) - Other Race
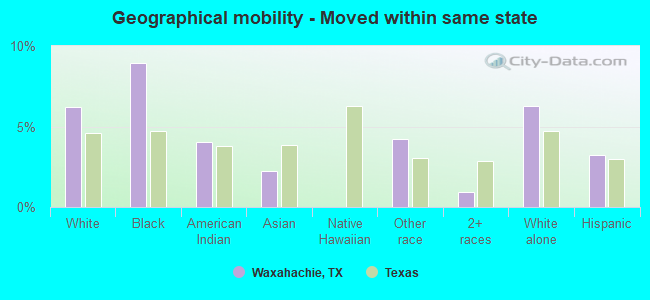
Geographical mobility - Moved from different county within same state (%)
Geographical mobility - Moved from different county within same state (%) - White
Geographical mobility - Moved from different county within same state (%) - Black or African American
Geographical mobility - Moved from different county within same state (%) - Asian
Geographical mobility - Moved from different county within same state (%) - Hispanic or Latino
Geographical mobility - Moved from different county within same state (%) - American Indian and Alaska Native
Geographical mobility - Moved from different county within same state (%) - Multirace
Geographical mobility - Moved from different county within same state (%) - Other Race
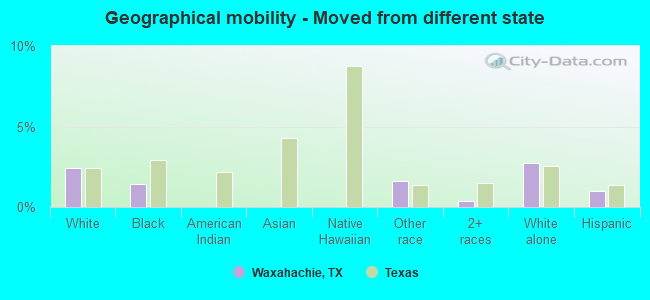
Geographical mobility - Moved from different state (%)
Geographical mobility - Moved from different state (%) - White
Geographical mobility - Moved from different state (%) - Black or African American
Geographical mobility - Moved from different state (%) - Asian
Geographical mobility - Moved from different state (%) - Hispanic or Latino
Geographical mobility - Moved from different state (%) - American Indian and Alaska Native
Geographical mobility - Moved from different state (%) - Multirace
Geographical mobility - Moved from different state (%) - Other Race
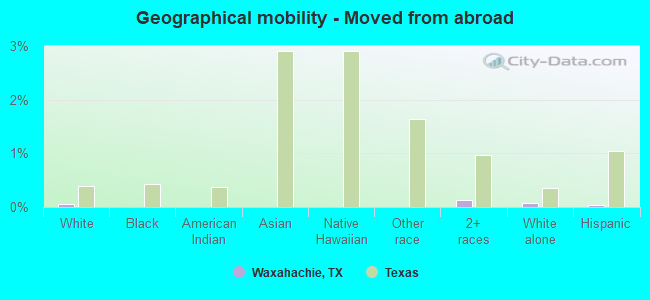
Geographical mobility - Moved from abroad (%)
Geographical mobility - Moved from abroad (%) - White
Geographical mobility - Moved from abroad (%) - Black or African American
Geographical mobility - Moved from abroad (%) - Asian
Geographical mobility - Moved from abroad (%) - Hispanic or Latino
Geographical mobility - Moved from abroad (%) - American Indian and Alaska Native
Geographical mobility - Moved from abroad (%) - Multirace
Geographical mobility - Moved from abroad (%) - Other Race
Place of birth for the foreign-born population - Ireland (%)
Place of birth for the foreign-born population - Denmark (%)
Place of birth for the foreign-born population - Norway (%)
Place of birth for the foreign-born population - Sweden (%)
Place of birth for the foreign-born population - United Kingdom (%)
Place of birth for the foreign-born population - England (%)
Place of birth for the foreign-born population - Scotland (%)
Place of birth for the foreign-born population - Other Northern Europe (%)
Place of birth for the foreign-born population - Austria (%)
Place of birth for the foreign-born population - Belgium (%)
Place of birth for the foreign-born population - France (%)
Place of birth for the foreign-born population - Germany (%)
Place of birth for the foreign-born population - Netherlands (%)
Place of birth for the foreign-born population - Switzerland (%)
Place of birth for the foreign-born population - Other Western Europe (%)
Place of birth for the foreign-born population - Greece (%)
Place of birth for the foreign-born population - Italy (%)
Place of birth for the foreign-born population - Portugal (%)
Place of birth for the foreign-born population - Spain (%)
Place of birth for the foreign-born population - Other Southern Europe (%)
Place of birth for the foreign-born population - Albania (%)
Place of birth for the foreign-born population - Belarus (%)
Place of birth for the foreign-born population - Bosnia and Herzegovina (%)
Place of birth for the foreign-born population - Bulgaria (%)
Place of birth for the foreign-born population - Croatia (%)
Place of birth for the foreign-born population - Czechoslovakia (%)
Place of birth for the foreign-born population - Hungary (%)
Place of birth for the foreign-born population - Latvia (%)
Place of birth for the foreign-born population - Lithuania (%)
Place of birth for the foreign-born population - North Macedonia (Macedonia) (%)
Place of birth for the foreign-born population - Moldova (%)
Place of birth for the foreign-born population - Poland (%)
Place of birth for the foreign-born population - Romania (%)
Place of birth for the foreign-born population - Russia (%)
Place of birth for the foreign-born population - Serbia (%)
Place of birth for the foreign-born population - Ukraine (%)
Place of birth for the foreign-born population - Other Eastern Europe (%)
Place of birth for the foreign-born population - China (%)
Place of birth for the foreign-born population - Hong Kong (%)
Place of birth for the foreign-born population - Taiwan (%)
Place of birth for the foreign-born population - Japan (%)
Place of birth for the foreign-born population - Korea (%)
Place of birth for the foreign-born population - Other Eastern Asia (%)
Place of birth for the foreign-born population - Afghanistan (%)
Place of birth for the foreign-born population - Bangladesh (%)
Place of birth for the foreign-born population - India (%)
Place of birth for the foreign-born population - Iran (%)
Place of birth for the foreign-born population - Kazakhstan (%)
Place of birth for the foreign-born population - Nepal (%)
Place of birth for the foreign-born population - Pakistan (%)
Place of birth for the foreign-born population - Sri Lanka (%)
Place of birth for the foreign-born population - Uzbekistan (%)
Place of birth for the foreign-born population - Other South Central Asia (%)
Place of birth for the foreign-born population - Burma (%)
Place of birth for the foreign-born population - Cambodia (%)
Place of birth for the foreign-born population - Indonesia (%)
Place of birth for the foreign-born population - Laos (%)
Place of birth for the foreign-born population - Malaysia (%)
Place of birth for the foreign-born population - Philippines (%)
Place of birth for the foreign-born population - Singapore (%)
Place of birth for the foreign-born population - Thailand (%)
Place of birth for the foreign-born population - Vietnam (%)
Place of birth for the foreign-born population - Other South Eastern Asia (%)
Place of birth for the foreign-born population - Armenia (%)
Place of birth for the foreign-born population - Iraq (%)
Place of birth for the foreign-born population - Israel (%)
Place of birth for the foreign-born population - Jordan (%)
Place of birth for the foreign-born population - Kuwait (%)
Place of birth for the foreign-born population - Lebanon (%)
Place of birth for the foreign-born population - Saudi Arabia (%)
Place of birth for the foreign-born population - Syria (%)
Place of birth for the foreign-born population - Turkey (%)
Place of birth for the foreign-born population - Yemen (%)
Place of birth for the foreign-born population - Other Western Asia (%)
Place of birth for the foreign-born population - Eritrea (%)
Place of birth for the foreign-born population - Ethiopia (%)
Place of birth for the foreign-born population - Kenya (%)
Place of birth for the foreign-born population - Somalia (%)
Place of birth for the foreign-born population - Uganda (%)
Place of birth for the foreign-born population - Zimbabwe (%)
Place of birth for the foreign-born population - Other Eastern Africa (%)
Place of birth for the foreign-born population - Cameroon (%)
Place of birth for the foreign-born population - Congo (%)
Place of birth for the foreign-born population - Democratic Republic of Congo (Zaire) (%)
Place of birth for the foreign-born population - Other Middle Africa (%)
Place of birth for the foreign-born population - Egypt (%)
Place of birth for the foreign-born population - Morocco (%)
Place of birth for the foreign-born population - Sudan (%)
Place of birth for the foreign-born population - Other Northern Africa (%)
Place of birth for the foreign-born population - South Africa (%)
Place of birth for the foreign-born population - Other Southern Africa (%)
Place of birth for the foreign-born population - Cabo Verde (%)
Place of birth for the foreign-born population - Ghana (%)
Place of birth for the foreign-born population - Liberia (%)
Place of birth for the foreign-born population - Nigeria (%)
Place of birth for the foreign-born population - Senegal (%)
Place of birth for the foreign-born population - Sierra Leone (%)
Place of birth for the foreign-born population - Other Western Africa (%)
Place of birth for the foreign-born population - Australia (%)
Place of birth for the foreign-born population - New Zealand (%)
Place of birth for the foreign-born population - Fiji (%)
Place of birth for the foreign-born population - Micronesia (%)
Place of birth for the foreign-born population - Bahamas (%)
Place of birth for the foreign-born population - Barbados (%)
Place of birth for the foreign-born population - Cuba (%)
Place of birth for the foreign-born population - Dominica (%)
Place of birth for the foreign-born population - Dominican Republic (%)
Place of birth for the foreign-born population - Grenada (%)
Place of birth for the foreign-born population - Haiti (%)
Place of birth for the foreign-born population - Jamaica (%)
Place of birth for the foreign-born population - St. Vincent and the Grenadines (%)
Place of birth for the foreign-born population - Trinidad and Tobago (%)
Place of birth for the foreign-born population - West Indies (%)
Place of birth for the foreign-born population - Other Caribbean (%)
Place of birth for the foreign-born population - Belize (%)
Place of birth for the foreign-born population - Costa Rica (%)
Place of birth for the foreign-born population - El Salvador (%)
Place of birth for the foreign-born population - Guatemala (%)
Place of birth for the foreign-born population - Honduras (%)
Place of birth for the foreign-born population - Mexico (%)
Place of birth for the foreign-born population - Nicaragua (%)
Place of birth for the foreign-born population - Panama (%)
Place of birth for the foreign-born population - Other Central America (%)
Place of birth for the foreign-born population - Argentina (%)
Place of birth for the foreign-born population - Bolivia (%)
Place of birth for the foreign-born population - Brazil (%)
Place of birth for the foreign-born population - Chile (%)
Place of birth for the foreign-born population - Colombia (%)
Place of birth for the foreign-born population - Ecuador (%)
Place of birth for the foreign-born population - Guyana (%)
Place of birth for the foreign-born population - Peru (%)
Place of birth for the foreign-born population - Uruguay (%)
Place of birth for the foreign-born population - Venezuela (%)
Place of birth for the foreign-born population - Other South America (%)
Place of birth for the foreign-born population - Canada (%)
Place of birth for the foreign-born population - Other Northern America (%)
Place of birth for the foreign-born population - Other (%)
Latest news about races in Waxahachie, TX collected exclusively by city-data.com from local newspapers, TV, and radio stations
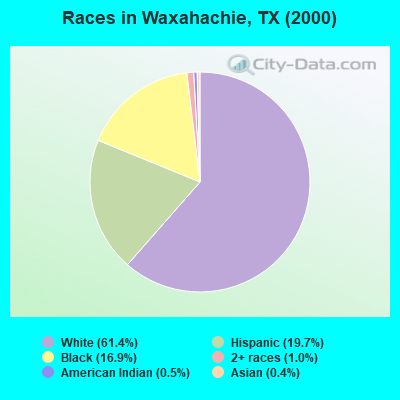
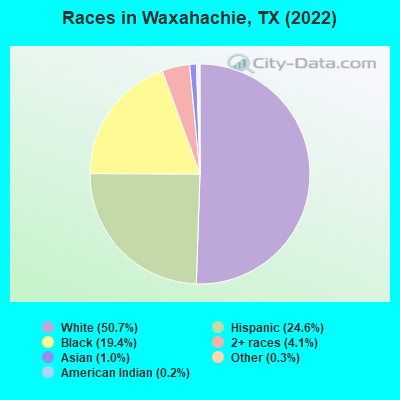
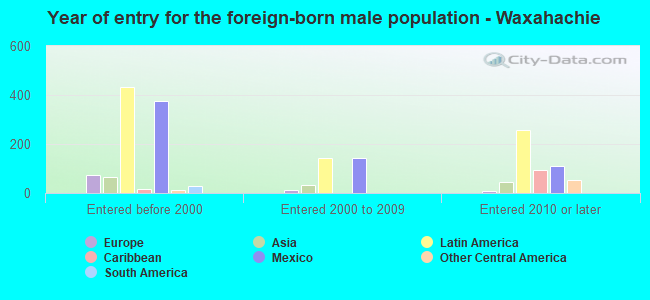
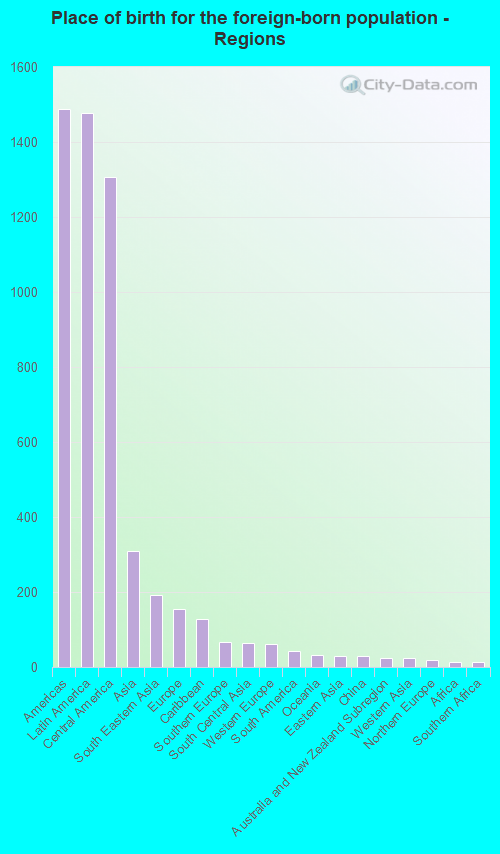
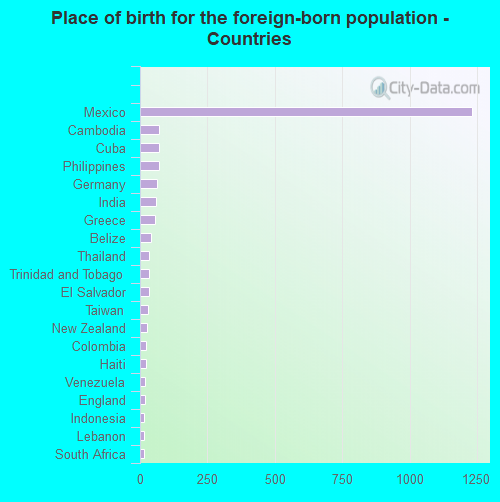
According to 2022 data, the most numerous races in Waxahachie, TX are Hispanic (11,176 residents), White alone (23,021 residents), and Black alone (8,783 residents). 83.3% of Waxahachie residents speak English at home. 4.4% of Waxahachie, TX residents are foreign-born (3.4% born in Latin America, 0.7% born in Asia), which is 285.6% less than the foreign-born rate of 17.0% across the entire state of Texas.
Race distribution in Waxahachie
2000 2022
10,933,313 52.4% White alone 6,669,666 32.0% Hispanic 2,364,255 11.3% Black alone 554,445 2.7% Asian alone 230,567 1.1% Two or more races 68,859 0.3% American Indian alone 19,958 0.10% Other race alone 10,757 0.05% Native Hawaiian and Other
12,070,642 40.2% Hispanic 11,683,430 38.9% White alone 3,508,706 11.7% Black alone 1,608,173 5.4% Asian alone 956,560 3.2% Two or more races 125,763 0.4% Other race alone 47,023 0.2% American Indian alone 29,275 0.10% Native Hawaiian and Other
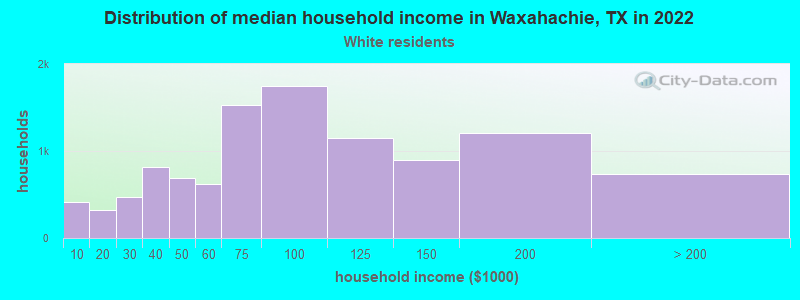
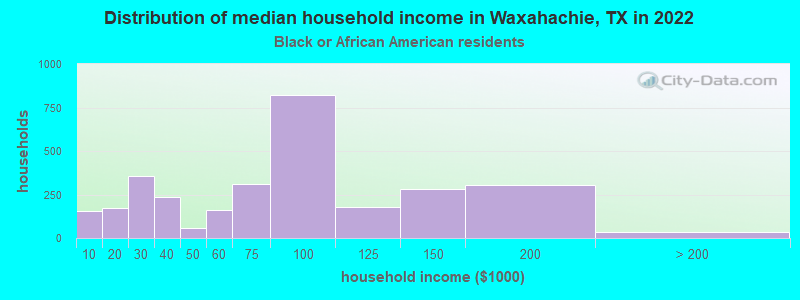
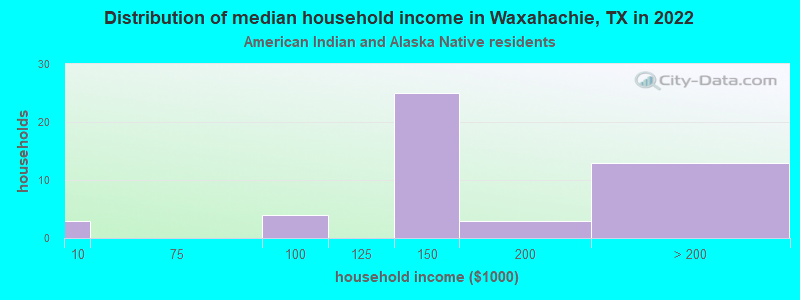
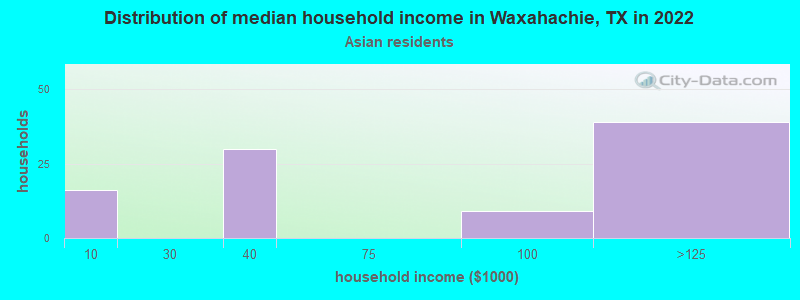
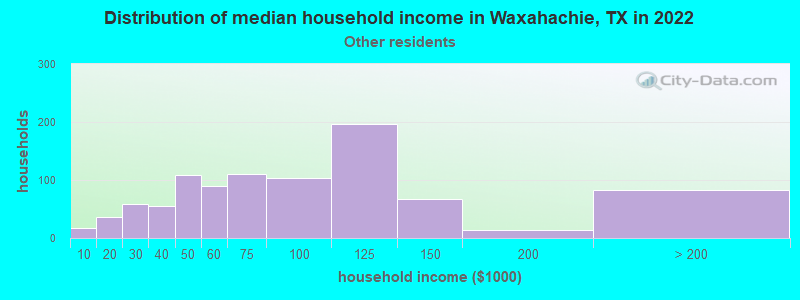
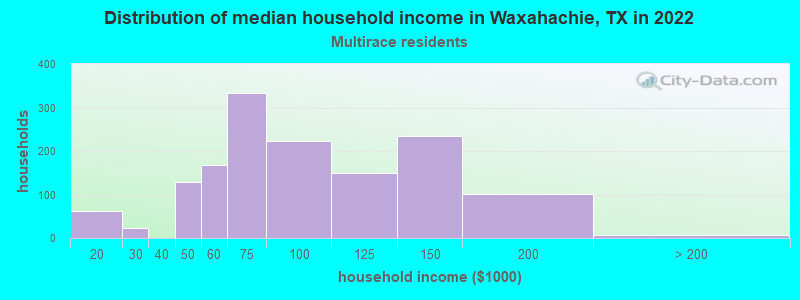
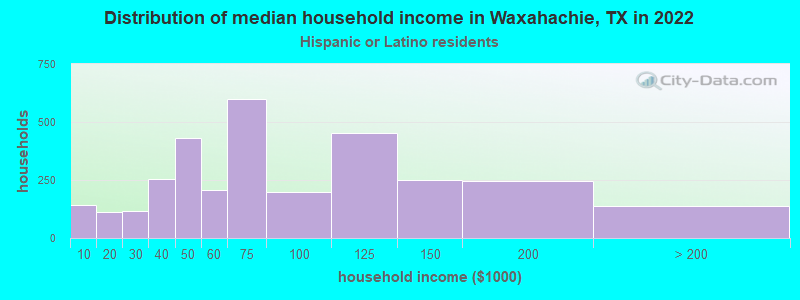
Income and house value in Waxahachie Median household income in 2022 $80,678 White non-Hispanic householders$67,103 Black householders$122,518 American Indian and Alaska Native householders$80,798 Some other race householders$62,693 Two or more races householders$69,134 Hispanic or Latino race householdersMedian 2022 house value $341,863 White Non-Hispanic householders$144,722 Black or African American householders$337,684 American Indian or Alaska Native householders $344,142 Asian householders$243,482 Some other race householders$215,753 Two or more races householders$213,474 Hispanic or Latino householders
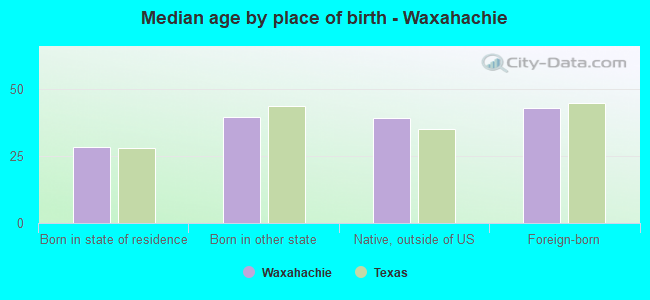
Median age by race in Waxahachie
34.8 Median age for White residents35.2 34.7 31.6 Median age for Black or African American residents24.8 34.6 34.6 Median age for American Indian / Alaska Native residents35.5 21.6 44.3 Median age for Asian residents46.3 46.6 7.2 Median age for Native Hawaiian / Pacific Islander residents7.1 24.4 34.3 Median age for Other race residents34.9 34.8 19.3 Median age for Two or more races residents20.7 18.8 37.0 Median age for White alone residents36.6 37.4 27.7 Median age for Hispanic or Latino residents25.0 27.3
Owner/renter occupied households by race in Waxahachie
House owners and renters - White residents 6,902 66.4% Owner occupied3,486 33.6% Renter occupiedHouse owners and renters - Black or African American residents 1,348 48.2% Owner occupied1,449 51.8% Renter occupiedHouse owners and renters - American Indian / Alaska Native residents 31 47.9% Owner occupied34 52.1% Renter occupiedHouse owners and renters - Asian residents 100 100.0% Owner occupiedHouse owners and renters - Native Hawaiian / Pacific Islander residents 30 100.0% Renter occupiedHouse owners and renters - Other race residents 581 62.4% Owner occupied351 37.6% Renter occupiedHouse owners and renters - Two or more races residents 852 68.8% Owner occupied386 31.2% Renter occupiedHouse owners and renters - White alone residents 6,190 66.2% Owner occupied3,165 33.8% Renter occupiedHouse owners and renters - Hispanic or Latino residents 2,071 70.7% Owner occupied856 29.3% Renter occupied
Language usage in Waxahachie
English speakers - Total 83.3% of residents of Waxahachie speak English at home.
15.0% of residents speak Spanish at home 4,589 72.8% Speak English very well1,714 27.2% Speak English less than very well1.3% of residents speak other language at home 367 65.8% Speak English very well191 34.2% Speak English less than very well
English speakers - Born in the United States 86.1% of residents of Waxahachie speak English at home.
14.1% of residents speak Spanish at home 1,233 85.7% Speak English very well205 14.3% Speak English less than very well0.5% of residents speak other language at home 51 100.0% Speak English very well
English speakers - Native, born elsewhere 29.1% of residents of Waxahachie speak English at home.
77.9% of residents speak Spanish at home 141 50.5% Speak English very well138 49.5% Speak English less than very well
English speakers - Foreign-born 15.9% of residents of Waxahachie speak English at home.
64.6% of residents speak Spanish at home 524 32.6% Speak English very well1,081 67.4% Speak English less than very well17.9% of residents speak other language at home 247 55.5% Speak English very well198 44.5% Speak English less than very well
White (Caucasian) - Speak only English Native:
92.4% (22,388)Foreign-born:
36.1% (208)
White (Caucasian) - Speak another language Native:
7.4% (1,803)Foreign-born:
69.2% (399)
Black or African American - Speak only English Native:
99.9% (6,835)Foreign-born:
55.4% (30)
Black or African American - Speak another language Native:
0.1% (8)Foreign-born:
40.9% (22)
American Indian / Alaska Native - Speak only English Native:
54.0% (92)Foreign-born:
100.0% (47)
Asian - Speak only English Native:
100.0% (163)Foreign-born:
2.6% (7)
Asian - Speak another language Native:
2.4% (4)Foreign-born:
100.0% (275)
Other race - Speak only English Native:
55.7% (966)Foreign-born:
5.5% (25)
Other race - Speak another language Native:
44.4% (770)Foreign-born:
89.0% (407)
Two or more races - Speak only English Native:
58.9% (2,549)Foreign-born:
12.3% (83)
Two or more races - Speak another language Native:
40.9% (1,771)Foreign-born:
87.4% (591)
White alone - Speak only English Native:
97.2% (20,656)Foreign-born:
53.2% (104)
White alone - Speak another language Native:
2.8% (602)Foreign-born:
34.3% (67)
Hispanic or Latino - Speak only English Native:
52.9% (4,277)Foreign-born:
6.5% (120)
Hispanic or Latino - Speak another language Native:
47.3% (3,824)Foreign-born:
87.3% (1,612)
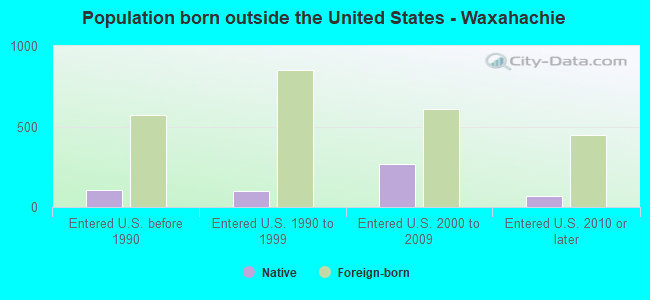
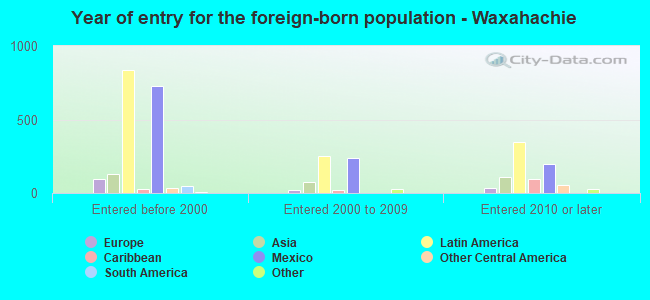
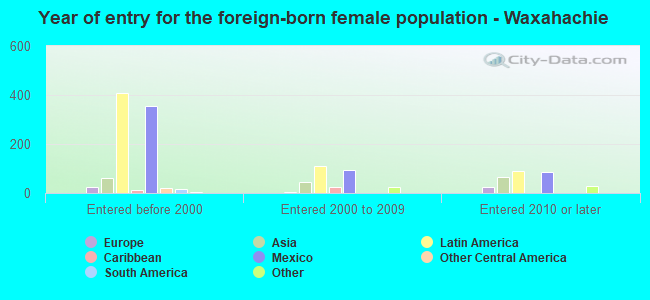
Foreign-born residents in Waxahachie 2,000 residents are foreign born (3.4% Latin America , 0.7% Asia ).
This city:
4.4%Texas:
17.1%
Marital status for residents in Waxahachie Marital status - White (Caucasian) population 15 years and over
Males 31.7% Never married54.6% Now married1.9% Separated2.5% Widowed9.4% DivorcedFemales 24.6% Never married54.3% Now married1.4% Separated7.7% Widowed12.1% DivorcedWomen who gave birth in the past 12 months Now married:
63.7% (366)Unmarried:
36.3% (208)
Women who did not give birth in the past 12 months Now married:
53.6% (3,338)Unmarried:
46.4% (2,888)
Marital status - Black or African American population 15 years and over
Males 47.6% Never married36.6% Now married2.8% Separated2.7% Widowed10.2% DivorcedFemales 51.7% Never married23.5% Now married6.8% Separated5.8% Widowed12.2% DivorcedWomen who gave birth in the past 12 months Now married:
100.0% (14)Unmarried:
0.0% (0)
Women who did not give birth in the past 12 months Now married:
25.6% (708)Unmarried:
74.4% (2,061)
Marital status - American Indian / Alaska Native population 15 years and over
Males 23.3% Never married73.3% Now married0.0% Separated0.0% Widowed3.5% DivorcedFemales 94.8% Never married0.0% Now married0.0% Separated0.0% Widowed5.2% DivorcedWomen who did not give birth in the past 12 months Now married:
0.0% (0)Unmarried:
100.0% (54)
Marital status - Asian population 15 years and over
Males 12.0% Never married80.6% Now married0.0% Separated0.0% Widowed7.4% DivorcedFemales 6.2% Never married72.6% Now married0.0% Separated0.0% Widowed21.2% DivorcedWomen who did not give birth in the past 12 months Now married:
76.0% (82)Unmarried:
24.0% (26)
Marital status - Native Hawaiian / Pacific Islander population 15 years and over
Males 100.0% Never married0.0% Now married0.0% Separated0.0% Widowed0.0% DivorcedFemales 100.0% Never married0.0% Now married0.0% Separated0.0% Widowed0.0% DivorcedWomen who did not give birth in the past 12 months Now married:
0.0% (0)Unmarried:
100.0% (36)
Marital status - Other race population 15 years and over
Males 36.5% Never married57.2% Now married0.0% Separated0.0% Widowed6.3% DivorcedFemales 30.1% Never married54.8% Now married4.9% Separated4.7% Widowed5.5% DivorcedWomen who gave birth in the past 12 months Now married:
36.0% (11)Unmarried:
64.0% (19)
Women who did not give birth in the past 12 months Now married:
60.5% (408)Unmarried:
39.5% (267)
Marital status - Two or more races population 15 years and over
Males 50.1% Never married36.1% Now married0.0% Separated3.1% Widowed10.6% DivorcedFemales 50.9% Never married39.6% Now married2.4% Separated0.2% Widowed6.8% DivorcedWomen who gave birth in the past 12 months Now married:
100.0% (39)Unmarried:
0.0% (0)
Women who did not give birth in the past 12 months Now married:
30.9% (452)Unmarried:
69.1% (1,010)
Marital status - White alone, not Hispanic / Latino population 15 years and over
Males 29.3% Never married56.1% Now married1.7% Separated2.9% Widowed10.0% DivorcedFemales 22.1% Never married54.2% Now married1.7% Separated8.5% Widowed13.5% DivorcedWomen who gave birth in the past 12 months Now married:
48.9% (201)Unmarried:
51.1% (210)
Women who did not give birth in the past 12 months Now married:
56.2% (2,849)Unmarried:
43.8% (2,219)
Marital status - Hispanic or Latino population 15 years and over
Males 45.3% Never married44.8% Now married1.3% Separated0.6% Widowed8.0% DivorcedFemales 37.2% Never married51.4% Now married1.9% Separated3.3% Widowed6.2% DivorcedWomen who gave birth in the past 12 months Now married:
87.3% (221)Unmarried:
12.7% (32)
Women who did not give birth in the past 12 months Now married:
44.3% (1,344)Unmarried:
55.7% (1,691)
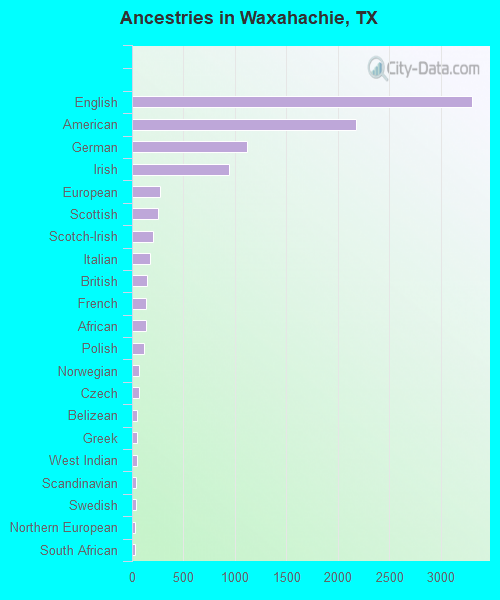
Ancestries in Waxahachie
3,306 15.0% English2,177 9.9% American1,114 5.1% German948 4.3% Irish275 1.2% European254 1.2% Scottish201 0.9% Scotch-Irish171 0.8% Italian144 0.7% British134 0.6% French133 0.6% African112 0.5% Polish70 0.3% Norwegian65 0.3% Czech51 0.2% Belizean49 0.2% Greek48 0.2% West Indian41 0.2% Scandinavian39 0.2% Swedish32 0.1% Northern European31 0.1% South African28 0.1% Haitian18 0.08% British West Indian15 0.07% Lebanese12 0.05% Dutch12 0.05% Eastern European11 0.05% Brazilian11 0.05% Portuguese10 0.05% Danish10 0.05% Hungarian8 0.04% Arab8 0.04% Russian3 0.01% French Canadian
Geographical mobility in Waxahachie Same house 1 year ago 21,068 80.5% White (Caucasian)7,571 85.6% Black or African American242 96.1% American Indian / Alaska Native405 97.2% Asian144 98.2% Native Hawaiian / Pacific Islander2,198 83.5% Other race6,131 94.7% Two or more races18,710 81.9% White alone, not Hispanic / Latino9,158 83.5% Hispanic or LatinoMoved within same county 2,871 11.0% White / Caucasian581 6.6% Black or African American4 1.4% American Indian / Alaska Native264 10.0% Other race337 5.2% Two or more races2,002 8.8% White alone, not Hispanic / Latino1,309 11.9% Hispanic or LatinoMoved within same state 1,618 6.2% White / Caucasian788 8.9% Black or African American10 4.1% American Indian / Alaska Native9 2.3% Asian112 4.2% Other race58 0.9% Two or more races1,440 6.3% White alone, not Hispanic / Latino354 3.2% Hispanic or LatinoMoved from different state 627 2.4% White / Caucasian126 1.4% Black or African American42 1.6% Other race26 0.4% Two or more races625 2.7% White alone, not Hispanic / Latino111 1.0% Hispanic or LatinoMoved from abroad 13 0.0% White8 0.1% Two or more races15 0.1% White alone, not Hispanic / Latino5 0.0% Hispanic or Latino
Children Nativity (place of birth) in Waxahachie
Children under 6 years - Living with two parents Both parents native 2,117 100.0% NativeBoth parents foreign-born 50 100.0% NativeOne native, one foreign-born parent 238 100.0% NativeChildren under 6 years - Living with one parent Native parent 1,445 100.0% NativeChildren 6 to 17 years - Living with two parents Both parents native 3,433 100.0% NativeBoth parents foreign-born 606 100.0% NativeOne native, one foreign-born parent 441 100.0% NativeChildren 6 to 17 years - Living with one parent Native parent 3,137 100.0% NativeForeign-born parent 123 49.9% Native124 50.1% Foreign-born
Grandparents responsible for own grandchildren in Waxahachie
Grandparents (30 to 59 years) White / Caucasian 77 16.4% Responsible for grandchildren391 83.6% Not responsible for grandchildrenBlack or African American 35 100.0% Responsible for grandchildrenTwo or more races 23 100.0% Not responsible for grandchildrenWhite alone, not Hispanic / Latino 74 27.1% Responsible for grandchildren198 72.9% Not responsible for grandchildrenHispanic or Latino 152 100.0% Not responsible for grandchildrenGrandparents (60 years and over) White / Caucasian 42 21.2% Responsible for grandchildren156 78.8% Not responsible for grandchildrenBlack or African American 52 100.0% Not responsible for grandchildrenTwo or more races 30 100.0% Not responsible for grandchildrenWhite alone, not Hispanic / Latino 56 24.6% Responsible for grandchildren171 75.4% Not responsible for grandchildrenHispanic or Latino 77 100.0% Not responsible for grandchildren