Races in Waynesboro, Virginia (VA) Detailed Stats
Data:
Races - White alone (%)
Races - White alone (% change since 2000)
Races - Black alone (%)
Races - Black alone (% change since 2000)
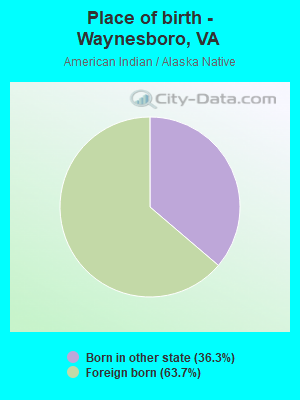
Races - American Indian alone (%)
Races - American Indian alone (% change since 2000)
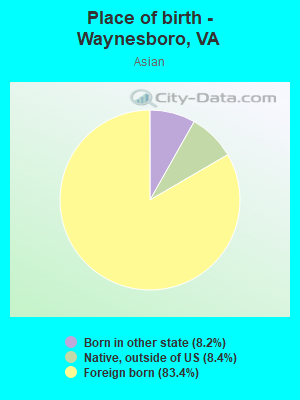
Races - Asian alone (%)
Races - Asian alone (% change since 2000)
Races - Hispanic (%)
Races - Hispanic (% change since 2000)
Races - Native Hawaiian and Other Pacific Islander alone (%)
Races - Native Hawaiian and Other Pacific Islander alone (% change since 2000)
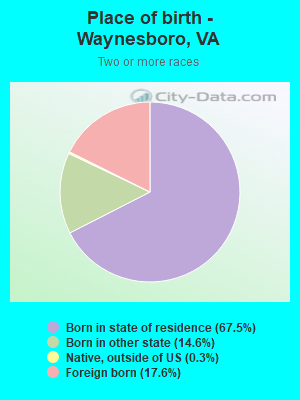
Races - Two or more races(%)
Races - Two or more races(% change since 2000)
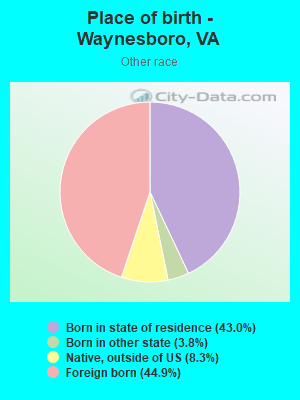
Races - Other race alone (%)
Races - Other race alone (% change since 2000)
Racial diversity
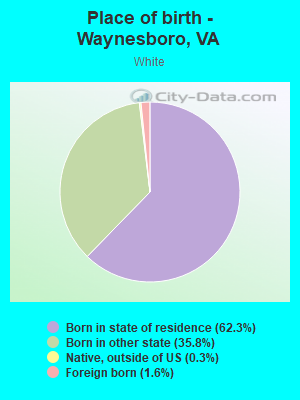
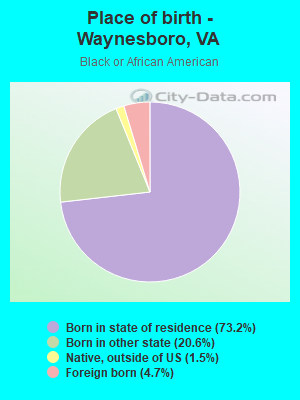
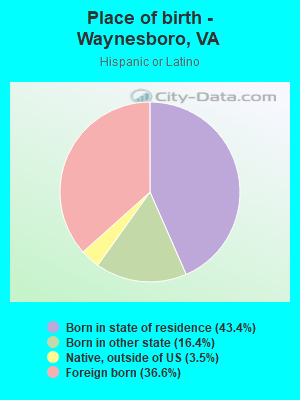
Place of birth - Born in state of residence (%)
Place of birth - Born in state of residence (%) - White
Place of birth - Born in state of residence (%) - Black or African American
Place of birth - Born in state of residence (%) - Asian
Place of birth - Born in state of residence (%) - Hispanic or Latino
Place of birth - Born in state of residence (%) - American Indian and Alaska Native
Place of birth - Born in state of residence (%) - Multirace
Place of birth - Born in state of residence (%) - Other Race
Place of birth - Born in other state (%)
Place of birth - Born in other state (%) - White
Place of birth - Born in other state (%) - Black or African American
Place of birth - Born in other state (%) - Asian
Place of birth - Born in other state (%) - Hispanic or Latino
Place of birth - Born in other state (%) - American Indian and Alaska Native
Place of birth - Born in other state (%) - Multirace
Place of birth - Born in other state (%) - Other Race
Place of birth - Native, outside of US (%)
Place of birth - Native, outside of US (%) - White
Place of birth - Native, outside of US (%) - Black or African American
Place of birth - Native, outside of US (%) - Asian
Place of birth - Native, outside of US (%) - Hispanic or Latino
Place of birth - Native, outside of US (%) - American Indian and Alaska Native
Place of birth - Native, outside of US (%) - Multirace
Place of birth - Native, outside of US (%) - Other Race
Place of birth - Foreign born (%)
Place of birth - Foreign born (%) - White
Place of birth - Foreign born (%) - Black or African American
Place of birth - Foreign born (%) - Asian
Place of birth - Foreign born (%) - Hispanic or Latino
Place of birth - Foreign born (%) - American Indian and Alaska Native
Place of birth - Foreign born (%) - Multirace
Place of birth - Foreign born (%) - Other Race
Residents speaking English at home (%)
Residents speaking English at home - Born in the United States (%)
Residents speaking English at home - Native, born elsewhere (%)
Residents speaking English at home - Foreign born (%)
Residents speaking Spanish at home (%)
Residents speaking Spanish at home - Born in the United States (%)
Residents speaking Spanish at home - Native, born elsewhere (%)
Residents speaking Spanish at home - Foreign born (%)
Residents speaking other language at home (%)
Residents speaking other language at home - Born in the United States (%)
Residents speaking other language at home - Native, born elsewhere (%)
Residents speaking other language at home - Foreign born (%)
Marital status - Never married (%)
Marital status - Now married (%)
Marital status - Separated (%)
Marital status - Widowed (%)
Marital status - Divorced (%)
Ancestries Reported - Arab (%)
Ancestries Reported - Czech (%)
Ancestries Reported - Danish (%)
Ancestries Reported - Dutch (%)
Ancestries Reported - English (%)
Ancestries Reported - French (%)
Ancestries Reported - French Canadian (%)
Ancestries Reported - German (%)
Ancestries Reported - Greek (%)
Ancestries Reported - Hungarian (%)
Ancestries Reported - Irish (%)
Ancestries Reported - Italian (%)
Ancestries Reported - Lithuanian (%)
Ancestries Reported - Norwegian (%)
Ancestries Reported - Polish (%)
Ancestries Reported - Portuguese (%)
Ancestries Reported - Russian (%)
Ancestries Reported - Scotch-Irish (%)
Ancestries Reported - Scottish (%)
Ancestries Reported - Slovak (%)
Ancestries Reported - Subsaharan African (%)
Ancestries Reported - Swedish (%)
Ancestries Reported - Swiss (%)
Ancestries Reported - Ukrainian (%)
Ancestries Reported - United States (%)
Ancestries Reported - Welsh (%)
Ancestries Reported - West Indian (%)
Ancestries Reported - Other (%)
Geographical mobility - Same house 1 year ago (%)
Geographical mobility - Same house 1 year ago (%) - White
Geographical mobility - Same house 1 year ago (%) - Black or African American
Geographical mobility - Same house 1 year ago (%) - Asian
Geographical mobility - Same house 1 year ago (%) - Hispanic or Latino
Geographical mobility - Same house 1 year ago (%) - American Indian and Alaska Native
Geographical mobility - Same house 1 year ago (%) - Multirace
Geographical mobility - Same house 1 year ago (%) - Other Race
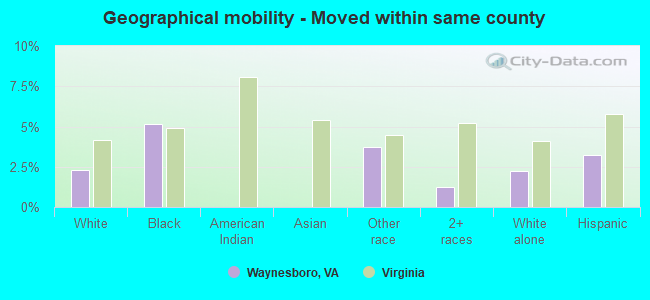
Geographical mobility - Moved within same county (%)
Geographical mobility - Moved within same county (%) - White
Geographical mobility - Moved within same county (%) - Black or African American
Geographical mobility - Moved within same county (%) - Asian
Geographical mobility - Moved within same county (%) - Hispanic or Latino
Geographical mobility - Moved within same county (%) - American Indian and Alaska Native
Geographical mobility - Moved within same county (%) - Multirace
Geographical mobility - Moved within same county (%) - Other Race
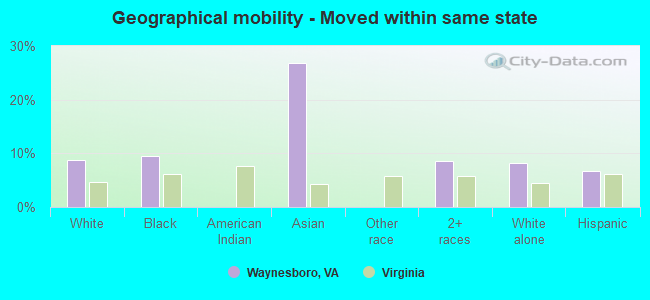
Geographical mobility - Moved from different county within same state (%)
Geographical mobility - Moved from different county within same state (%) - White
Geographical mobility - Moved from different county within same state (%) - Black or African American
Geographical mobility - Moved from different county within same state (%) - Asian
Geographical mobility - Moved from different county within same state (%) - Hispanic or Latino
Geographical mobility - Moved from different county within same state (%) - American Indian and Alaska Native
Geographical mobility - Moved from different county within same state (%) - Multirace
Geographical mobility - Moved from different county within same state (%) - Other Race
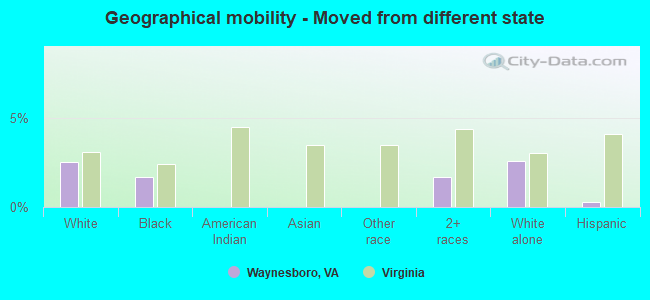
Geographical mobility - Moved from different state (%)
Geographical mobility - Moved from different state (%) - White
Geographical mobility - Moved from different state (%) - Black or African American
Geographical mobility - Moved from different state (%) - Asian
Geographical mobility - Moved from different state (%) - Hispanic or Latino
Geographical mobility - Moved from different state (%) - American Indian and Alaska Native
Geographical mobility - Moved from different state (%) - Multirace
Geographical mobility - Moved from different state (%) - Other Race
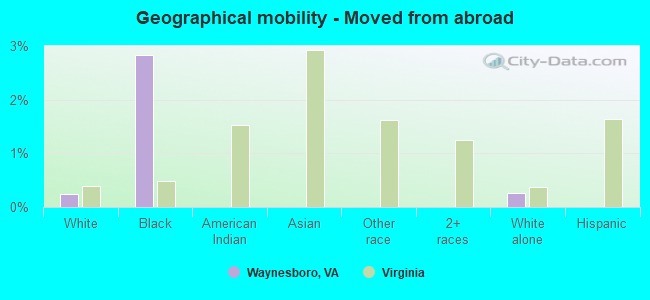
Geographical mobility - Moved from abroad (%)
Geographical mobility - Moved from abroad (%) - White
Geographical mobility - Moved from abroad (%) - Black or African American
Geographical mobility - Moved from abroad (%) - Asian
Geographical mobility - Moved from abroad (%) - Hispanic or Latino
Geographical mobility - Moved from abroad (%) - American Indian and Alaska Native
Geographical mobility - Moved from abroad (%) - Multirace
Geographical mobility - Moved from abroad (%) - Other Race
Place of birth for the foreign-born population - Ireland (%)
Place of birth for the foreign-born population - Denmark (%)
Place of birth for the foreign-born population - Norway (%)
Place of birth for the foreign-born population - Sweden (%)
Place of birth for the foreign-born population - United Kingdom (%)
Place of birth for the foreign-born population - England (%)
Place of birth for the foreign-born population - Scotland (%)
Place of birth for the foreign-born population - Other Northern Europe (%)
Place of birth for the foreign-born population - Austria (%)
Place of birth for the foreign-born population - Belgium (%)
Place of birth for the foreign-born population - France (%)
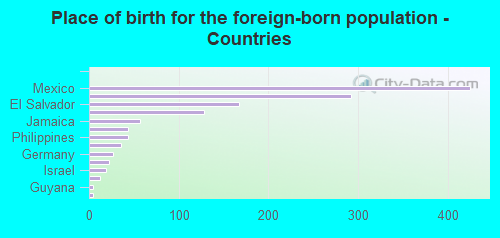
Place of birth for the foreign-born population - Germany (%)
Place of birth for the foreign-born population - Netherlands (%)
Place of birth for the foreign-born population - Switzerland (%)
Place of birth for the foreign-born population - Other Western Europe (%)
Place of birth for the foreign-born population - Greece (%)
Place of birth for the foreign-born population - Italy (%)
Place of birth for the foreign-born population - Portugal (%)
Place of birth for the foreign-born population - Spain (%)
Place of birth for the foreign-born population - Other Southern Europe (%)
Place of birth for the foreign-born population - Albania (%)
Place of birth for the foreign-born population - Belarus (%)
Place of birth for the foreign-born population - Bosnia and Herzegovina (%)
Place of birth for the foreign-born population - Bulgaria (%)
Place of birth for the foreign-born population - Croatia (%)
Place of birth for the foreign-born population - Czechoslovakia (%)
Place of birth for the foreign-born population - Hungary (%)
Place of birth for the foreign-born population - Latvia (%)
Place of birth for the foreign-born population - Lithuania (%)
Place of birth for the foreign-born population - North Macedonia (Macedonia) (%)
Place of birth for the foreign-born population - Moldova (%)
Place of birth for the foreign-born population - Poland (%)
Place of birth for the foreign-born population - Romania (%)
Place of birth for the foreign-born population - Russia (%)
Place of birth for the foreign-born population - Serbia (%)
Place of birth for the foreign-born population - Ukraine (%)
Place of birth for the foreign-born population - Other Eastern Europe (%)
Place of birth for the foreign-born population - China (%)
Place of birth for the foreign-born population - Hong Kong (%)
Place of birth for the foreign-born population - Taiwan (%)
Place of birth for the foreign-born population - Japan (%)
Place of birth for the foreign-born population - Korea (%)
Place of birth for the foreign-born population - Other Eastern Asia (%)
Place of birth for the foreign-born population - Afghanistan (%)
Place of birth for the foreign-born population - Bangladesh (%)
Place of birth for the foreign-born population - India (%)
Place of birth for the foreign-born population - Iran (%)
Place of birth for the foreign-born population - Kazakhstan (%)
Place of birth for the foreign-born population - Nepal (%)
Place of birth for the foreign-born population - Pakistan (%)
Place of birth for the foreign-born population - Sri Lanka (%)
Place of birth for the foreign-born population - Uzbekistan (%)
Place of birth for the foreign-born population - Other South Central Asia (%)
Place of birth for the foreign-born population - Burma (%)
Place of birth for the foreign-born population - Cambodia (%)
Place of birth for the foreign-born population - Indonesia (%)
Place of birth for the foreign-born population - Laos (%)
Place of birth for the foreign-born population - Malaysia (%)
Place of birth for the foreign-born population - Philippines (%)
Place of birth for the foreign-born population - Singapore (%)
Place of birth for the foreign-born population - Thailand (%)
Place of birth for the foreign-born population - Vietnam (%)
Place of birth for the foreign-born population - Other South Eastern Asia (%)
Place of birth for the foreign-born population - Armenia (%)
Place of birth for the foreign-born population - Iraq (%)
Place of birth for the foreign-born population - Israel (%)
Place of birth for the foreign-born population - Jordan (%)
Place of birth for the foreign-born population - Kuwait (%)
Place of birth for the foreign-born population - Lebanon (%)
Place of birth for the foreign-born population - Saudi Arabia (%)
Place of birth for the foreign-born population - Syria (%)
Place of birth for the foreign-born population - Turkey (%)
Place of birth for the foreign-born population - Yemen (%)
Place of birth for the foreign-born population - Other Western Asia (%)
Place of birth for the foreign-born population - Eritrea (%)
Place of birth for the foreign-born population - Ethiopia (%)
Place of birth for the foreign-born population - Kenya (%)
Place of birth for the foreign-born population - Somalia (%)
Place of birth for the foreign-born population - Uganda (%)
Place of birth for the foreign-born population - Zimbabwe (%)
Place of birth for the foreign-born population - Other Eastern Africa (%)
Place of birth for the foreign-born population - Cameroon (%)
Place of birth for the foreign-born population - Congo (%)
Place of birth for the foreign-born population - Democratic Republic of Congo (Zaire) (%)
Place of birth for the foreign-born population - Other Middle Africa (%)
Place of birth for the foreign-born population - Egypt (%)
Place of birth for the foreign-born population - Morocco (%)
Place of birth for the foreign-born population - Sudan (%)
Place of birth for the foreign-born population - Other Northern Africa (%)
Place of birth for the foreign-born population - South Africa (%)
Place of birth for the foreign-born population - Other Southern Africa (%)
Place of birth for the foreign-born population - Cabo Verde (%)
Place of birth for the foreign-born population - Ghana (%)
Place of birth for the foreign-born population - Liberia (%)
Place of birth for the foreign-born population - Nigeria (%)
Place of birth for the foreign-born population - Senegal (%)
Place of birth for the foreign-born population - Sierra Leone (%)
Place of birth for the foreign-born population - Other Western Africa (%)
Place of birth for the foreign-born population - Australia (%)
Place of birth for the foreign-born population - New Zealand (%)
Place of birth for the foreign-born population - Fiji (%)
Place of birth for the foreign-born population - Micronesia (%)
Place of birth for the foreign-born population - Bahamas (%)
Place of birth for the foreign-born population - Barbados (%)
Place of birth for the foreign-born population - Cuba (%)
Place of birth for the foreign-born population - Dominica (%)
Place of birth for the foreign-born population - Dominican Republic (%)
Place of birth for the foreign-born population - Grenada (%)
Place of birth for the foreign-born population - Haiti (%)
Place of birth for the foreign-born population - Jamaica (%)
Place of birth for the foreign-born population - St. Vincent and the Grenadines (%)
Place of birth for the foreign-born population - Trinidad and Tobago (%)
Place of birth for the foreign-born population - West Indies (%)
Place of birth for the foreign-born population - Other Caribbean (%)
Place of birth for the foreign-born population - Belize (%)
Place of birth for the foreign-born population - Costa Rica (%)
Place of birth for the foreign-born population - El Salvador (%)
Place of birth for the foreign-born population - Guatemala (%)
Place of birth for the foreign-born population - Honduras (%)
Place of birth for the foreign-born population - Mexico (%)
Place of birth for the foreign-born population - Nicaragua (%)
Place of birth for the foreign-born population - Panama (%)
Place of birth for the foreign-born population - Other Central America (%)
Place of birth for the foreign-born population - Argentina (%)
Place of birth for the foreign-born population - Bolivia (%)
Place of birth for the foreign-born population - Brazil (%)
Place of birth for the foreign-born population - Chile (%)
Place of birth for the foreign-born population - Colombia (%)
Place of birth for the foreign-born population - Ecuador (%)
Place of birth for the foreign-born population - Guyana (%)
Place of birth for the foreign-born population - Peru (%)
Place of birth for the foreign-born population - Uruguay (%)
Place of birth for the foreign-born population - Venezuela (%)
Place of birth for the foreign-born population - Other South America (%)
Place of birth for the foreign-born population - Canada (%)
Place of birth for the foreign-born population - Other Northern America (%)
Place of birth for the foreign-born population - Other (%)
Latest news about races in Waynesboro, VA collected exclusively by city-data.com from local newspapers, TV, and radio stations
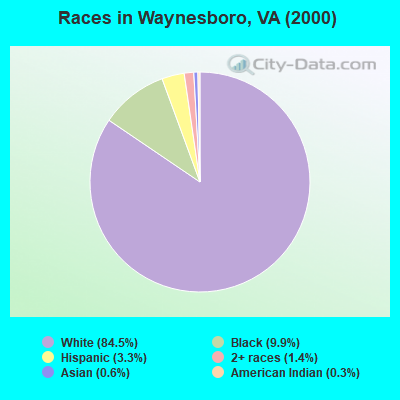
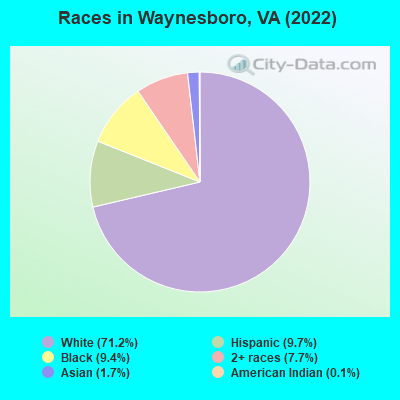
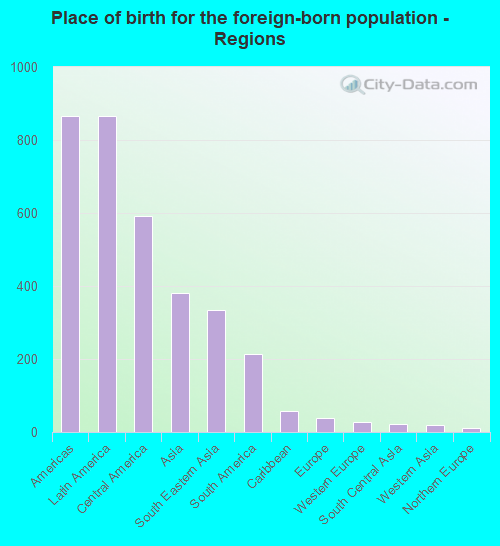
According to 2022 data, the most numerous races in Waynesboro, VA are White alone (16,019 residents), Black alone (2,123 residents), and Hispanic (2,172 residents). 91.1% of Waynesboro residents speak English at home. 5.7% of Waynesboro, VA residents are foreign-born (3.8% born in Latin America, 1.7% born in Asia), which is 110.2% less than the foreign-born rate of 12.0% across the entire state of Virginia.
Race distribution in Waynesboro
2000 2022
4,965,637 70.2% White alone 1,376,378 19.4% Black alone 329,540 4.7% Hispanic 259,277 3.7% Asian alone 114,022 1.6% Two or more races 18,596 0.3% American Indian alone 11,685 0.2% Other race alone 3,380 0.05% Native Hawaiian and Other
5,095,130 58.7% White alone 1,594,785 18.4% Black alone 905,750 10.4% Hispanic 602,881 6.9% Asian alone 406,047 4.7% Two or more races 60,419 0.7% Other race alone 11,738 0.1% American Indian alone 6,869 0.08% Native Hawaiian and Other
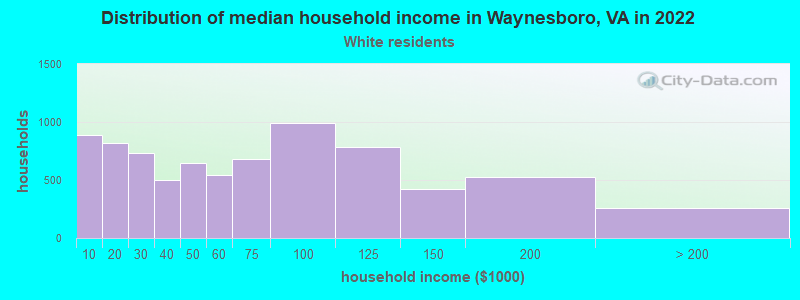
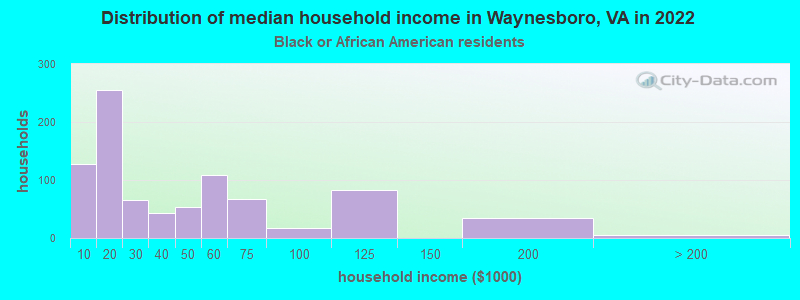
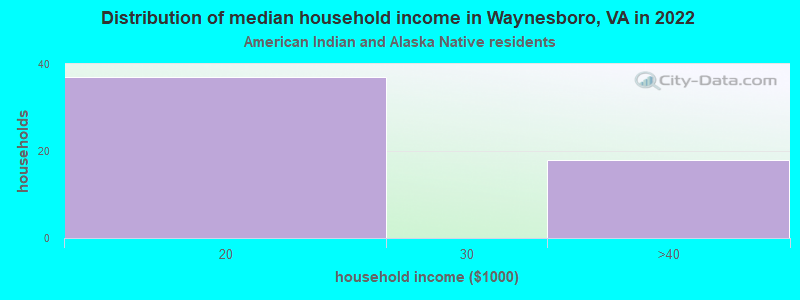
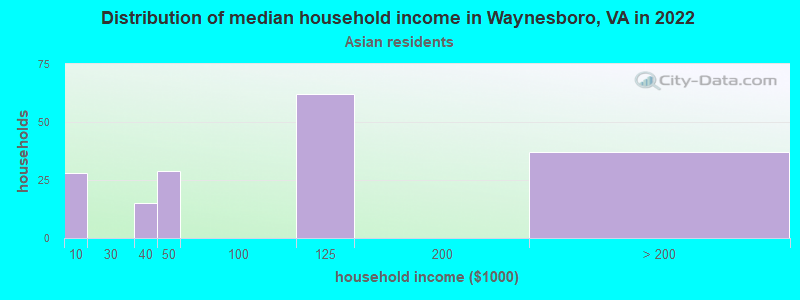
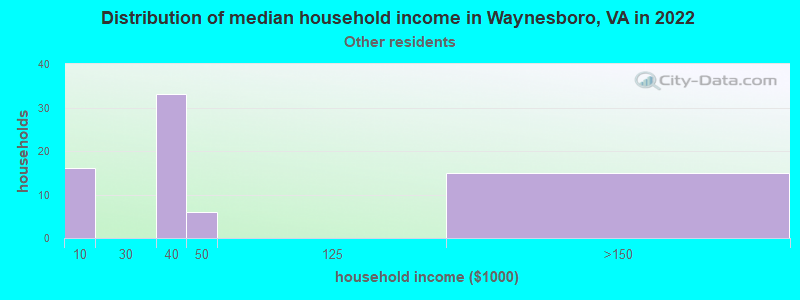
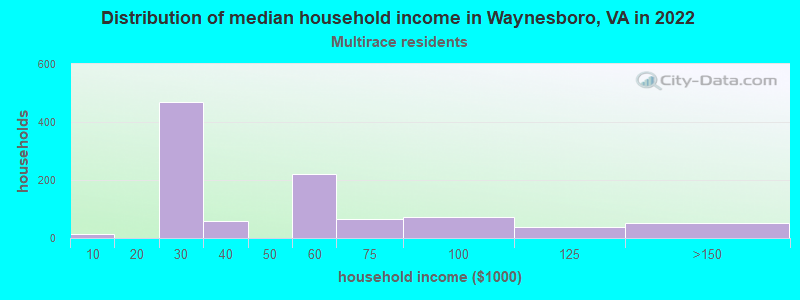
Income and house value in Waynesboro Median household income in 2022 $59,480 White non-Hispanic householders$45,935 Black householders$103,136 Asian householders$25,154 Two or more races householders$62,888 Hispanic or Latino race householdersMedian 2022 house value $256,514 White Non-Hispanic householders$187,345 Black or African American householders$315,042 Some other race householders$194,066 Two or more races householders$415,576 Hispanic or Latino householders
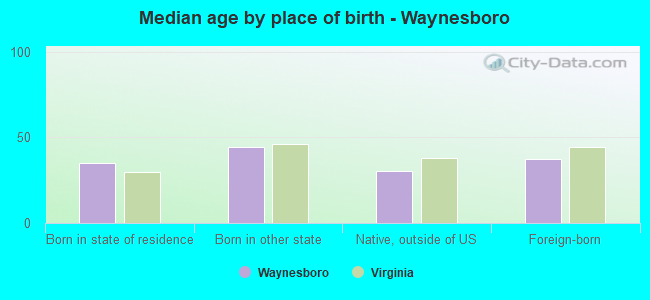
Median age by race in Waynesboro
43.6 Median age for White residents41.6 45.7 35.2 Median age for Black or African American residents35.0 37.3 61.4 Median age for American Indian / Alaska Native residents-530,549,110.1 132.4 33.2 Median age for Asian residents32.2 30.7 -611,955,419.9 Median age for Native Hawaiian / Pacific Islander residents-666,666,666.0 -714,150,046.8 26.5 Median age for Other race residents29.1 25.2 36.3 Median age for Two or more races residents30.6 27.6 44.1 Median age for White alone residents41.5 45.9 29.1 Median age for Hispanic or Latino residents31.9 28.1
Owner/renter occupied households by race in Waynesboro
House owners and renters - White residents 4,798 61.1% Owner occupied3,061 38.9% Renter occupiedHouse owners and renters - Black or African American residents 272 22.4% Owner occupied945 77.6% Renter occupiedHouse owners and renters - American Indian / Alaska Native residents 66 100.0% Renter occupiedHouse owners and renters - Asian residents 62 37.9% Owner occupied101 62.1% Renter occupiedHouse owners and renters - Other race residents 15 21.2% Owner occupied54 78.8% Renter occupiedHouse owners and renters - Two or more races residents 651 72.1% Owner occupied251 27.9% Renter occupiedHouse owners and renters - White alone residents 4,730 61.3% Owner occupied2,986 38.7% Renter occupiedHouse owners and renters - Hispanic or Latino residents 509 46.8% Owner occupied579 53.2% Renter occupied
Language usage in Waynesboro
English speakers - Total 91.1% of residents of Waynesboro speak English at home.
6.6% of residents speak Spanish at home 851 60.7% Speak English very well550 39.3% Speak English less than very well2.0% of residents speak other language at home 109 25.4% Speak English very well320 74.6% Speak English less than very well
English speakers - Born in the United States 95.3% of residents of Waynesboro speak English at home.
3.9% of residents speak Spanish at home 245 96.1% Speak English very well10 3.9% Speak English less than very well0.7% of residents speak other language at home 43 100.0% Speak English very well
English speakers - Native, born elsewhere 31.8% of residents of Waynesboro speak English at home.
38.7% of residents speak Spanish at home 35 52.2% Speak English very well32 47.8% Speak English less than very well29.5% of residents speak other language at home 43 84.3% Speak English very well8 15.7% Speak English less than very well
English speakers - Foreign-born 9.4% of residents of Waynesboro speak English at home.
63.5% of residents speak Spanish at home 329 41.0% Speak English very well473 59.0% Speak English less than very well26.7% of residents speak other language at home 26 7.7% Speak English very well311 92.3% Speak English less than very well
White (Caucasian) - Speak only English Native:
99.1% (15,210)Foreign-born:
12.4% (33)
White (Caucasian) - Speak another language Native:
1.4% (218)Foreign-born:
83.8% (225)
Black or African American - Speak only English Native:
98.7% (1,974)Foreign-born:
89.0% (34)
Asian - Speak only English Native:
85.0% (57)Foreign-born:
13.9% (47)
Asian - Speak another language Native:
8.7% (6)Foreign-born:
86.0% (293)
Other race - Speak another language Native:
93.1% (260)Foreign-born:
98.4% (257)
Two or more races - Speak another language Native:
9.9% (211)Foreign-born:
100.0% (360)
White alone - Speak only English Native:
99.0% (15,001)Foreign-born:
85.4% (35)
White alone - Speak another language Native:
1.1% (163)Foreign-born:
9.6% (4)
Hispanic or Latino - Speak another language Native:
33.9% (440)Foreign-born:
100.0% (876)
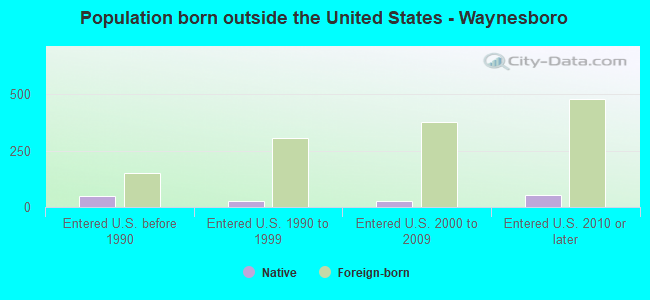
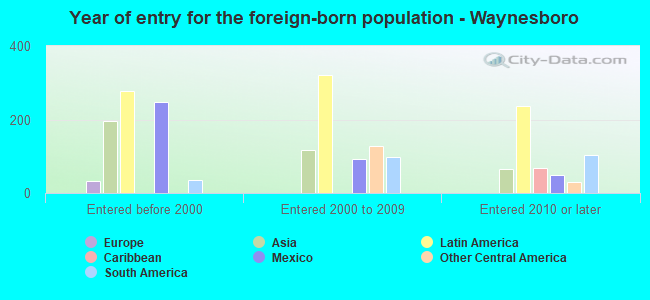
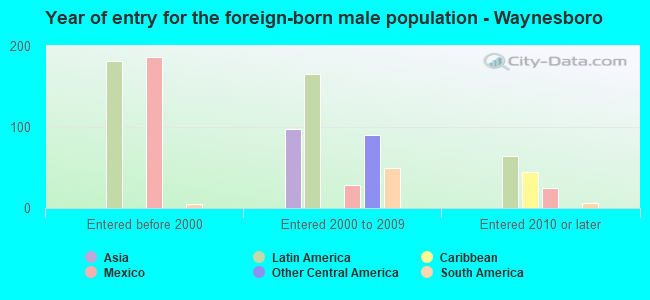
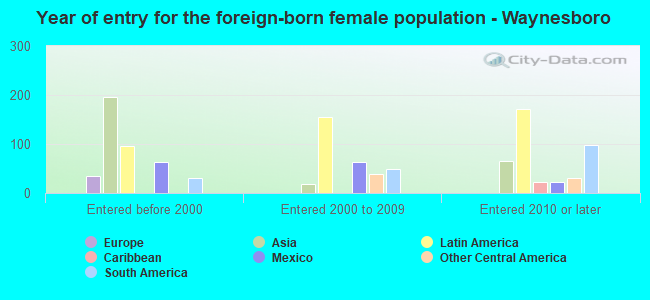
Foreign-born residents in Waynesboro 1,286 residents are foreign born (3.8% Latin America , 1.7% Asia ).
This city:
5.7%Virginia:
12.6%
Marital status for residents in Waynesboro Marital status - White (Caucasian) population 15 years and over
Males 33.3% Never married47.0% Now married1.1% Separated4.3% Widowed14.3% DivorcedFemales 26.7% Never married41.3% Now married2.1% Separated12.3% Widowed17.6% DivorcedWomen who gave birth in the past 12 months Now married:
33.0% (34)Unmarried:
67.0% (69)
Women who did not give birth in the past 12 months Now married:
47.4% (1,627)Unmarried:
52.6% (1,805)
Marital status - Black or African American population 15 years and over
Males 54.9% Never married23.8% Now married0.0% Separated2.1% Widowed19.2% DivorcedFemales 41.3% Never married10.7% Now married0.0% Separated11.9% Widowed36.1% DivorcedWomen who did not give birth in the past 12 months Now married:
8.7% (45)Unmarried:
91.3% (479)
Marital status - American Indian / Alaska Native population 15 years and over
Males 0.0% Never married0.0% Now married0.0% Separated100.0% Widowed0.0% DivorcedFemales 33.3% Never married0.0% Now married0.0% Separated0.0% Widowed66.7% DivorcedWomen who did not give birth in the past 12 months Now married:
0.0% (0)Unmarried:
100.0% (19)
Marital status - Asian population 15 years and over
Males 100.0% Never married0.0% Now married0.0% Separated0.0% Widowed0.0% DivorcedFemales 21.0% Never married64.0% Now married0.0% Separated15.1% Widowed0.0% DivorcedWomen who did not give birth in the past 12 months Now married:
58.4% (83)Unmarried:
41.6% (59)
Marital status - Other race population 15 years and over
Males 18.9% Never married54.4% Now married0.0% Separated17.8% Widowed8.9% DivorcedFemales 38.6% Never married61.4% Now married0.0% Separated0.0% Widowed0.0% DivorcedWomen who gave birth in the past 12 months Now married:
0.0% (0)Unmarried:
100.0% (14)
Women who did not give birth in the past 12 months Now married:
64.1% (162)Unmarried:
35.9% (91)
Marital status - Two or more races population 15 years and over
Males 60.2% Never married28.7% Now married11.1% Separated0.0% Widowed0.0% DivorcedFemales 79.3% Never married14.6% Now married1.1% Separated1.1% Widowed3.8% DivorcedWomen who gave birth in the past 12 months Now married:
25.0% (10)Unmarried:
75.0% (29)
Women who did not give birth in the past 12 months Now married:
12.6% (112)Unmarried:
87.4% (781)
Marital status - White alone, not Hispanic / Latino population 15 years and over
Males 32.9% Never married47.2% Now married1.2% Separated4.2% Widowed14.6% DivorcedFemales 25.4% Never married41.6% Now married2.2% Separated12.7% Widowed18.1% DivorcedWomen who gave birth in the past 12 months Now married:
41.7% (35)Unmarried:
58.3% (48)
Women who did not give birth in the past 12 months Now married:
49.0% (1,640)Unmarried:
51.0% (1,708)
Marital status - Hispanic or Latino population 15 years and over
Males 44.5% Never married42.5% Now married0.0% Separated5.4% Widowed7.5% DivorcedFemales 58.1% Never married36.6% Now married0.0% Separated0.0% Widowed5.2% DivorcedWomen who gave birth in the past 12 months Now married:
0.0% (0)Unmarried:
100.0% (35)
Women who did not give birth in the past 12 months Now married:
34.1% (202)Unmarried:
65.9% (389)
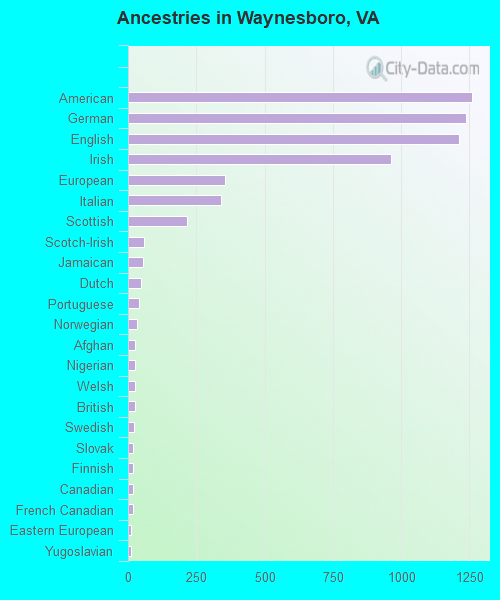
Ancestries in Waynesboro
1,259 12.9% American1,236 12.7% German1,213 12.4% English962 9.9% Irish357 3.7% European340 3.5% Italian217 2.2% Scottish58 0.6% Scotch-Irish54 0.6% Jamaican46 0.5% Dutch39 0.4% Portuguese34 0.3% Norwegian27 0.3% Afghan27 0.3% Nigerian25 0.3% Welsh24 0.2% British22 0.2% Swedish20 0.2% Slovak18 0.2% Finnish17 0.2% Canadian17 0.2% French Canadian12 0.1% Eastern European12 0.1% Yugoslavian9 0.09% Scandinavian7 0.07% Polish6 0.06% Northern European2 0.02% Latvian
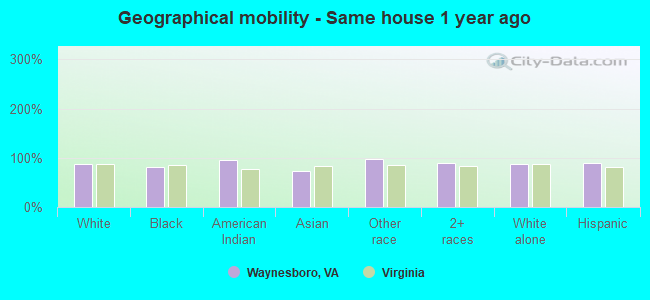
Geographical mobility in Waynesboro Same house 1 year ago 14,436 87.0% White (Caucasian)1,884 81.2% Black or African American69 96.1% American Indian / Alaska Native301 73.7% Asian574 97.1% Other race2,303 88.7% Two or more races14,069 87.5% White alone, not Hispanic / Latino1,908 90.0% Hispanic or LatinoMoved within same county 379 2.3% White / Caucasian120 5.2% Black or African American22 3.7% Other race32 1.2% Two or more races359 2.2% White alone, not Hispanic / Latino69 3.2% Hispanic or LatinoMoved within same state 1,451 8.8% White / Caucasian222 9.6% Black or African American110 26.9% Asian224 8.6% Two or more races1,313 8.2% White alone, not Hispanic / Latino142 6.7% Hispanic or LatinoMoved from different state 420 2.5% White / Caucasian39 1.7% Black or African American43 1.7% Two or more races415 2.6% White alone, not Hispanic / Latino6 0.3% Hispanic or LatinoMoved from abroad 40 0.2% White66 2.8% Black or African American42 0.3% White alone, not Hispanic / Latino
Children Nativity (place of birth) in Waynesboro
Children under 6 years - Living with two parents Both parents native 715 99.5% Native4 0.5% Foreign-bornBoth parents foreign-born 65 100.0% NativeOne native, one foreign-born parent 11 33.1% Native22 66.9% Foreign-bornChildren under 6 years - Living with one parent Native parent 861 100.0% NativeForeign-born parent 7 100.0% NativeChildren 6 to 17 years - Living with two parents Both parents native 1,386 100.0% NativeBoth parents foreign-born 83 68.7% Native38 31.3% Foreign-bornOne native, one foreign-born parent 17 100.0% NativeChildren 6 to 17 years - Living with one parent Native parent 1,533 100.0% NativeForeign-born parent 93 51.5% Native87 48.5% Foreign-born
Grandparents responsible for own grandchildren in Waynesboro
Grandparents (30 to 59 years) White / Caucasian 20 16.8% Responsible for grandchildren100 83.2% Not responsible for grandchildrenBlack or African American 34 100.0% Not responsible for grandchildrenOther race 23 100.0% Not responsible for grandchildrenTwo or more races 70 100.0% Responsible for grandchildrenWhite alone, not Hispanic / Latino 7 7.1% Responsible for grandchildren87 92.9% Not responsible for grandchildrenHispanic or Latino 36 49.1% Responsible for grandchildren38 50.9% Not responsible for grandchildrenGrandparents (60 years and over) White / Caucasian 67 25.5% Responsible for grandchildren197 74.5% Not responsible for grandchildrenOther race 25 100.0% Not responsible for grandchildrenTwo or more races 21 100.0% Responsible for grandchildrenWhite alone, not Hispanic / Latino 68 30.3% Responsible for grandchildren157 69.7% Not responsible for grandchildrenHispanic or Latino 21 21.8% Responsible for grandchildren74 78.2% Not responsible for grandchildren