Races in Webster City, Iowa (IA) Detailed Stats
Data:
Races - White alone (%)
Races - White alone (% change since 2000)
Races - Black alone (%)
Races - Black alone (% change since 2000)
Races - American Indian alone (%)
Races - American Indian alone (% change since 2000)
Races - Asian alone (%)
Races - Asian alone (% change since 2000)
Races - Hispanic (%)
Races - Hispanic (% change since 2000)
Races - Native Hawaiian and Other Pacific Islander alone (%)
Races - Native Hawaiian and Other Pacific Islander alone (% change since 2000)
Races - Two or more races(%)
Races - Two or more races(% change since 2000)
Races - Other race alone (%)
Races - Other race alone (% change since 2000)
Racial diversity
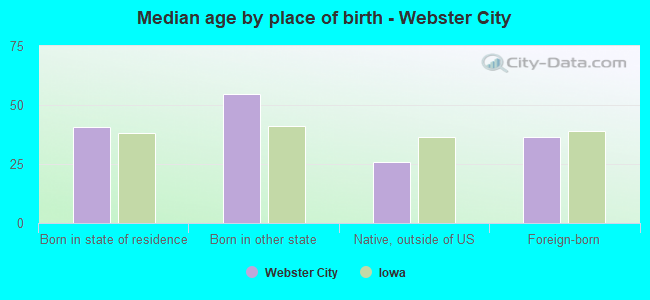
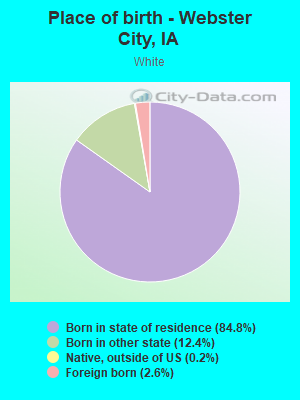
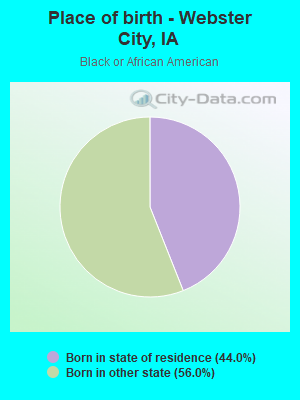
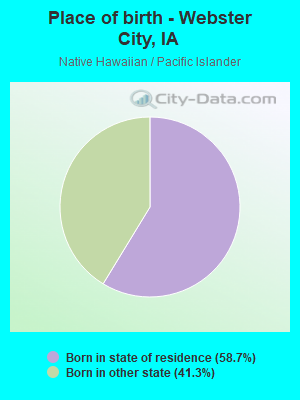
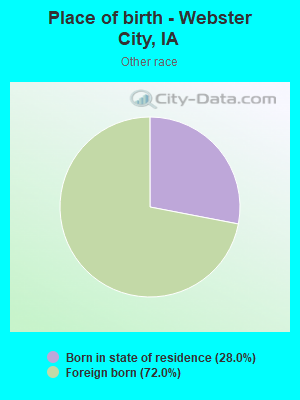
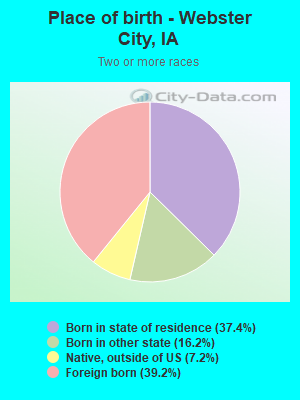
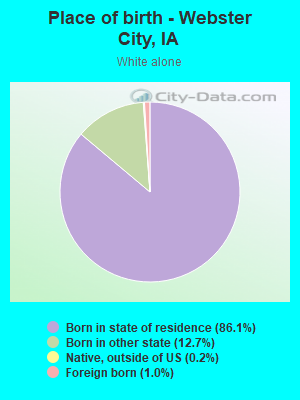
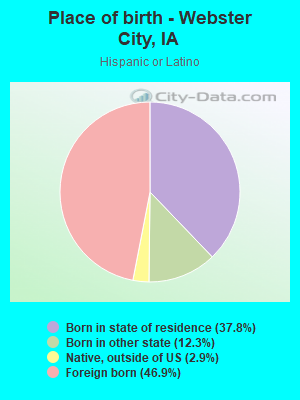
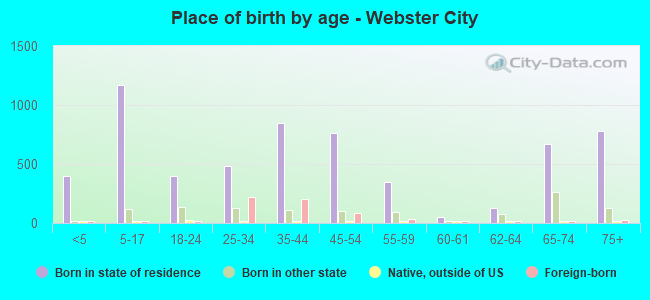
Place of birth - Born in state of residence (%)
Place of birth - Born in state of residence (%) - White
Place of birth - Born in state of residence (%) - Black or African American
Place of birth - Born in state of residence (%) - Asian
Place of birth - Born in state of residence (%) - Hispanic or Latino
Place of birth - Born in state of residence (%) - American Indian and Alaska Native
Place of birth - Born in state of residence (%) - Multirace
Place of birth - Born in state of residence (%) - Other Race
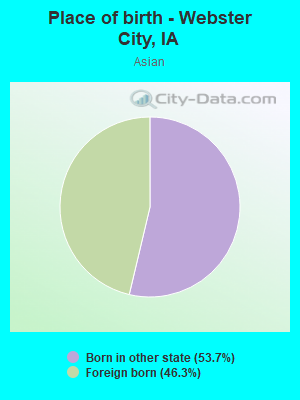
Place of birth - Born in other state (%)
Place of birth - Born in other state (%) - White
Place of birth - Born in other state (%) - Black or African American
Place of birth - Born in other state (%) - Asian
Place of birth - Born in other state (%) - Hispanic or Latino
Place of birth - Born in other state (%) - American Indian and Alaska Native
Place of birth - Born in other state (%) - Multirace
Place of birth - Born in other state (%) - Other Race
Place of birth - Native, outside of US (%)
Place of birth - Native, outside of US (%) - White
Place of birth - Native, outside of US (%) - Black or African American
Place of birth - Native, outside of US (%) - Asian
Place of birth - Native, outside of US (%) - Hispanic or Latino
Place of birth - Native, outside of US (%) - American Indian and Alaska Native
Place of birth - Native, outside of US (%) - Multirace
Place of birth - Native, outside of US (%) - Other Race
Place of birth - Foreign born (%)
Place of birth - Foreign born (%) - White
Place of birth - Foreign born (%) - Black or African American
Place of birth - Foreign born (%) - Asian
Place of birth - Foreign born (%) - Hispanic or Latino
Place of birth - Foreign born (%) - American Indian and Alaska Native
Place of birth - Foreign born (%) - Multirace
Place of birth - Foreign born (%) - Other Race
Residents speaking English at home (%)
Residents speaking English at home - Born in the United States (%)
Residents speaking English at home - Native, born elsewhere (%)
Residents speaking English at home - Foreign born (%)
Residents speaking Spanish at home (%)
Residents speaking Spanish at home - Born in the United States (%)
Residents speaking Spanish at home - Native, born elsewhere (%)
Residents speaking Spanish at home - Foreign born (%)
Residents speaking other language at home (%)
Residents speaking other language at home - Born in the United States (%)
Residents speaking other language at home - Native, born elsewhere (%)
Residents speaking other language at home - Foreign born (%)
Marital status - Never married (%)
Marital status - Now married (%)
Marital status - Separated (%)
Marital status - Widowed (%)
Marital status - Divorced (%)
Ancestries Reported - Arab (%)
Ancestries Reported - Czech (%)
Ancestries Reported - Danish (%)
Ancestries Reported - Dutch (%)
Ancestries Reported - English (%)
Ancestries Reported - French (%)
Ancestries Reported - French Canadian (%)
Ancestries Reported - German (%)
Ancestries Reported - Greek (%)
Ancestries Reported - Hungarian (%)
Ancestries Reported - Irish (%)
Ancestries Reported - Italian (%)
Ancestries Reported - Lithuanian (%)
Ancestries Reported - Norwegian (%)
Ancestries Reported - Polish (%)
Ancestries Reported - Portuguese (%)
Ancestries Reported - Russian (%)
Ancestries Reported - Scotch-Irish (%)
Ancestries Reported - Scottish (%)
Ancestries Reported - Slovak (%)
Ancestries Reported - Subsaharan African (%)
Ancestries Reported - Swedish (%)
Ancestries Reported - Swiss (%)
Ancestries Reported - Ukrainian (%)
Ancestries Reported - United States (%)
Ancestries Reported - Welsh (%)
Ancestries Reported - West Indian (%)
Ancestries Reported - Other (%)
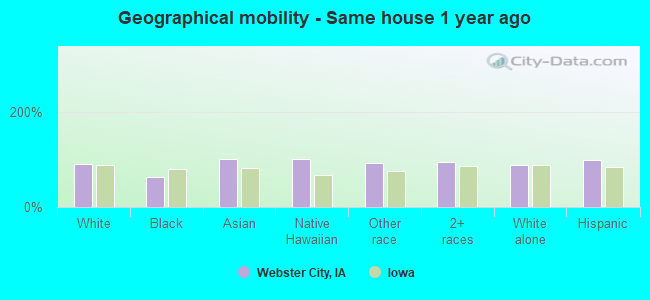
Geographical mobility - Same house 1 year ago (%)
Geographical mobility - Same house 1 year ago (%) - White
Geographical mobility - Same house 1 year ago (%) - Black or African American
Geographical mobility - Same house 1 year ago (%) - Asian
Geographical mobility - Same house 1 year ago (%) - Hispanic or Latino
Geographical mobility - Same house 1 year ago (%) - American Indian and Alaska Native
Geographical mobility - Same house 1 year ago (%) - Multirace
Geographical mobility - Same house 1 year ago (%) - Other Race
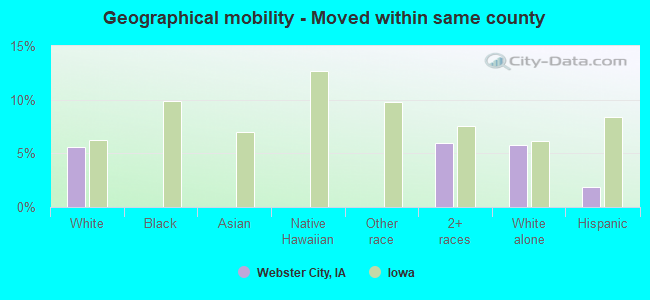
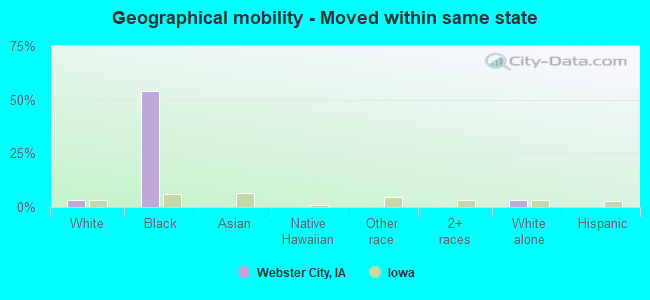
Geographical mobility - Moved within same county (%)
Geographical mobility - Moved within same county (%) - White
Geographical mobility - Moved within same county (%) - Black or African American
Geographical mobility - Moved within same county (%) - Asian
Geographical mobility - Moved within same county (%) - Hispanic or Latino
Geographical mobility - Moved within same county (%) - American Indian and Alaska Native
Geographical mobility - Moved within same county (%) - Multirace
Geographical mobility - Moved within same county (%) - Other Race
Geographical mobility - Moved from different county within same state (%)
Geographical mobility - Moved from different county within same state (%) - White
Geographical mobility - Moved from different county within same state (%) - Black or African American
Geographical mobility - Moved from different county within same state (%) - Asian
Geographical mobility - Moved from different county within same state (%) - Hispanic or Latino
Geographical mobility - Moved from different county within same state (%) - American Indian and Alaska Native
Geographical mobility - Moved from different county within same state (%) - Multirace
Geographical mobility - Moved from different county within same state (%) - Other Race
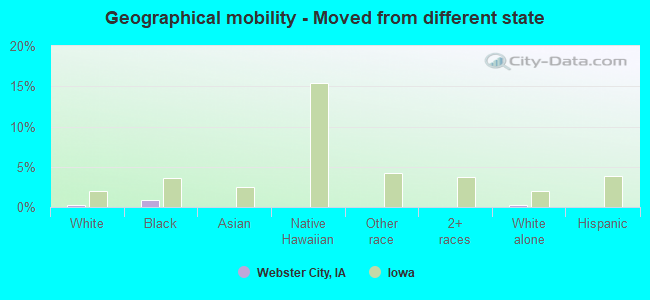
Geographical mobility - Moved from different state (%)
Geographical mobility - Moved from different state (%) - White
Geographical mobility - Moved from different state (%) - Black or African American
Geographical mobility - Moved from different state (%) - Asian
Geographical mobility - Moved from different state (%) - Hispanic or Latino
Geographical mobility - Moved from different state (%) - American Indian and Alaska Native
Geographical mobility - Moved from different state (%) - Multirace
Geographical mobility - Moved from different state (%) - Other Race
Geographical mobility - Moved from abroad (%)
Geographical mobility - Moved from abroad (%) - White
Geographical mobility - Moved from abroad (%) - Black or African American
Geographical mobility - Moved from abroad (%) - Asian
Geographical mobility - Moved from abroad (%) - Hispanic or Latino
Geographical mobility - Moved from abroad (%) - American Indian and Alaska Native
Geographical mobility - Moved from abroad (%) - Multirace
Geographical mobility - Moved from abroad (%) - Other Race
Place of birth for the foreign-born population - Ireland (%)
Place of birth for the foreign-born population - Denmark (%)
Place of birth for the foreign-born population - Norway (%)
Place of birth for the foreign-born population - Sweden (%)
Place of birth for the foreign-born population - United Kingdom (%)
Place of birth for the foreign-born population - England (%)
Place of birth for the foreign-born population - Scotland (%)
Place of birth for the foreign-born population - Other Northern Europe (%)
Place of birth for the foreign-born population - Austria (%)
Place of birth for the foreign-born population - Belgium (%)
Place of birth for the foreign-born population - France (%)
Place of birth for the foreign-born population - Germany (%)
Place of birth for the foreign-born population - Netherlands (%)
Place of birth for the foreign-born population - Switzerland (%)
Place of birth for the foreign-born population - Other Western Europe (%)
Place of birth for the foreign-born population - Greece (%)
Place of birth for the foreign-born population - Italy (%)
Place of birth for the foreign-born population - Portugal (%)
Place of birth for the foreign-born population - Spain (%)
Place of birth for the foreign-born population - Other Southern Europe (%)
Place of birth for the foreign-born population - Albania (%)
Place of birth for the foreign-born population - Belarus (%)
Place of birth for the foreign-born population - Bosnia and Herzegovina (%)
Place of birth for the foreign-born population - Bulgaria (%)
Place of birth for the foreign-born population - Croatia (%)
Place of birth for the foreign-born population - Czechoslovakia (%)
Place of birth for the foreign-born population - Hungary (%)
Place of birth for the foreign-born population - Latvia (%)
Place of birth for the foreign-born population - Lithuania (%)
Place of birth for the foreign-born population - North Macedonia (Macedonia) (%)
Place of birth for the foreign-born population - Moldova (%)
Place of birth for the foreign-born population - Poland (%)
Place of birth for the foreign-born population - Romania (%)
Place of birth for the foreign-born population - Russia (%)
Place of birth for the foreign-born population - Serbia (%)
Place of birth for the foreign-born population - Ukraine (%)
Place of birth for the foreign-born population - Other Eastern Europe (%)
Place of birth for the foreign-born population - China (%)
Place of birth for the foreign-born population - Hong Kong (%)
Place of birth for the foreign-born population - Taiwan (%)
Place of birth for the foreign-born population - Japan (%)
Place of birth for the foreign-born population - Korea (%)
Place of birth for the foreign-born population - Other Eastern Asia (%)
Place of birth for the foreign-born population - Afghanistan (%)
Place of birth for the foreign-born population - Bangladesh (%)
Place of birth for the foreign-born population - India (%)
Place of birth for the foreign-born population - Iran (%)
Place of birth for the foreign-born population - Kazakhstan (%)
Place of birth for the foreign-born population - Nepal (%)
Place of birth for the foreign-born population - Pakistan (%)
Place of birth for the foreign-born population - Sri Lanka (%)
Place of birth for the foreign-born population - Uzbekistan (%)
Place of birth for the foreign-born population - Other South Central Asia (%)
Place of birth for the foreign-born population - Burma (%)
Place of birth for the foreign-born population - Cambodia (%)
Place of birth for the foreign-born population - Indonesia (%)
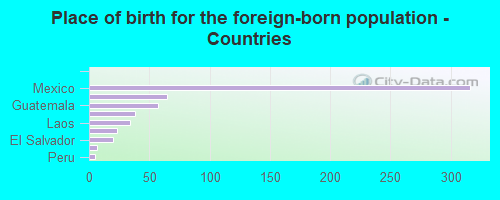
Place of birth for the foreign-born population - Laos (%)
Place of birth for the foreign-born population - Malaysia (%)
Place of birth for the foreign-born population - Philippines (%)
Place of birth for the foreign-born population - Singapore (%)
Place of birth for the foreign-born population - Thailand (%)
Place of birth for the foreign-born population - Vietnam (%)
Place of birth for the foreign-born population - Other South Eastern Asia (%)
Place of birth for the foreign-born population - Armenia (%)
Place of birth for the foreign-born population - Iraq (%)
Place of birth for the foreign-born population - Israel (%)
Place of birth for the foreign-born population - Jordan (%)
Place of birth for the foreign-born population - Kuwait (%)
Place of birth for the foreign-born population - Lebanon (%)
Place of birth for the foreign-born population - Saudi Arabia (%)
Place of birth for the foreign-born population - Syria (%)
Place of birth for the foreign-born population - Turkey (%)
Place of birth for the foreign-born population - Yemen (%)
Place of birth for the foreign-born population - Other Western Asia (%)
Place of birth for the foreign-born population - Eritrea (%)
Place of birth for the foreign-born population - Ethiopia (%)
Place of birth for the foreign-born population - Kenya (%)
Place of birth for the foreign-born population - Somalia (%)
Place of birth for the foreign-born population - Uganda (%)
Place of birth for the foreign-born population - Zimbabwe (%)
Place of birth for the foreign-born population - Other Eastern Africa (%)
Place of birth for the foreign-born population - Cameroon (%)
Place of birth for the foreign-born population - Congo (%)
Place of birth for the foreign-born population - Democratic Republic of Congo (Zaire) (%)
Place of birth for the foreign-born population - Other Middle Africa (%)
Place of birth for the foreign-born population - Egypt (%)
Place of birth for the foreign-born population - Morocco (%)
Place of birth for the foreign-born population - Sudan (%)
Place of birth for the foreign-born population - Other Northern Africa (%)
Place of birth for the foreign-born population - South Africa (%)
Place of birth for the foreign-born population - Other Southern Africa (%)
Place of birth for the foreign-born population - Cabo Verde (%)
Place of birth for the foreign-born population - Ghana (%)
Place of birth for the foreign-born population - Liberia (%)
Place of birth for the foreign-born population - Nigeria (%)
Place of birth for the foreign-born population - Senegal (%)
Place of birth for the foreign-born population - Sierra Leone (%)
Place of birth for the foreign-born population - Other Western Africa (%)
Place of birth for the foreign-born population - Australia (%)
Place of birth for the foreign-born population - New Zealand (%)
Place of birth for the foreign-born population - Fiji (%)
Place of birth for the foreign-born population - Micronesia (%)
Place of birth for the foreign-born population - Bahamas (%)
Place of birth for the foreign-born population - Barbados (%)
Place of birth for the foreign-born population - Cuba (%)
Place of birth for the foreign-born population - Dominica (%)
Place of birth for the foreign-born population - Dominican Republic (%)
Place of birth for the foreign-born population - Grenada (%)
Place of birth for the foreign-born population - Haiti (%)
Place of birth for the foreign-born population - Jamaica (%)
Place of birth for the foreign-born population - St. Vincent and the Grenadines (%)
Place of birth for the foreign-born population - Trinidad and Tobago (%)
Place of birth for the foreign-born population - West Indies (%)
Place of birth for the foreign-born population - Other Caribbean (%)
Place of birth for the foreign-born population - Belize (%)
Place of birth for the foreign-born population - Costa Rica (%)
Place of birth for the foreign-born population - El Salvador (%)
Place of birth for the foreign-born population - Guatemala (%)
Place of birth for the foreign-born population - Honduras (%)
Place of birth for the foreign-born population - Mexico (%)
Place of birth for the foreign-born population - Nicaragua (%)
Place of birth for the foreign-born population - Panama (%)
Place of birth for the foreign-born population - Other Central America (%)
Place of birth for the foreign-born population - Argentina (%)
Place of birth for the foreign-born population - Bolivia (%)
Place of birth for the foreign-born population - Brazil (%)
Place of birth for the foreign-born population - Chile (%)
Place of birth for the foreign-born population - Colombia (%)
Place of birth for the foreign-born population - Ecuador (%)
Place of birth for the foreign-born population - Guyana (%)
Place of birth for the foreign-born population - Peru (%)
Place of birth for the foreign-born population - Uruguay (%)
Place of birth for the foreign-born population - Venezuela (%)
Place of birth for the foreign-born population - Other South America (%)
Place of birth for the foreign-born population - Canada (%)
Place of birth for the foreign-born population - Other Northern America (%)
Place of birth for the foreign-born population - Other (%)
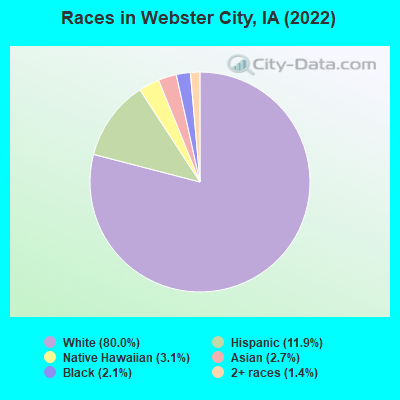
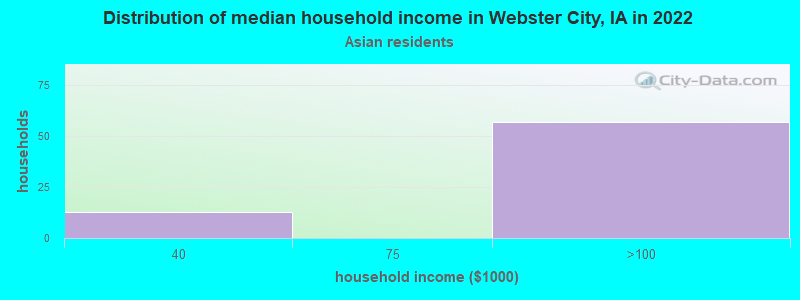
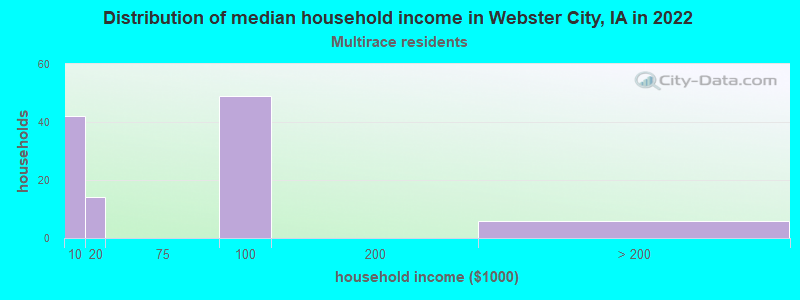
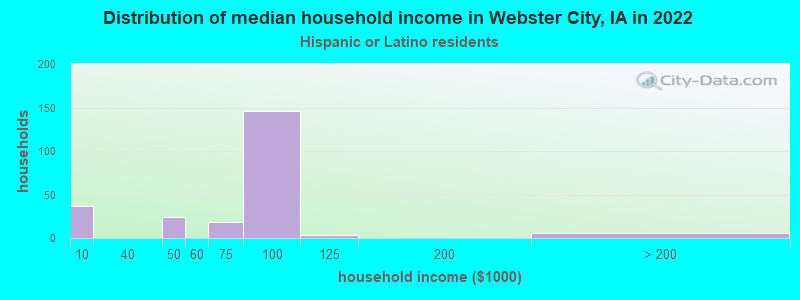
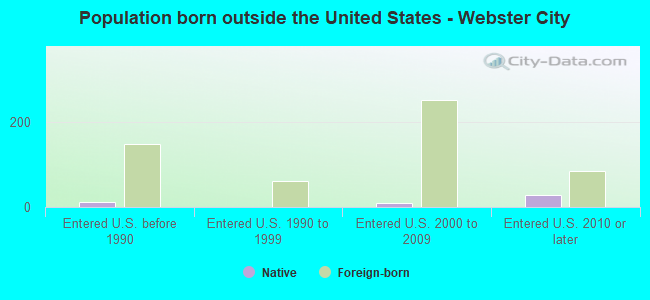
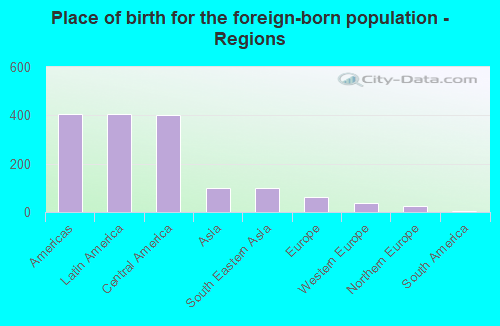
According to 2022 data, the most numerous races in Webster City, IA are White alone (6,250 residents), Hispanic (928 residents), and Black alone (163 residents). 84.2% of Webster City residents speak English at home. 7.3% of Webster City, IA residents are foreign-born (5.1% born in Latin America, 1.3% born in Asia, 0.8% born in Europe), which is 31.2% greater than the foreign-born rate of 5.0% across the entire state of Iowa.
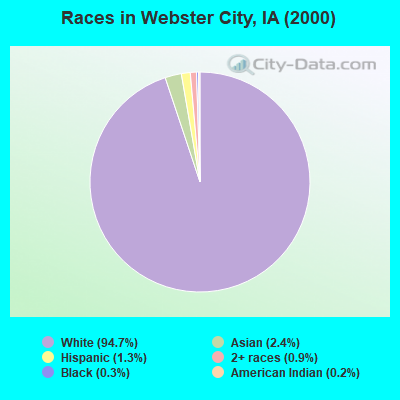
Race distribution in Webster City
2000 2022
2,710,344 92.6% White alone 82,473 2.8% Hispanic 60,744 2.1% Black alone 36,345 1.2% Asian alone 25,472 0.9% Two or more races 7,955 0.3% American Indian alone 2,103 0.07% Other race alone 888 0.03% Native Hawaiian and Other
2,650,110 82.8% White alone 218,024 6.8% Hispanic 119,004 3.7% Black alone 115,286 3.6% Two or more races 74,892 2.3% Asian alone 9,260 0.3% Other race alone 8,595 0.3% Native Hawaiian and Other 5,346 0.2% American Indian alone
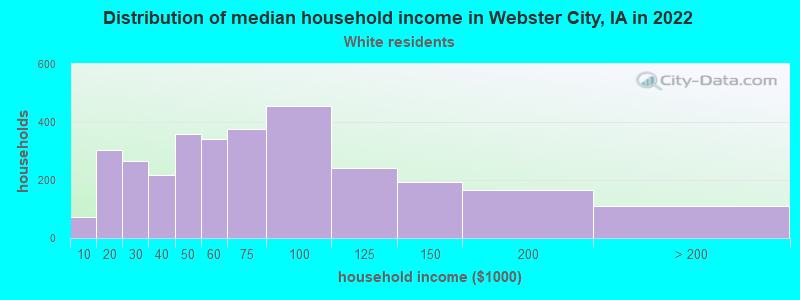
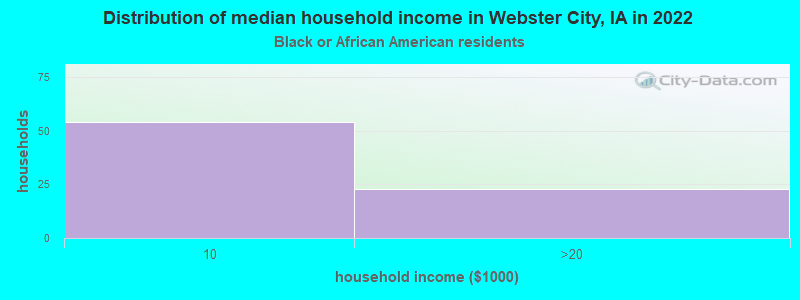
Income and house value in Webster City Median household income in 2022 $58,415 White non-Hispanic householders$93,038 Hispanic or Latino race householdersMedian 2022 house value $103,065 White Non-Hispanic householders $87,012 Asian householders$56,258 Some other race householders$56,258 Hispanic or Latino householders
Median age by race in Webster City
44.6 Median age for White residents42.4 46.2 33.6 Median age for Black or African American residents63.3 17.5 -660,397,073.5 Median age for American Indian / Alaska Native residents-654,282,765.1 -670,912,950.5 42.5 Median age for Asian residents43.0 -711,656,441.0 -580,729,166.1 Median age for Native Hawaiian / Pacific Islander residents-776,978,416.5 -504,347,825.6 32.4 Median age for Other race residents19.4 32.5 29.9 Median age for Two or more races residents28.1 51.7 47.5 Median age for White alone residents46.8 48.5 25.8 Median age for Hispanic or Latino residents19.3 29.7
Owner/renter occupied households by race in Webster City
House owners and renters - White residents 2,035 66.2% Owner occupied1,039 33.8% Renter occupiedHouse owners and renters - Black or African American residents 68 100.0% Renter occupiedHouse owners and renters - Asian residents 28 33.1% Owner occupied56 66.9% Renter occupiedHouse owners and renters - Two or more races residents 15 13.4% Owner occupied95 86.6% Renter occupiedHouse owners and renters - White alone residents 2,031 68.1% Owner occupied953 31.9% Renter occupiedHouse owners and renters - Hispanic or Latino residents 30 15.8% Owner occupied159 84.2% Renter occupied
Language usage in Webster City
English speakers - Total 84.2% of residents of Webster City speak English at home.
11.8% of residents speak Spanish at home 598 68.7% Speak English very well272 31.3% Speak English less than very well4.1% of residents speak other language at home 217 70.9% Speak English very well89 29.1% Speak English less than very well
English speakers - Born in the United States 84.0% of residents of Webster City speak English at home.
12.2% of residents speak Spanish at home 141 100.0% Speak English very well2.8% of residents speak other language at home 32 100.0% Speak English very well
English speakers - Native, born elsewhere 26.5% of residents of Webster City speak English at home.
55.1% of residents speak Spanish at home 22 81.5% Speak English very well5 18.5% Speak English less than very well
English speakers - Foreign-born 8.3% of residents of Webster City speak English at home.
73.9% of residents speak Spanish at home 177 40.4% Speak English very well261 59.6% Speak English less than very well21.2% of residents speak other language at home 93 73.8% Speak English very well33 26.2% Speak English less than very well
White (Caucasian) - Speak only English Native:
94.0% (5,639)Foreign-born:
21.6% (37)
White (Caucasian) - Speak another language Native:
5.1% (305)Foreign-born:
77.1% (131)
Asian - Speak another language Native:
19.1% (22)Foreign-born:
97.5% (95)
Other race - Speak another language Native:
86.3% (29)Foreign-born:
92.4% (79)
Two or more races - Speak another language Native:
45.7% (175)Foreign-born:
97.8% (254)
White alone - Speak only English Native:
97.1% (5,638)Foreign-born:
66.6% (41)
White alone - Speak another language Native:
3.0% (172)Foreign-born:
32.9% (20)
Hispanic or Latino - Speak only English Native:
24.1% (118)Foreign-born:
1.5% (7)
Hispanic or Latino - Speak another language Native:
69.7% (342)Foreign-born:
99.5% (434)
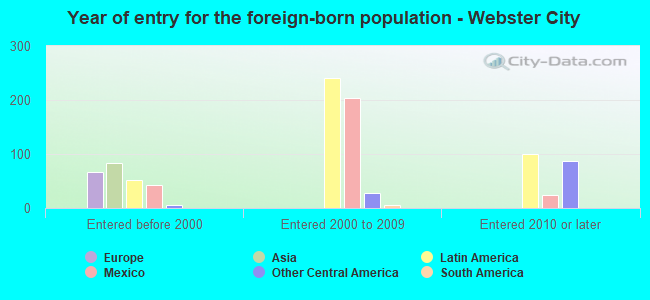
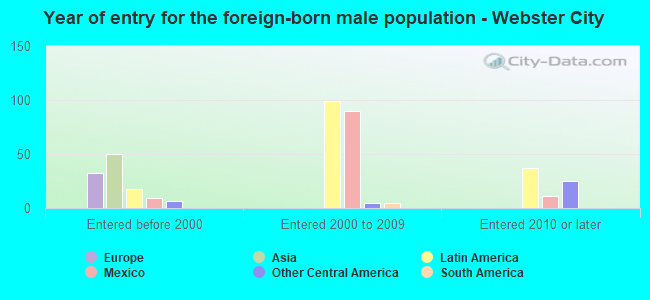
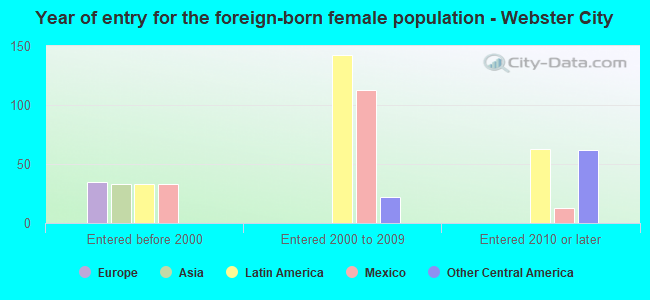
Foreign-born residents in Webster City 568 residents are foreign born (5.1% Latin America , 1.3% Asia , 0.8% Europe ).
Marital status for residents in Webster City Marital status - White (Caucasian) population 15 years and over
Males 28.9% Never married45.9% Now married1.3% Separated6.0% Widowed17.9% DivorcedFemales 20.2% Never married53.9% Now married0.0% Separated12.4% Widowed13.4% DivorcedWomen who gave birth in the past 12 months Now married:
88.1% (116)Unmarried:
11.9% (16)
Women who did not give birth in the past 12 months Now married:
49.7% (558)Unmarried:
50.3% (564)
Marital status - Black or African American population 15 years and over
Males 31.4% Never married14.0% Now married0.0% Separated54.7% Widowed0.0% DivorcedFemales 45.2% Never married0.0% Now married54.8% Separated0.0% Widowed0.0% DivorcedWomen who gave birth in the past 12 months Now married:
92.0% (22)Unmarried:
8.0% (2)
Women who did not give birth in the past 12 months Now married:
0.0% (0)Unmarried:
100.0% (17)
Marital status - Asian population 15 years and over
Males 69.8% Never married0.0% Now married0.0% Separated0.0% Widowed30.2% DivorcedFemales 41.4% Never married0.0% Now married0.0% Separated58.6% Widowed0.0% DivorcedWomen who did not give birth in the past 12 months Now married:
0.0% (0)Unmarried:
100.0% (23)
Marital status - Other race population 15 years and over
Males 56.3% Never married43.8% Now married0.0% Separated0.0% Widowed0.0% DivorcedFemales 61.9% Never married38.1% Now married0.0% Separated0.0% Widowed0.0% DivorcedWomen who did not give birth in the past 12 months Now married:
38.1% (21)Unmarried:
61.9% (34)
Marital status - Two or more races population 15 years and over
Males 43.0% Never married30.0% Now married8.2% Separated4.3% Widowed14.5% DivorcedFemales 30.5% Never married58.2% Now married0.0% Separated0.0% Widowed11.3% DivorcedWomen who did not give birth in the past 12 months Now married:
58.2% (122)Unmarried:
41.8% (88)
Marital status - White alone, not Hispanic / Latino population 15 years and over
Males 30.1% Never married44.6% Now married1.3% Separated6.3% Widowed17.7% DivorcedFemales 21.0% Never married51.9% Now married0.0% Separated13.0% Widowed14.0% DivorcedWomen who gave birth in the past 12 months Now married:
87.1% (107)Unmarried:
12.9% (16)
Women who did not give birth in the past 12 months Now married:
44.9% (467)Unmarried:
55.1% (573)
Marital status - Hispanic or Latino population 15 years and over
Males 29.7% Never married50.7% Now married0.0% Separated0.0% Widowed19.6% DivorcedFemales 26.3% Never married73.7% Now married0.0% Separated0.0% Widowed0.0% DivorcedWomen who gave birth in the past 12 months Now married:
100.0% (12)Unmarried:
0.0% (0)
Women who did not give birth in the past 12 months Now married:
72.5% (200)Unmarried:
27.5% (76)
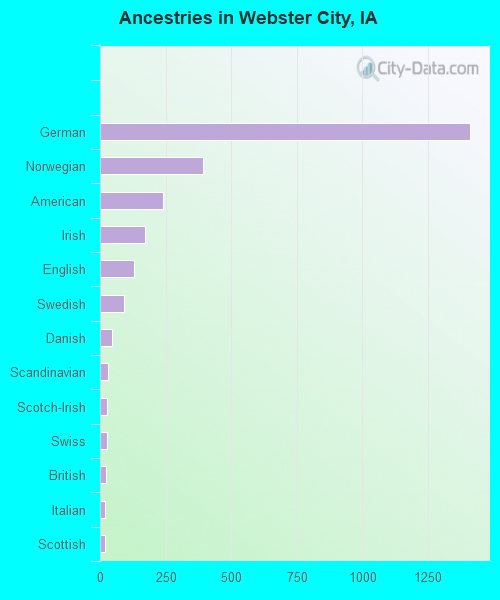
Ancestries in Webster City
1,414 37.3% German393 10.4% Norwegian239 6.3% American171 4.5% Irish129 3.4% English93 2.5% Swedish45 1.2% Danish32 0.8% Scandinavian25 0.7% Scotch-Irish25 0.7% Swiss23 0.6% British18 0.5% Italian18 0.5% Scottish10 0.3% French4 0.1% Belgian
Children Nativity (place of birth) in Webster City
Children under 6 years - Living with two parents Both parents native 321 100.0% NativeBoth parents foreign-born 93 100.0% NativeOne native, one foreign-born parent 9 100.0% NativeChildren under 6 years - Living with one parent Native parent 44 100.0% NativeChildren 6 to 17 years - Living with two parents Both parents native 593 100.0% NativeBoth parents foreign-born 145 100.0% NativeOne native, one foreign-born parent 65 100.0% NativeChildren 6 to 17 years - Living with one parent Native parent 234 100.0% NativeForeign-born parent 77 51.8% Native72 48.2% Foreign-born
Grandparents responsible for own grandchildren in Webster City
Grandparents (30 to 59 years) White / Caucasian 41 100.0% Responsible for grandchildrenTwo or more races 14 100.0% Responsible for grandchildrenWhite alone, not Hispanic / Latino 41 100.0% Responsible for grandchildrenHispanic or Latino 9 100.0% Responsible for grandchildren
Grandparents (60 years and over)