Races in Webster Groves, Missouri (MO) Detailed Stats
Data:
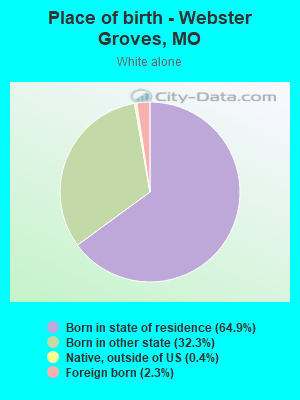
Races - White alone (%)
Races - White alone (% change since 2000)
Races - Black alone (%)
Races - Black alone (% change since 2000)
Races - American Indian alone (%)
Races - American Indian alone (% change since 2000)
Races - Asian alone (%)
Races - Asian alone (% change since 2000)
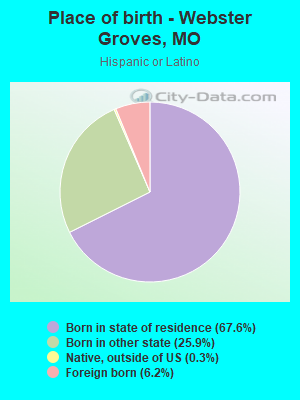
Races - Hispanic (%)
Races - Hispanic (% change since 2000)
Races - Native Hawaiian and Other Pacific Islander alone (%)
Races - Native Hawaiian and Other Pacific Islander alone (% change since 2000)
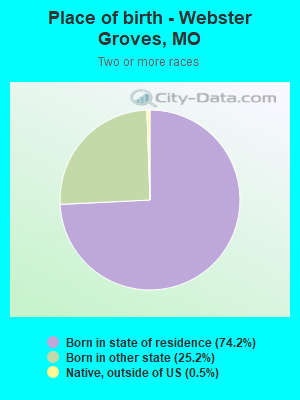
Races - Two or more races(%)
Races - Two or more races(% change since 2000)
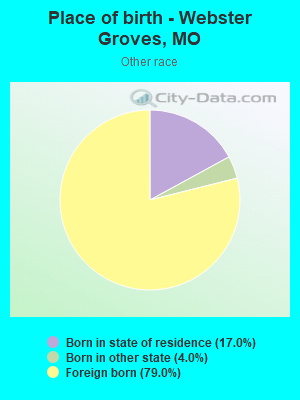
Races - Other race alone (%)
Races - Other race alone (% change since 2000)
Racial diversity
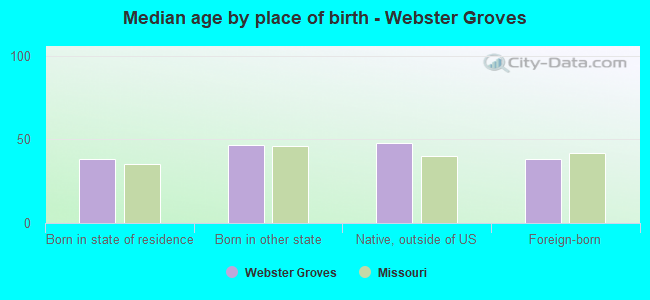
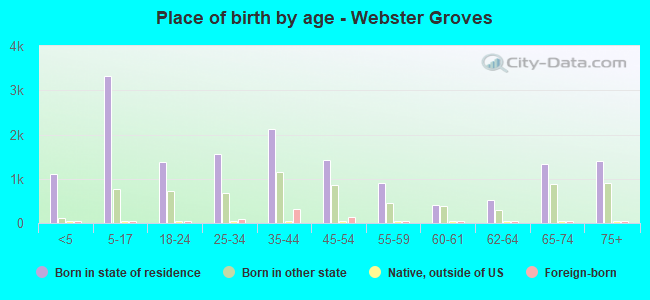
Place of birth - Born in state of residence (%)
Place of birth - Born in state of residence (%) - White
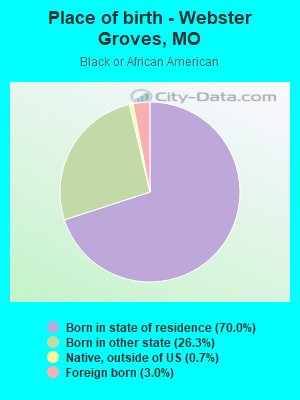
Place of birth - Born in state of residence (%) - Black or African American
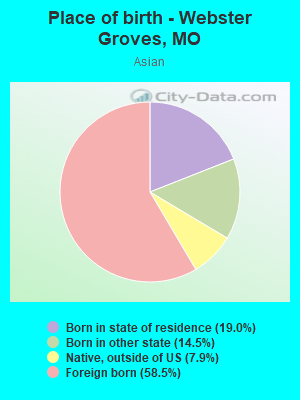
Place of birth - Born in state of residence (%) - Asian
Place of birth - Born in state of residence (%) - Hispanic or Latino
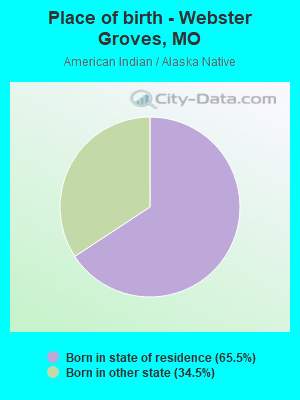
Place of birth - Born in state of residence (%) - American Indian and Alaska Native
Place of birth - Born in state of residence (%) - Multirace
Place of birth - Born in state of residence (%) - Other Race
Place of birth - Born in other state (%)
Place of birth - Born in other state (%) - White
Place of birth - Born in other state (%) - Black or African American
Place of birth - Born in other state (%) - Asian
Place of birth - Born in other state (%) - Hispanic or Latino
Place of birth - Born in other state (%) - American Indian and Alaska Native
Place of birth - Born in other state (%) - Multirace
Place of birth - Born in other state (%) - Other Race
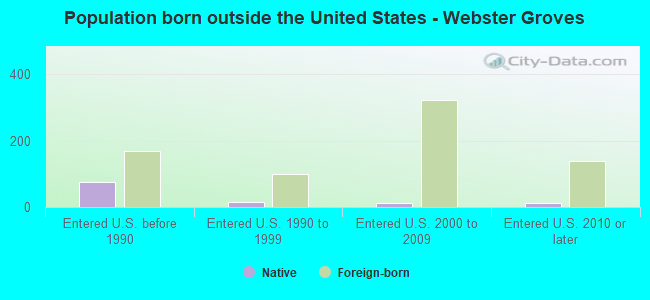
Place of birth - Native, outside of US (%)
Place of birth - Native, outside of US (%) - White
Place of birth - Native, outside of US (%) - Black or African American
Place of birth - Native, outside of US (%) - Asian
Place of birth - Native, outside of US (%) - Hispanic or Latino
Place of birth - Native, outside of US (%) - American Indian and Alaska Native
Place of birth - Native, outside of US (%) - Multirace
Place of birth - Native, outside of US (%) - Other Race
Place of birth - Foreign born (%)
Place of birth - Foreign born (%) - White
Place of birth - Foreign born (%) - Black or African American
Place of birth - Foreign born (%) - Asian
Place of birth - Foreign born (%) - Hispanic or Latino
Place of birth - Foreign born (%) - American Indian and Alaska Native
Place of birth - Foreign born (%) - Multirace
Place of birth - Foreign born (%) - Other Race
Residents speaking English at home (%)
Residents speaking English at home - Born in the United States (%)
Residents speaking English at home - Native, born elsewhere (%)
Residents speaking English at home - Foreign born (%)
Residents speaking Spanish at home (%)
Residents speaking Spanish at home - Born in the United States (%)
Residents speaking Spanish at home - Native, born elsewhere (%)
Residents speaking Spanish at home - Foreign born (%)
Residents speaking other language at home (%)
Residents speaking other language at home - Born in the United States (%)
Residents speaking other language at home - Native, born elsewhere (%)
Residents speaking other language at home - Foreign born (%)
Marital status - Never married (%)
Marital status - Now married (%)
Marital status - Separated (%)
Marital status - Widowed (%)
Marital status - Divorced (%)
Ancestries Reported - Arab (%)
Ancestries Reported - Czech (%)
Ancestries Reported - Danish (%)
Ancestries Reported - Dutch (%)
Ancestries Reported - English (%)
Ancestries Reported - French (%)
Ancestries Reported - French Canadian (%)
Ancestries Reported - German (%)
Ancestries Reported - Greek (%)
Ancestries Reported - Hungarian (%)
Ancestries Reported - Irish (%)
Ancestries Reported - Italian (%)
Ancestries Reported - Lithuanian (%)
Ancestries Reported - Norwegian (%)
Ancestries Reported - Polish (%)
Ancestries Reported - Portuguese (%)
Ancestries Reported - Russian (%)
Ancestries Reported - Scotch-Irish (%)
Ancestries Reported - Scottish (%)
Ancestries Reported - Slovak (%)
Ancestries Reported - Subsaharan African (%)
Ancestries Reported - Swedish (%)
Ancestries Reported - Swiss (%)
Ancestries Reported - Ukrainian (%)
Ancestries Reported - United States (%)
Ancestries Reported - Welsh (%)
Ancestries Reported - West Indian (%)
Ancestries Reported - Other (%)
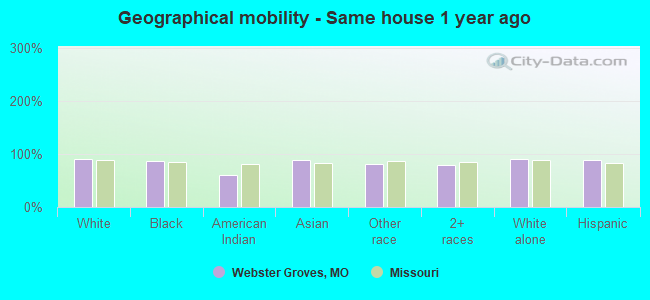
Geographical mobility - Same house 1 year ago (%)
Geographical mobility - Same house 1 year ago (%) - White
Geographical mobility - Same house 1 year ago (%) - Black or African American
Geographical mobility - Same house 1 year ago (%) - Asian
Geographical mobility - Same house 1 year ago (%) - Hispanic or Latino
Geographical mobility - Same house 1 year ago (%) - American Indian and Alaska Native
Geographical mobility - Same house 1 year ago (%) - Multirace
Geographical mobility - Same house 1 year ago (%) - Other Race
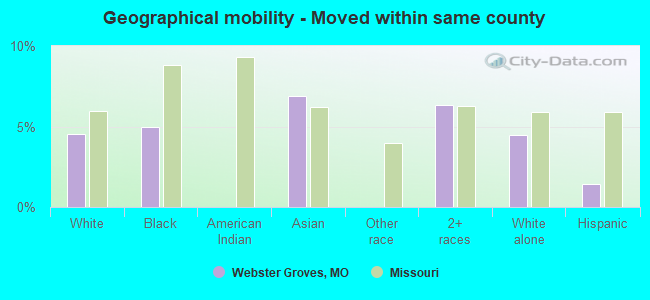
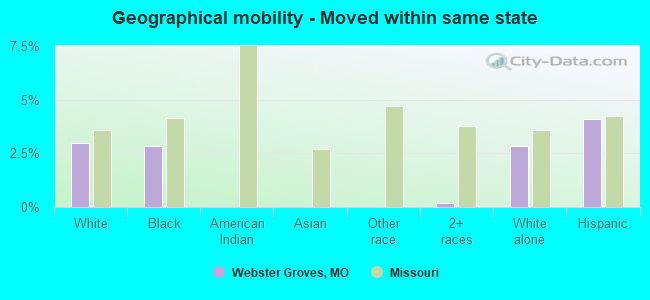
Geographical mobility - Moved within same county (%)
Geographical mobility - Moved within same county (%) - White
Geographical mobility - Moved within same county (%) - Black or African American
Geographical mobility - Moved within same county (%) - Asian
Geographical mobility - Moved within same county (%) - Hispanic or Latino
Geographical mobility - Moved within same county (%) - American Indian and Alaska Native
Geographical mobility - Moved within same county (%) - Multirace
Geographical mobility - Moved within same county (%) - Other Race
Geographical mobility - Moved from different county within same state (%)
Geographical mobility - Moved from different county within same state (%) - White
Geographical mobility - Moved from different county within same state (%) - Black or African American
Geographical mobility - Moved from different county within same state (%) - Asian
Geographical mobility - Moved from different county within same state (%) - Hispanic or Latino
Geographical mobility - Moved from different county within same state (%) - American Indian and Alaska Native
Geographical mobility - Moved from different county within same state (%) - Multirace
Geographical mobility - Moved from different county within same state (%) - Other Race
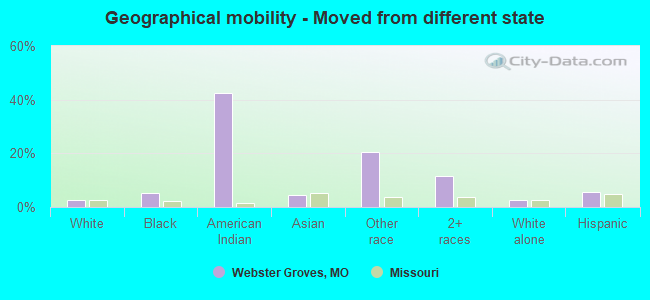
Geographical mobility - Moved from different state (%)
Geographical mobility - Moved from different state (%) - White
Geographical mobility - Moved from different state (%) - Black or African American
Geographical mobility - Moved from different state (%) - Asian
Geographical mobility - Moved from different state (%) - Hispanic or Latino
Geographical mobility - Moved from different state (%) - American Indian and Alaska Native
Geographical mobility - Moved from different state (%) - Multirace
Geographical mobility - Moved from different state (%) - Other Race
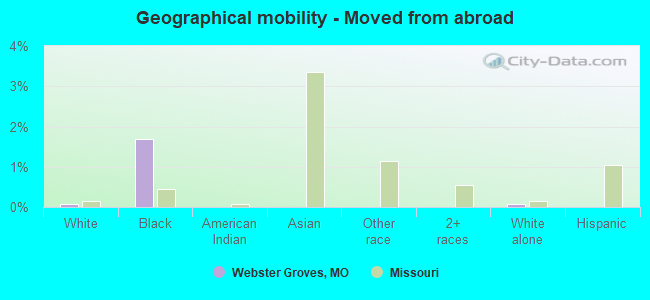
Geographical mobility - Moved from abroad (%)
Geographical mobility - Moved from abroad (%) - White
Geographical mobility - Moved from abroad (%) - Black or African American
Geographical mobility - Moved from abroad (%) - Asian
Geographical mobility - Moved from abroad (%) - Hispanic or Latino
Geographical mobility - Moved from abroad (%) - American Indian and Alaska Native
Geographical mobility - Moved from abroad (%) - Multirace
Geographical mobility - Moved from abroad (%) - Other Race
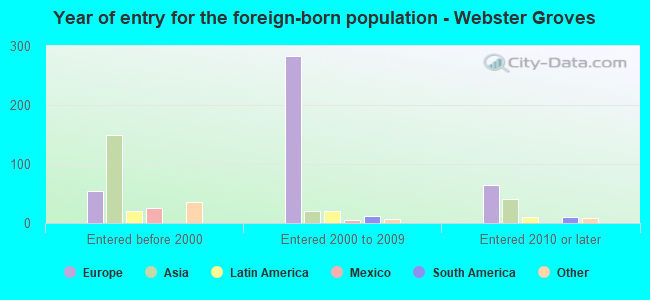
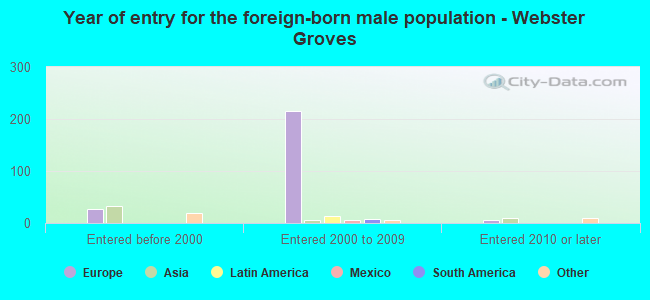
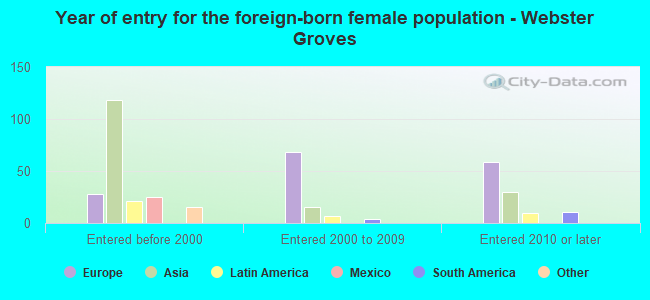
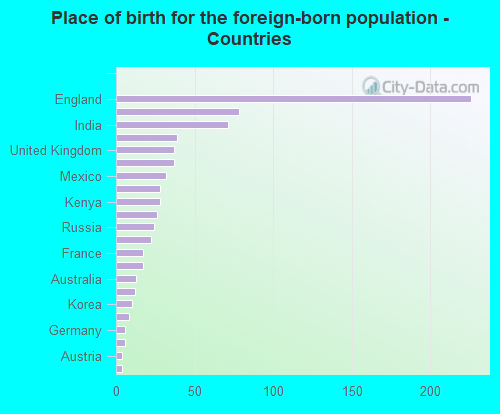
Place of birth for the foreign-born population - Ireland (%)
Place of birth for the foreign-born population - Denmark (%)
Place of birth for the foreign-born population - Norway (%)
Place of birth for the foreign-born population - Sweden (%)
Place of birth for the foreign-born population - United Kingdom (%)
Place of birth for the foreign-born population - England (%)
Place of birth for the foreign-born population - Scotland (%)
Place of birth for the foreign-born population - Other Northern Europe (%)
Place of birth for the foreign-born population - Austria (%)
Place of birth for the foreign-born population - Belgium (%)
Place of birth for the foreign-born population - France (%)
Place of birth for the foreign-born population - Germany (%)
Place of birth for the foreign-born population - Netherlands (%)
Place of birth for the foreign-born population - Switzerland (%)
Place of birth for the foreign-born population - Other Western Europe (%)
Place of birth for the foreign-born population - Greece (%)
Place of birth for the foreign-born population - Italy (%)
Place of birth for the foreign-born population - Portugal (%)
Place of birth for the foreign-born population - Spain (%)
Place of birth for the foreign-born population - Other Southern Europe (%)
Place of birth for the foreign-born population - Albania (%)
Place of birth for the foreign-born population - Belarus (%)
Place of birth for the foreign-born population - Bosnia and Herzegovina (%)
Place of birth for the foreign-born population - Bulgaria (%)
Place of birth for the foreign-born population - Croatia (%)
Place of birth for the foreign-born population - Czechoslovakia (%)
Place of birth for the foreign-born population - Hungary (%)
Place of birth for the foreign-born population - Latvia (%)
Place of birth for the foreign-born population - Lithuania (%)
Place of birth for the foreign-born population - North Macedonia (Macedonia) (%)
Place of birth for the foreign-born population - Moldova (%)
Place of birth for the foreign-born population - Poland (%)
Place of birth for the foreign-born population - Romania (%)
Place of birth for the foreign-born population - Russia (%)
Place of birth for the foreign-born population - Serbia (%)
Place of birth for the foreign-born population - Ukraine (%)
Place of birth for the foreign-born population - Other Eastern Europe (%)
Place of birth for the foreign-born population - China (%)
Place of birth for the foreign-born population - Hong Kong (%)
Place of birth for the foreign-born population - Taiwan (%)
Place of birth for the foreign-born population - Japan (%)
Place of birth for the foreign-born population - Korea (%)
Place of birth for the foreign-born population - Other Eastern Asia (%)
Place of birth for the foreign-born population - Afghanistan (%)
Place of birth for the foreign-born population - Bangladesh (%)
Place of birth for the foreign-born population - India (%)
Place of birth for the foreign-born population - Iran (%)
Place of birth for the foreign-born population - Kazakhstan (%)
Place of birth for the foreign-born population - Nepal (%)
Place of birth for the foreign-born population - Pakistan (%)
Place of birth for the foreign-born population - Sri Lanka (%)
Place of birth for the foreign-born population - Uzbekistan (%)
Place of birth for the foreign-born population - Other South Central Asia (%)
Place of birth for the foreign-born population - Burma (%)
Place of birth for the foreign-born population - Cambodia (%)
Place of birth for the foreign-born population - Indonesia (%)
Place of birth for the foreign-born population - Laos (%)
Place of birth for the foreign-born population - Malaysia (%)
Place of birth for the foreign-born population - Philippines (%)
Place of birth for the foreign-born population - Singapore (%)
Place of birth for the foreign-born population - Thailand (%)
Place of birth for the foreign-born population - Vietnam (%)
Place of birth for the foreign-born population - Other South Eastern Asia (%)
Place of birth for the foreign-born population - Armenia (%)
Place of birth for the foreign-born population - Iraq (%)
Place of birth for the foreign-born population - Israel (%)
Place of birth for the foreign-born population - Jordan (%)
Place of birth for the foreign-born population - Kuwait (%)
Place of birth for the foreign-born population - Lebanon (%)
Place of birth for the foreign-born population - Saudi Arabia (%)
Place of birth for the foreign-born population - Syria (%)
Place of birth for the foreign-born population - Turkey (%)
Place of birth for the foreign-born population - Yemen (%)
Place of birth for the foreign-born population - Other Western Asia (%)
Place of birth for the foreign-born population - Eritrea (%)
Place of birth for the foreign-born population - Ethiopia (%)
Place of birth for the foreign-born population - Kenya (%)
Place of birth for the foreign-born population - Somalia (%)
Place of birth for the foreign-born population - Uganda (%)
Place of birth for the foreign-born population - Zimbabwe (%)
Place of birth for the foreign-born population - Other Eastern Africa (%)
Place of birth for the foreign-born population - Cameroon (%)
Place of birth for the foreign-born population - Congo (%)
Place of birth for the foreign-born population - Democratic Republic of Congo (Zaire) (%)
Place of birth for the foreign-born population - Other Middle Africa (%)
Place of birth for the foreign-born population - Egypt (%)
Place of birth for the foreign-born population - Morocco (%)
Place of birth for the foreign-born population - Sudan (%)
Place of birth for the foreign-born population - Other Northern Africa (%)
Place of birth for the foreign-born population - South Africa (%)
Place of birth for the foreign-born population - Other Southern Africa (%)
Place of birth for the foreign-born population - Cabo Verde (%)
Place of birth for the foreign-born population - Ghana (%)
Place of birth for the foreign-born population - Liberia (%)
Place of birth for the foreign-born population - Nigeria (%)
Place of birth for the foreign-born population - Senegal (%)
Place of birth for the foreign-born population - Sierra Leone (%)
Place of birth for the foreign-born population - Other Western Africa (%)
Place of birth for the foreign-born population - Australia (%)
Place of birth for the foreign-born population - New Zealand (%)
Place of birth for the foreign-born population - Fiji (%)
Place of birth for the foreign-born population - Micronesia (%)
Place of birth for the foreign-born population - Bahamas (%)
Place of birth for the foreign-born population - Barbados (%)
Place of birth for the foreign-born population - Cuba (%)
Place of birth for the foreign-born population - Dominica (%)
Place of birth for the foreign-born population - Dominican Republic (%)
Place of birth for the foreign-born population - Grenada (%)
Place of birth for the foreign-born population - Haiti (%)
Place of birth for the foreign-born population - Jamaica (%)
Place of birth for the foreign-born population - St. Vincent and the Grenadines (%)
Place of birth for the foreign-born population - Trinidad and Tobago (%)
Place of birth for the foreign-born population - West Indies (%)
Place of birth for the foreign-born population - Other Caribbean (%)
Place of birth for the foreign-born population - Belize (%)
Place of birth for the foreign-born population - Costa Rica (%)
Place of birth for the foreign-born population - El Salvador (%)
Place of birth for the foreign-born population - Guatemala (%)
Place of birth for the foreign-born population - Honduras (%)
Place of birth for the foreign-born population - Mexico (%)
Place of birth for the foreign-born population - Nicaragua (%)
Place of birth for the foreign-born population - Panama (%)
Place of birth for the foreign-born population - Other Central America (%)
Place of birth for the foreign-born population - Argentina (%)
Place of birth for the foreign-born population - Bolivia (%)
Place of birth for the foreign-born population - Brazil (%)
Place of birth for the foreign-born population - Chile (%)
Place of birth for the foreign-born population - Colombia (%)
Place of birth for the foreign-born population - Ecuador (%)
Place of birth for the foreign-born population - Guyana (%)
Place of birth for the foreign-born population - Peru (%)
Place of birth for the foreign-born population - Uruguay (%)
Place of birth for the foreign-born population - Venezuela (%)
Place of birth for the foreign-born population - Other South America (%)
Place of birth for the foreign-born population - Canada (%)
Place of birth for the foreign-born population - Other Northern America (%)
Place of birth for the foreign-born population - Other (%)
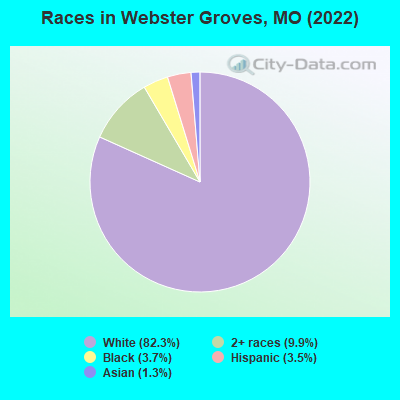
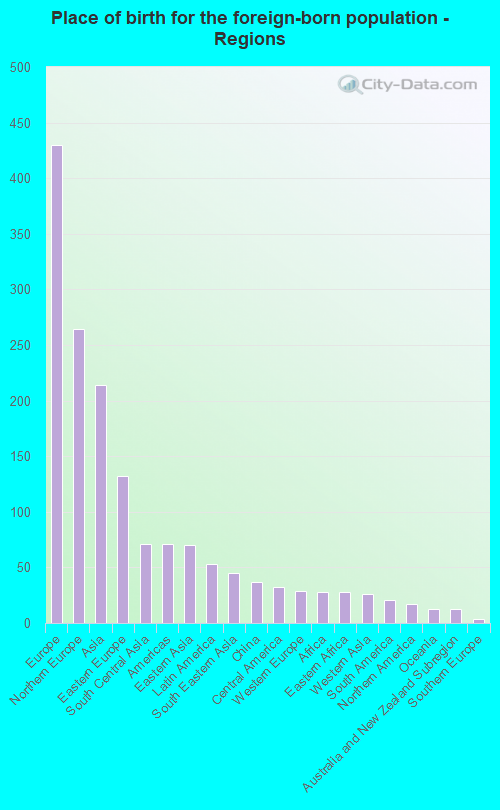
According to 2022 data, the most numerous races in Webster Groves, MO are White alone (19,434 residents), Black alone (865 residents), and Two or more races (2,336 residents). 95.7% of Webster Groves residents speak English at home. 3.2% of Webster Groves, MO residents are foreign-born (1.8% born in Europe, 0.9% born in Asia), which is 24.6% less than the foreign-born rate of 4.0% across the entire state of Missouri.
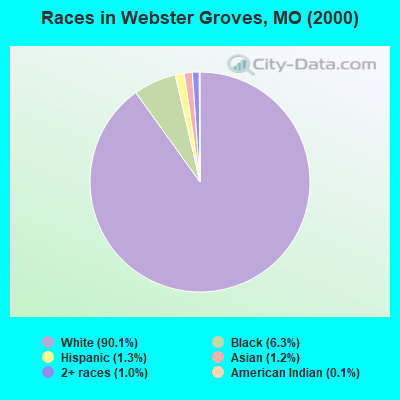
Race distribution in Webster Groves
2000 2022
4,686,474 83.8% White alone 625,667 11.2% Black alone 118,592 2.1% Hispanic 71,905 1.3% Two or more races 61,041 1.1% Asian alone 23,302 0.4% American Indian alone 5,291 0.09% Other race alone 2,939 0.05% Native Hawaiian and Other
4,733,411 76.6% White alone 656,739 10.6% Black alone 316,300 5.1% Two or more races 291,763 4.7% Hispanic 132,436 2.1% Asian alone 27,467 0.4% Other race alone 12,313 0.2% American Indian alone 7,528 0.1% Native Hawaiian and Other
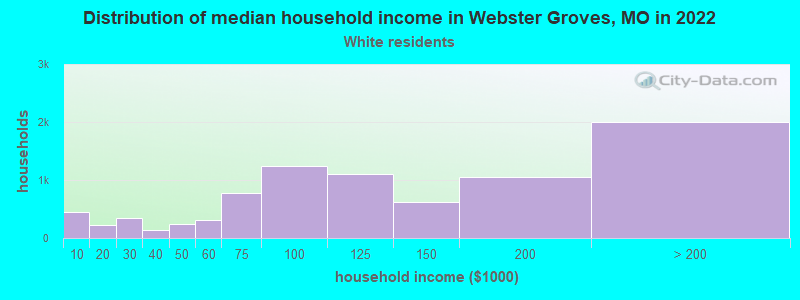
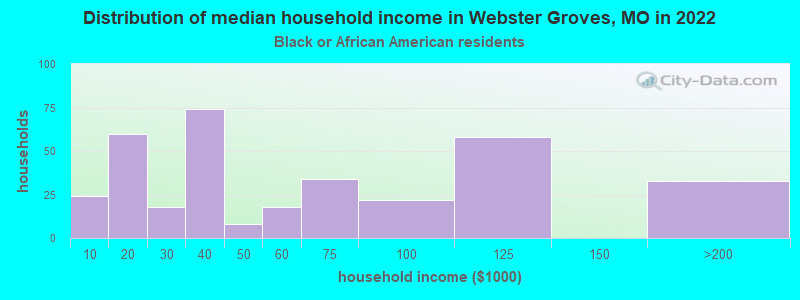
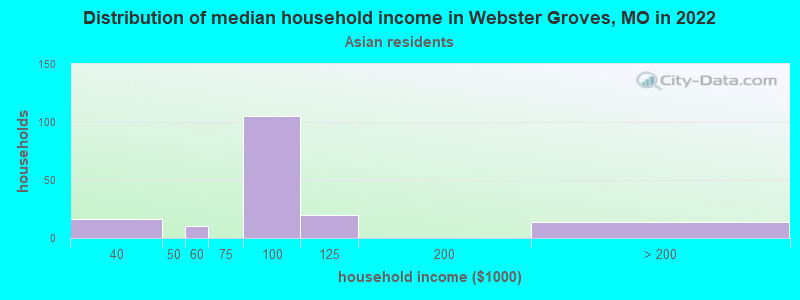
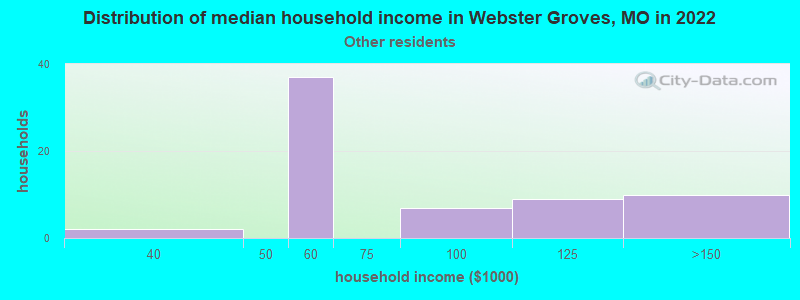
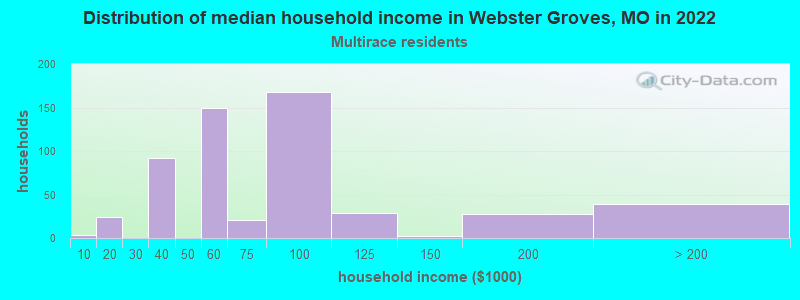
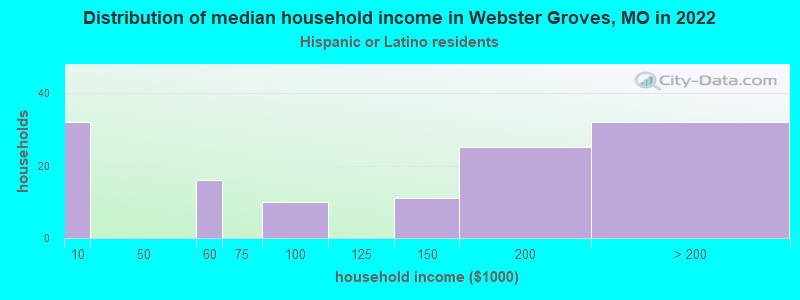
Income and house value in Webster Groves Median household income in 2022 $115,638 White non-Hispanic householders$95,577 Asian householdersMedian 2022 house value $391,694 White Non-Hispanic householders$176,618 Black or African American householders $347,539 Asian householders$309,557 Some other race householders$312,880 Two or more races householders$321,426 Hispanic or Latino householders
Median age by race in Webster Groves
41.0 Median age for White residents39.9 43.4 46.9 Median age for Black or African American residents58.0 42.9 -520,187,792.9 Median age for American Indian / Alaska Native residents-644,003,776.5 -505,494,505.0 47.8 Median age for Asian residents46.6 43.8 -710,303,029.6 Median age for Native Hawaiian / Pacific Islander residents-1,449,781,657.9 -752,136,751.4 46.1 Median age for Other race residents-623,582,765.8 52.1 19.8 Median age for Two or more races residents25.8 17.5 41.2 Median age for White alone residents39.9 43.7 19.2 Median age for Hispanic or Latino residents20.7 16.1
Owner/renter occupied households by race in Webster Groves
House owners and renters - White residents 6,377 75.8% Owner occupied2,032 24.2% Renter occupiedHouse owners and renters - Black or African American residents 168 48.6% Owner occupied178 51.4% Renter occupiedHouse owners and renters - Asian residents 145 90.1% Owner occupied16 9.9% Renter occupiedHouse owners and renters - Other race residents 17 37.7% Owner occupied28 62.3% Renter occupiedHouse owners and renters - Two or more races residents 360 55.3% Owner occupied291 44.7% Renter occupiedHouse owners and renters - White alone residents 6,350 75.8% Owner occupied2,025 24.2% Renter occupiedHouse owners and renters - Hispanic or Latino residents 90 57.6% Owner occupied66 42.4% Renter occupied
Language usage in Webster Groves
English speakers - Total 95.7% of residents of Webster Groves speak English at home.
1.4% of residents speak Spanish at home 230 74.4% Speak English very well79 25.6% Speak English less than very well2.8% of residents speak other language at home 582 93.3% Speak English very well42 6.7% Speak English less than very well
English speakers - Born in the United States 96.7% of residents of Webster Groves speak English at home.
1.8% of residents speak Spanish at home 99 78.0% Speak English very well28 22.0% Speak English less than very well1.5% of residents speak other language at home 103 100.0% Speak English very well
English speakers - Native, born elsewhere 82.8% of residents of Webster Groves speak English at home.
3.4% of residents speak Spanish at home 4 100.0% Speak English very well19.8% of residents speak other language at home 23 100.0% Speak English very well
English speakers - Foreign-born 60.5% of residents of Webster Groves speak English at home.
6.9% of residents speak Spanish at home 6 11.3% Speak English very well47 88.7% Speak English less than very well35.5% of residents speak other language at home 241 88.3% Speak English very well32 11.7% Speak English less than very well
White (Caucasian) - Speak only English Native:
97.7% (17,742)Foreign-born:
63.7% (286)
White (Caucasian) - Speak another language Native:
2.3% (423)Foreign-born:
27.5% (123)
Black or African American - Speak only English Native:
99.0% (796)Foreign-born:
100.0% (27)
Asian - Speak only English Native:
53.3% (73)Foreign-born:
30.7% (57)
Asian - Speak another language Native:
46.0% (63)Foreign-born:
73.3% (137)
Other race - Speak another language Native:
28.5% (4)Foreign-born:
90.6% (50)
White alone - Speak only English Native:
97.7% (17,583)Foreign-born:
63.5% (293)
White alone - Speak another language Native:
2.3% (410)Foreign-born:
27.6% (127)
Hispanic or Latino - Speak another language Native:
15.6% (97)Foreign-born:
100.0% (51)
Foreign-born residents in Webster Groves 758 residents are foreign born (1.8% Europe , 0.9% Asia ).
This city:
3.2%Missouri:
4.2%
Marital status for residents in Webster Groves Marital status - White (Caucasian) population 15 years and over
Males 24.1% Never married63.5% Now married0.5% Separated3.2% Widowed8.7% DivorcedFemales 25.4% Never married54.0% Now married0.3% Separated11.0% Widowed9.3% DivorcedWomen who gave birth in the past 12 months Now married:
76.8% (168)Unmarried:
23.2% (51)
Women who did not give birth in the past 12 months Now married:
50.5% (2,047)Unmarried:
49.5% (2,009)
Marital status - Black or African American population 15 years and over
Males 42.2% Never married31.7% Now married9.3% Separated11.0% Widowed5.7% DivorcedFemales 46.5% Never married32.9% Now married0.0% Separated5.0% Widowed15.6% DivorcedWomen who did not give birth in the past 12 months Now married:
34.1% (83)Unmarried:
65.9% (161)
Marital status - Asian population 15 years and over
Males 53.3% Never married46.7% Now married0.0% Separated0.0% Widowed0.0% DivorcedFemales 80.9% Never married14.4% Now married0.0% Separated4.7% Widowed0.0% DivorcedWomen who did not give birth in the past 12 months Now married:
12.8% (28)Unmarried:
87.2% (187)
Marital status - Other race population 15 years and over
Males 0.0% Never married60.0% Now married0.0% Separated0.0% Widowed40.0% DivorcedFemales 7.5% Never married24.5% Now married0.0% Separated11.3% Widowed56.6% DivorcedWomen who gave birth in the past 12 months Now married:
100.0% (6)Unmarried:
0.0% (0)
Women who did not give birth in the past 12 months Now married:
50.0% (8)Unmarried:
50.0% (8)
Marital status - Two or more races population 15 years and over
Males 59.5% Never married39.8% Now married0.0% Separated0.0% Widowed0.8% DivorcedFemales 51.3% Never married33.9% Now married0.0% Separated2.9% Widowed11.9% DivorcedWomen who did not give birth in the past 12 months Now married:
31.3% (233)Unmarried:
68.7% (511)
Marital status - White alone, not Hispanic / Latino population 15 years and over
Males 24.1% Never married63.3% Now married0.5% Separated3.3% Widowed8.8% DivorcedFemales 24.5% Never married54.7% Now married0.3% Separated11.2% Widowed9.3% DivorcedWomen who gave birth in the past 12 months Now married:
76.8% (170)Unmarried:
23.2% (51)
Women who did not give birth in the past 12 months Now married:
51.8% (2,054)Unmarried:
48.2% (1,910)
Marital status - Hispanic or Latino population 15 years and over
Males 39.5% Never married57.4% Now married0.0% Separated0.0% Widowed3.2% DivorcedFemales 61.2% Never married21.7% Now married0.0% Separated2.5% Widowed14.6% DivorcedWomen who gave birth in the past 12 months Now married:
100.0% (6)Unmarried:
0.0% (0)
Women who did not give birth in the past 12 months Now married:
20.9% (44)Unmarried:
79.1% (167)
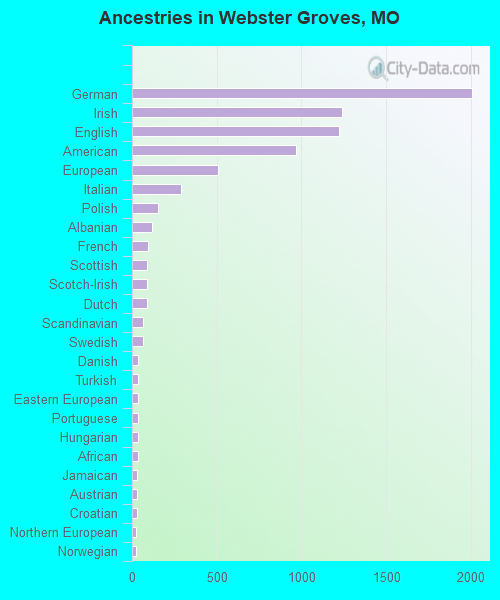
Ancestries in Webster Groves
2,007 21.5% German1,241 13.3% Irish1,223 13.1% English969 10.4% American506 5.4% European288 3.1% Italian154 1.7% Polish116 1.2% Albanian95 1.0% French91 1.0% Scottish90 1.0% Scotch-Irish87 0.9% Dutch66 0.7% Scandinavian64 0.7% Swedish38 0.4% Danish38 0.4% Turkish36 0.4% Eastern European35 0.4% Portuguese35 0.4% Hungarian34 0.4% African30 0.3% Jamaican30 0.3% Austrian27 0.3% Croatian23 0.2% Northern European22 0.2% Norwegian20 0.2% Swiss19 0.2% Lebanese18 0.2% Welsh17 0.2% Czech15 0.2% Greek14 0.2% Ukrainian12 0.1% Belgian10 0.1% Russian10 0.1% Finnish8 0.09% Cajun8 0.09% British8 0.09% Slovak7 0.08% Canadian4 0.04% Czechoslovakian4 0.04% Australian
Children Nativity (place of birth) in Webster Groves
Children under 6 years - Living with two parents Both parents native 1,398 100.0% NativeOne native, one foreign-born parent 81 100.0% NativeChildren under 6 years - Living with one parent Native parent 138 100.0% Native
Children 6 to 17 years - Living with two parents Both parents native 2,781 98.1% Native54 1.9% Foreign-bornBoth parents foreign-born 37 100.0% NativeOne native, one foreign-born parent 98 100.0% NativeChildren 6 to 17 years - Living with one parent Native parent 525 100.0% Native
Grandparents responsible for own grandchildren in Webster Groves
Grandparents (30 to 59 years) White / Caucasian 8 100.0% Responsible for grandchildrenBlack or African American 20 77.4% Responsible for grandchildren6 22.6% Not responsible for grandchildrenTwo or more races 10 100.0% Responsible for grandchildrenWhite alone, not Hispanic / Latino 8 100.0% Responsible for grandchildrenGrandparents (60 years and over) White / Caucasian 12 23.3% Responsible for grandchildren41 76.7% Not responsible for grandchildrenBlack or African American 15 49.2% Responsible for grandchildren15 50.8% Not responsible for grandchildrenWhite alone, not Hispanic / Latino 12 22.9% Responsible for grandchildren41 77.1% Not responsible for grandchildren