Races in Wenatchee, Washington (WA) Detailed Stats
Data:
Races - White alone (%)
Races - White alone (% change since 2000)
Races - Black alone (%)
Races - Black alone (% change since 2000)
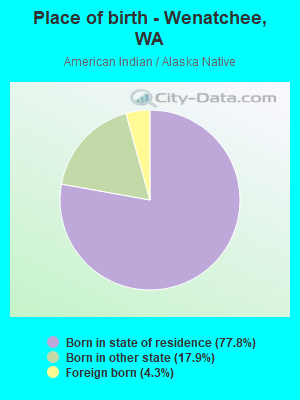
Races - American Indian alone (%)
Races - American Indian alone (% change since 2000)
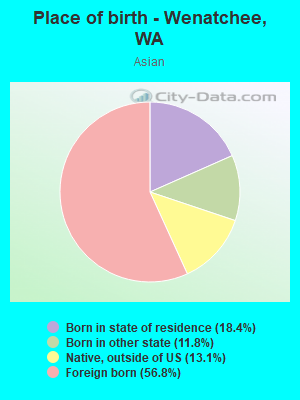
Races - Asian alone (%)
Races - Asian alone (% change since 2000)
Races - Hispanic (%)
Races - Hispanic (% change since 2000)
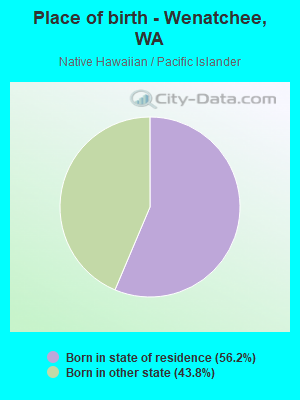
Races - Native Hawaiian and Other Pacific Islander alone (%)
Races - Native Hawaiian and Other Pacific Islander alone (% change since 2000)
Races - Two or more races(%)
Races - Two or more races(% change since 2000)
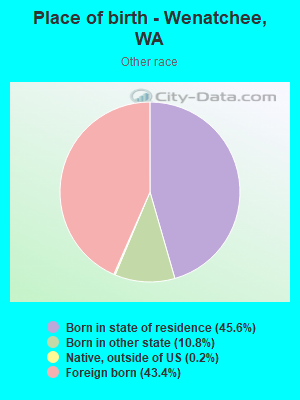
Races - Other race alone (%)
Races - Other race alone (% change since 2000)
Racial diversity
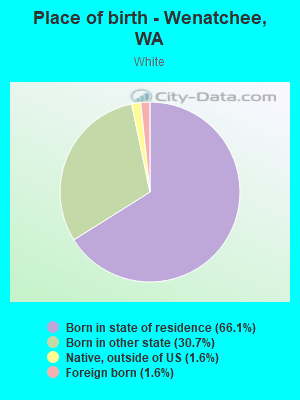
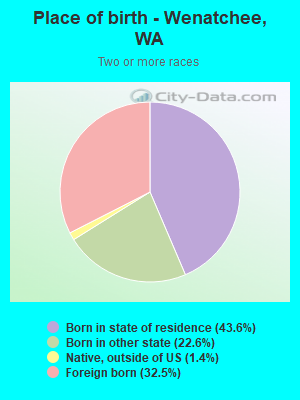
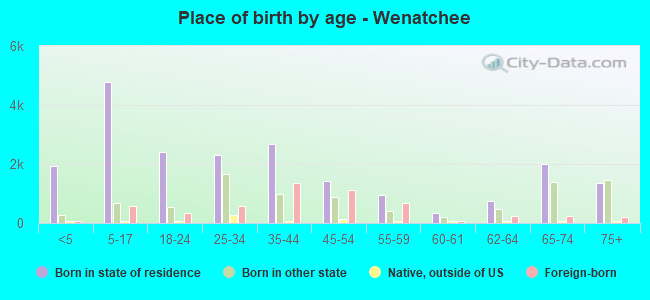
Place of birth - Born in state of residence (%)
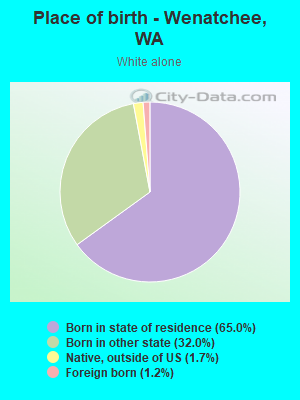
Place of birth - Born in state of residence (%) - White
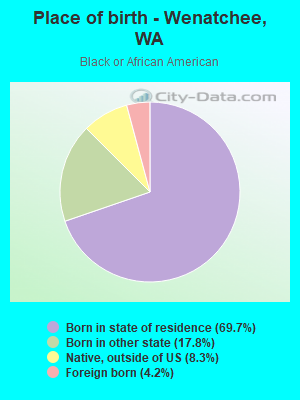
Place of birth - Born in state of residence (%) - Black or African American
Place of birth - Born in state of residence (%) - Asian
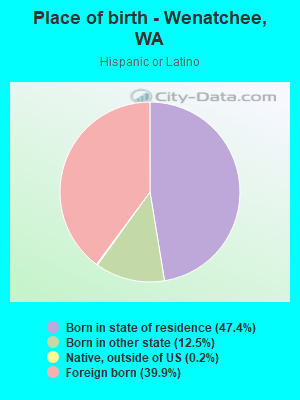
Place of birth - Born in state of residence (%) - Hispanic or Latino
Place of birth - Born in state of residence (%) - American Indian and Alaska Native
Place of birth - Born in state of residence (%) - Multirace
Place of birth - Born in state of residence (%) - Other Race
Place of birth - Born in other state (%)
Place of birth - Born in other state (%) - White
Place of birth - Born in other state (%) - Black or African American
Place of birth - Born in other state (%) - Asian
Place of birth - Born in other state (%) - Hispanic or Latino
Place of birth - Born in other state (%) - American Indian and Alaska Native
Place of birth - Born in other state (%) - Multirace
Place of birth - Born in other state (%) - Other Race
Place of birth - Native, outside of US (%)
Place of birth - Native, outside of US (%) - White
Place of birth - Native, outside of US (%) - Black or African American
Place of birth - Native, outside of US (%) - Asian
Place of birth - Native, outside of US (%) - Hispanic or Latino
Place of birth - Native, outside of US (%) - American Indian and Alaska Native
Place of birth - Native, outside of US (%) - Multirace
Place of birth - Native, outside of US (%) - Other Race
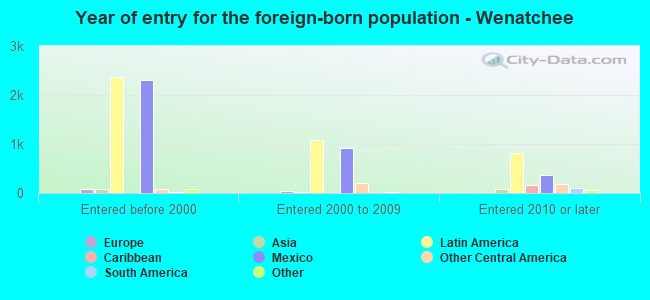
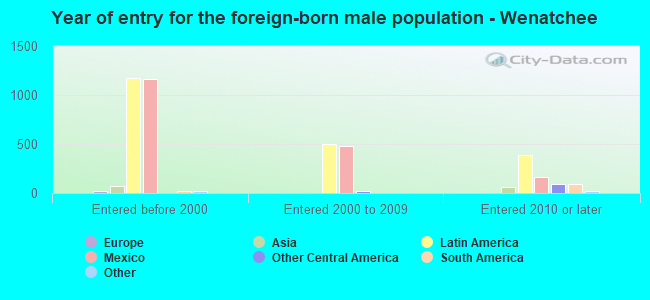
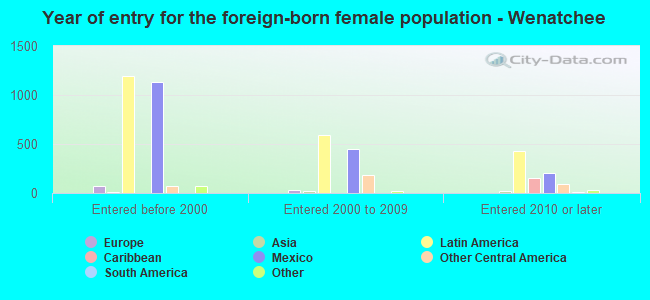
Place of birth - Foreign born (%)
Place of birth - Foreign born (%) - White
Place of birth - Foreign born (%) - Black or African American
Place of birth - Foreign born (%) - Asian
Place of birth - Foreign born (%) - Hispanic or Latino
Place of birth - Foreign born (%) - American Indian and Alaska Native
Place of birth - Foreign born (%) - Multirace
Place of birth - Foreign born (%) - Other Race
Residents speaking English at home (%)
Residents speaking English at home - Born in the United States (%)
Residents speaking English at home - Native, born elsewhere (%)
Residents speaking English at home - Foreign born (%)
Residents speaking Spanish at home (%)
Residents speaking Spanish at home - Born in the United States (%)
Residents speaking Spanish at home - Native, born elsewhere (%)
Residents speaking Spanish at home - Foreign born (%)
Residents speaking other language at home (%)
Residents speaking other language at home - Born in the United States (%)
Residents speaking other language at home - Native, born elsewhere (%)
Residents speaking other language at home - Foreign born (%)
Marital status - Never married (%)
Marital status - Now married (%)
Marital status - Separated (%)
Marital status - Widowed (%)
Marital status - Divorced (%)
Ancestries Reported - Arab (%)
Ancestries Reported - Czech (%)
Ancestries Reported - Danish (%)
Ancestries Reported - Dutch (%)
Ancestries Reported - English (%)
Ancestries Reported - French (%)
Ancestries Reported - French Canadian (%)
Ancestries Reported - German (%)
Ancestries Reported - Greek (%)
Ancestries Reported - Hungarian (%)
Ancestries Reported - Irish (%)
Ancestries Reported - Italian (%)
Ancestries Reported - Lithuanian (%)
Ancestries Reported - Norwegian (%)
Ancestries Reported - Polish (%)
Ancestries Reported - Portuguese (%)
Ancestries Reported - Russian (%)
Ancestries Reported - Scotch-Irish (%)
Ancestries Reported - Scottish (%)
Ancestries Reported - Slovak (%)
Ancestries Reported - Subsaharan African (%)
Ancestries Reported - Swedish (%)
Ancestries Reported - Swiss (%)
Ancestries Reported - Ukrainian (%)
Ancestries Reported - United States (%)
Ancestries Reported - Welsh (%)
Ancestries Reported - West Indian (%)
Ancestries Reported - Other (%)
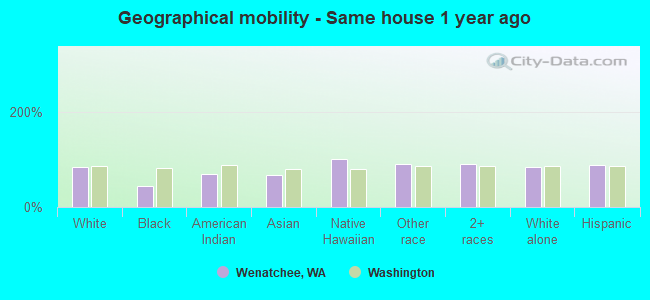
Geographical mobility - Same house 1 year ago (%)
Geographical mobility - Same house 1 year ago (%) - White
Geographical mobility - Same house 1 year ago (%) - Black or African American
Geographical mobility - Same house 1 year ago (%) - Asian
Geographical mobility - Same house 1 year ago (%) - Hispanic or Latino
Geographical mobility - Same house 1 year ago (%) - American Indian and Alaska Native
Geographical mobility - Same house 1 year ago (%) - Multirace
Geographical mobility - Same house 1 year ago (%) - Other Race
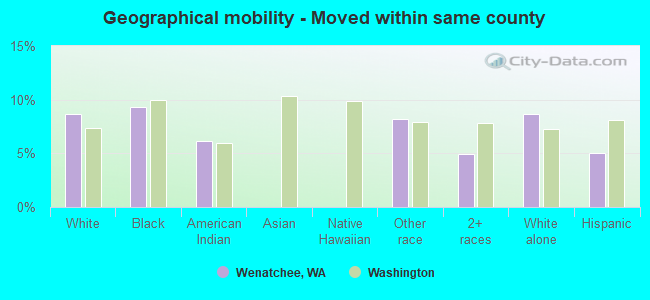
Geographical mobility - Moved within same county (%)
Geographical mobility - Moved within same county (%) - White
Geographical mobility - Moved within same county (%) - Black or African American
Geographical mobility - Moved within same county (%) - Asian
Geographical mobility - Moved within same county (%) - Hispanic or Latino
Geographical mobility - Moved within same county (%) - American Indian and Alaska Native
Geographical mobility - Moved within same county (%) - Multirace
Geographical mobility - Moved within same county (%) - Other Race
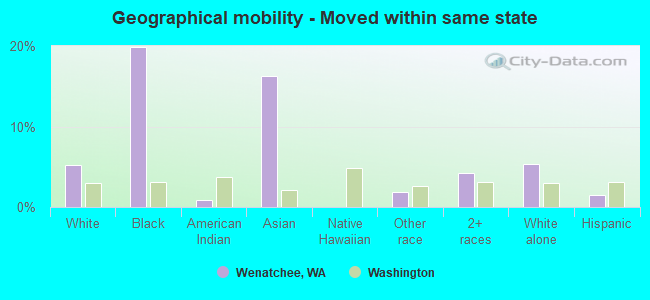
Geographical mobility - Moved from different county within same state (%)
Geographical mobility - Moved from different county within same state (%) - White
Geographical mobility - Moved from different county within same state (%) - Black or African American
Geographical mobility - Moved from different county within same state (%) - Asian
Geographical mobility - Moved from different county within same state (%) - Hispanic or Latino
Geographical mobility - Moved from different county within same state (%) - American Indian and Alaska Native
Geographical mobility - Moved from different county within same state (%) - Multirace
Geographical mobility - Moved from different county within same state (%) - Other Race
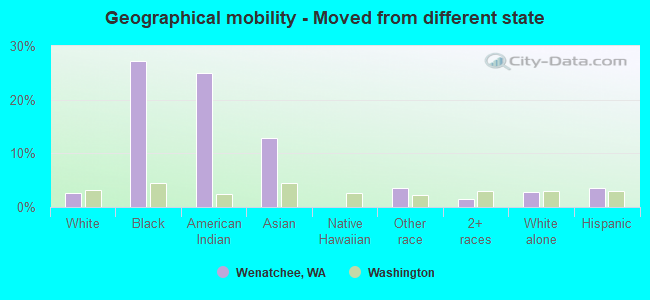
Geographical mobility - Moved from different state (%)
Geographical mobility - Moved from different state (%) - White
Geographical mobility - Moved from different state (%) - Black or African American
Geographical mobility - Moved from different state (%) - Asian
Geographical mobility - Moved from different state (%) - Hispanic or Latino
Geographical mobility - Moved from different state (%) - American Indian and Alaska Native
Geographical mobility - Moved from different state (%) - Multirace
Geographical mobility - Moved from different state (%) - Other Race
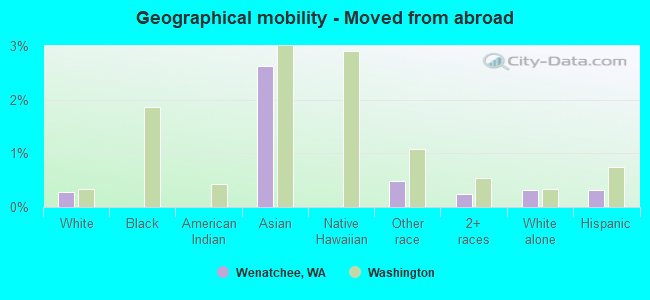
Geographical mobility - Moved from abroad (%)
Geographical mobility - Moved from abroad (%) - White
Geographical mobility - Moved from abroad (%) - Black or African American
Geographical mobility - Moved from abroad (%) - Asian
Geographical mobility - Moved from abroad (%) - Hispanic or Latino
Geographical mobility - Moved from abroad (%) - American Indian and Alaska Native
Geographical mobility - Moved from abroad (%) - Multirace
Geographical mobility - Moved from abroad (%) - Other Race
Place of birth for the foreign-born population - Ireland (%)
Place of birth for the foreign-born population - Denmark (%)
Place of birth for the foreign-born population - Norway (%)
Place of birth for the foreign-born population - Sweden (%)
Place of birth for the foreign-born population - United Kingdom (%)
Place of birth for the foreign-born population - England (%)
Place of birth for the foreign-born population - Scotland (%)
Place of birth for the foreign-born population - Other Northern Europe (%)
Place of birth for the foreign-born population - Austria (%)
Place of birth for the foreign-born population - Belgium (%)
Place of birth for the foreign-born population - France (%)
Place of birth for the foreign-born population - Germany (%)
Place of birth for the foreign-born population - Netherlands (%)
Place of birth for the foreign-born population - Switzerland (%)
Place of birth for the foreign-born population - Other Western Europe (%)
Place of birth for the foreign-born population - Greece (%)
Place of birth for the foreign-born population - Italy (%)
Place of birth for the foreign-born population - Portugal (%)
Place of birth for the foreign-born population - Spain (%)
Place of birth for the foreign-born population - Other Southern Europe (%)
Place of birth for the foreign-born population - Albania (%)
Place of birth for the foreign-born population - Belarus (%)
Place of birth for the foreign-born population - Bosnia and Herzegovina (%)
Place of birth for the foreign-born population - Bulgaria (%)
Place of birth for the foreign-born population - Croatia (%)
Place of birth for the foreign-born population - Czechoslovakia (%)
Place of birth for the foreign-born population - Hungary (%)
Place of birth for the foreign-born population - Latvia (%)
Place of birth for the foreign-born population - Lithuania (%)
Place of birth for the foreign-born population - North Macedonia (Macedonia) (%)
Place of birth for the foreign-born population - Moldova (%)
Place of birth for the foreign-born population - Poland (%)
Place of birth for the foreign-born population - Romania (%)
Place of birth for the foreign-born population - Russia (%)
Place of birth for the foreign-born population - Serbia (%)
Place of birth for the foreign-born population - Ukraine (%)
Place of birth for the foreign-born population - Other Eastern Europe (%)
Place of birth for the foreign-born population - China (%)
Place of birth for the foreign-born population - Hong Kong (%)
Place of birth for the foreign-born population - Taiwan (%)
Place of birth for the foreign-born population - Japan (%)
Place of birth for the foreign-born population - Korea (%)
Place of birth for the foreign-born population - Other Eastern Asia (%)
Place of birth for the foreign-born population - Afghanistan (%)
Place of birth for the foreign-born population - Bangladesh (%)
Place of birth for the foreign-born population - India (%)
Place of birth for the foreign-born population - Iran (%)
Place of birth for the foreign-born population - Kazakhstan (%)
Place of birth for the foreign-born population - Nepal (%)
Place of birth for the foreign-born population - Pakistan (%)
Place of birth for the foreign-born population - Sri Lanka (%)
Place of birth for the foreign-born population - Uzbekistan (%)
Place of birth for the foreign-born population - Other South Central Asia (%)
Place of birth for the foreign-born population - Burma (%)
Place of birth for the foreign-born population - Cambodia (%)
Place of birth for the foreign-born population - Indonesia (%)
Place of birth for the foreign-born population - Laos (%)
Place of birth for the foreign-born population - Malaysia (%)
Place of birth for the foreign-born population - Philippines (%)
Place of birth for the foreign-born population - Singapore (%)
Place of birth for the foreign-born population - Thailand (%)
Place of birth for the foreign-born population - Vietnam (%)
Place of birth for the foreign-born population - Other South Eastern Asia (%)
Place of birth for the foreign-born population - Armenia (%)
Place of birth for the foreign-born population - Iraq (%)
Place of birth for the foreign-born population - Israel (%)
Place of birth for the foreign-born population - Jordan (%)
Place of birth for the foreign-born population - Kuwait (%)
Place of birth for the foreign-born population - Lebanon (%)
Place of birth for the foreign-born population - Saudi Arabia (%)
Place of birth for the foreign-born population - Syria (%)
Place of birth for the foreign-born population - Turkey (%)
Place of birth for the foreign-born population - Yemen (%)
Place of birth for the foreign-born population - Other Western Asia (%)
Place of birth for the foreign-born population - Eritrea (%)
Place of birth for the foreign-born population - Ethiopia (%)
Place of birth for the foreign-born population - Kenya (%)
Place of birth for the foreign-born population - Somalia (%)
Place of birth for the foreign-born population - Uganda (%)
Place of birth for the foreign-born population - Zimbabwe (%)
Place of birth for the foreign-born population - Other Eastern Africa (%)
Place of birth for the foreign-born population - Cameroon (%)
Place of birth for the foreign-born population - Congo (%)
Place of birth for the foreign-born population - Democratic Republic of Congo (Zaire) (%)
Place of birth for the foreign-born population - Other Middle Africa (%)
Place of birth for the foreign-born population - Egypt (%)
Place of birth for the foreign-born population - Morocco (%)
Place of birth for the foreign-born population - Sudan (%)
Place of birth for the foreign-born population - Other Northern Africa (%)
Place of birth for the foreign-born population - South Africa (%)
Place of birth for the foreign-born population - Other Southern Africa (%)
Place of birth for the foreign-born population - Cabo Verde (%)
Place of birth for the foreign-born population - Ghana (%)
Place of birth for the foreign-born population - Liberia (%)
Place of birth for the foreign-born population - Nigeria (%)
Place of birth for the foreign-born population - Senegal (%)
Place of birth for the foreign-born population - Sierra Leone (%)
Place of birth for the foreign-born population - Other Western Africa (%)
Place of birth for the foreign-born population - Australia (%)
Place of birth for the foreign-born population - New Zealand (%)
Place of birth for the foreign-born population - Fiji (%)
Place of birth for the foreign-born population - Micronesia (%)
Place of birth for the foreign-born population - Bahamas (%)
Place of birth for the foreign-born population - Barbados (%)
Place of birth for the foreign-born population - Cuba (%)
Place of birth for the foreign-born population - Dominica (%)
Place of birth for the foreign-born population - Dominican Republic (%)
Place of birth for the foreign-born population - Grenada (%)
Place of birth for the foreign-born population - Haiti (%)
Place of birth for the foreign-born population - Jamaica (%)
Place of birth for the foreign-born population - St. Vincent and the Grenadines (%)
Place of birth for the foreign-born population - Trinidad and Tobago (%)
Place of birth for the foreign-born population - West Indies (%)
Place of birth for the foreign-born population - Other Caribbean (%)
Place of birth for the foreign-born population - Belize (%)
Place of birth for the foreign-born population - Costa Rica (%)
Place of birth for the foreign-born population - El Salvador (%)
Place of birth for the foreign-born population - Guatemala (%)
Place of birth for the foreign-born population - Honduras (%)
Place of birth for the foreign-born population - Mexico (%)
Place of birth for the foreign-born population - Nicaragua (%)
Place of birth for the foreign-born population - Panama (%)
Place of birth for the foreign-born population - Other Central America (%)
Place of birth for the foreign-born population - Argentina (%)
Place of birth for the foreign-born population - Bolivia (%)
Place of birth for the foreign-born population - Brazil (%)
Place of birth for the foreign-born population - Chile (%)
Place of birth for the foreign-born population - Colombia (%)
Place of birth for the foreign-born population - Ecuador (%)
Place of birth for the foreign-born population - Guyana (%)
Place of birth for the foreign-born population - Peru (%)
Place of birth for the foreign-born population - Uruguay (%)
Place of birth for the foreign-born population - Venezuela (%)
Place of birth for the foreign-born population - Other South America (%)
Place of birth for the foreign-born population - Canada (%)
Place of birth for the foreign-born population - Other Northern America (%)
Place of birth for the foreign-born population - Other (%)
Latest news about races in Wenatchee, WA collected exclusively by city-data.com from local newspapers, TV, and radio stations
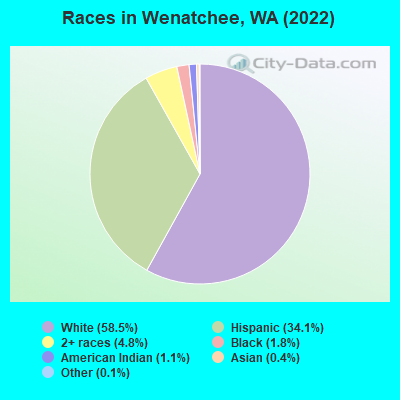
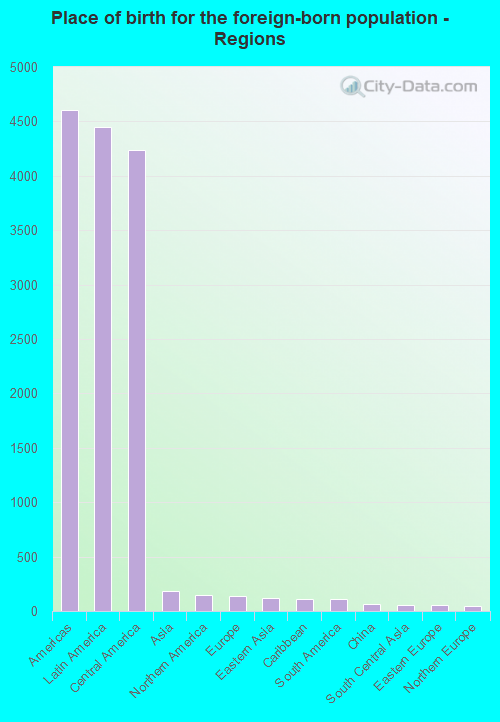
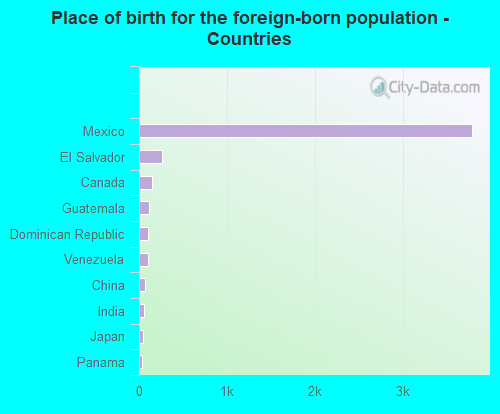
According to 2022 data, the most numerous races in Wenatchee, WA are White alone (20,903 residents), Hispanic (12,203 residents), and Asian alone (145 residents). 71.0% of Wenatchee residents speak English at home. 13.8% of Wenatchee, WA residents are foreign-born (12.1% born in Latin America), which is 8.6% less than the foreign-born rate of 15.0% across the entire state of Washington.
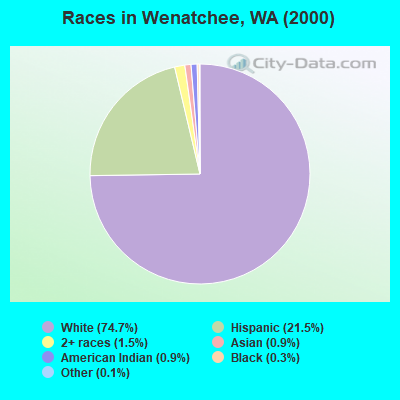
Race distribution in Wenatchee
2000 2022
4,652,490 78.9% White alone 441,509 7.5% Hispanic 319,401 5.4% Asian alone 184,631 3.1% Black alone 175,926 3.0% Two or more races 85,396 1.4% American Indian alone 22,779 0.4% Native Hawaiian and Other 11,989 0.2% Other race alone
4,941,456 63.5% White alone 1,093,313 14.0% Hispanic 755,832 9.7% Asian alone 523,448 6.7% Two or more races 299,537 3.8% Black alone 69,024 0.9% American Indian alone 52,231 0.7% Native Hawaiian and Other 50,945 0.7% Other race alone
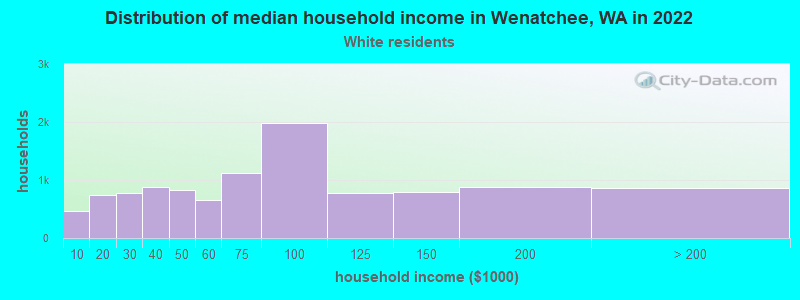
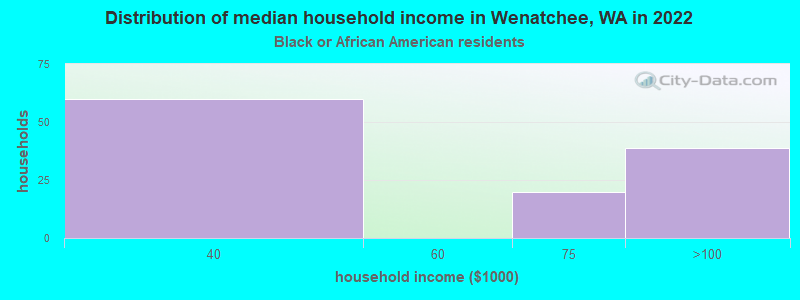
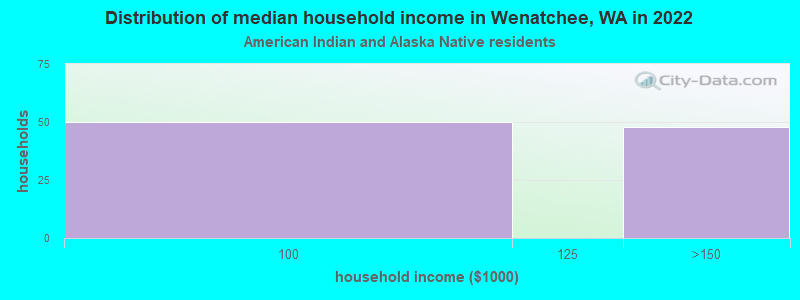
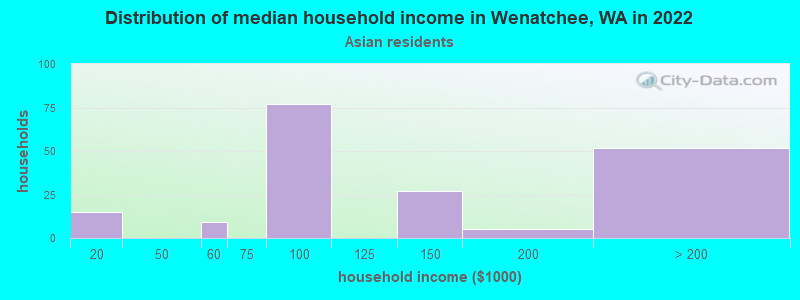
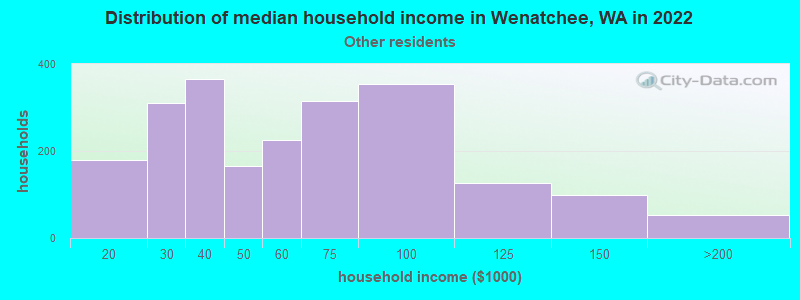
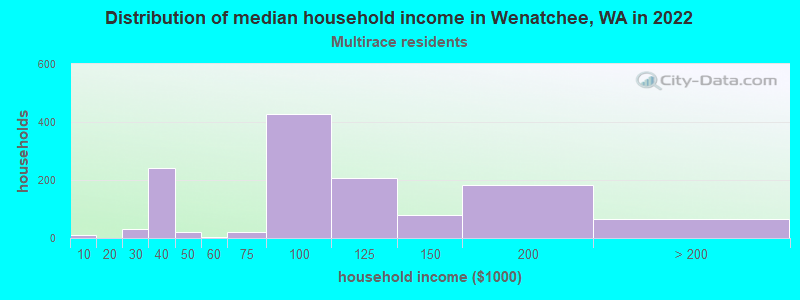
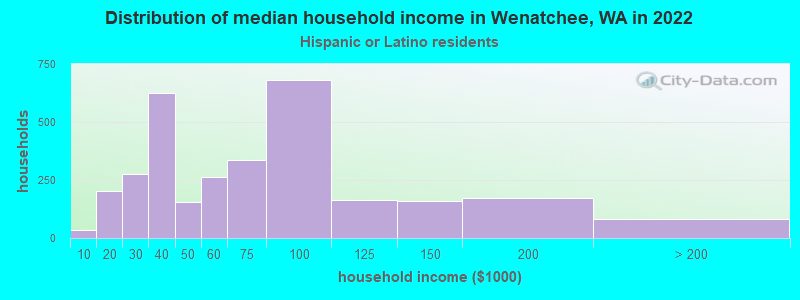
Income and house value in Wenatchee Median household income in 2022 $73,427 White non-Hispanic householders$80,342 American Indian and Alaska Native householders$95,089 Asian householders$85,468 Some other race householders$88,736 Two or more races householders$86,446 Hispanic or Latino race householdersMedian 2022 house value $446,002 White Non-Hispanic householders$332,136 Black or African American householders$381,728 American Indian or Alaska Native householders $463,947 Asian householders$339,314 Some other race householders$369,656 Two or more races householders$347,470 Hispanic or Latino householders
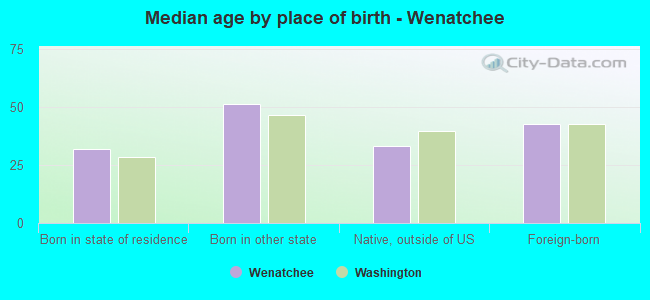
Median age by race in Wenatchee
43.4 Median age for White residents39.5 50.7 23.7 Median age for Black or African American residents21.8 22.1 65.6 Median age for American Indian / Alaska Native residents51.4 66.2 34.6 Median age for Asian residents40.5 41.1 -681,388,011.9 Median age for Native Hawaiian / Pacific Islander residents-666,666,666.0 -666,666,666.0 24.9 Median age for Other race residents24.9 23.4 31.5 Median age for Two or more races residents30.7 28.2 45.5 Median age for White alone residents40.6 51.9 26.0 Median age for Hispanic or Latino residents25.3 24.7
Owner/renter occupied households by race in Wenatchee
House owners and renters - White residents 6,196 57.4% Owner occupied4,595 42.6% Renter occupiedHouse owners and renters - Black or African American residents 128 100.0% Renter occupiedHouse owners and renters - American Indian / Alaska Native residents 70 82.1% Owner occupied15 17.9% Renter occupiedHouse owners and renters - Asian residents 67 36.9% Owner occupied116 63.1% Renter occupiedHouse owners and renters - Other race residents 1,384 63.8% Owner occupied784 36.2% Renter occupiedHouse owners and renters - Two or more races residents 569 43.9% Owner occupied726 56.1% Renter occupiedHouse owners and renters - White alone residents 6,060 57.9% Owner occupied4,406 42.1% Renter occupiedHouse owners and renters - Hispanic or Latino residents 1,906 56.1% Owner occupied1,491 43.9% Renter occupied
Language usage in Wenatchee
English speakers - Total 71.0% of residents of Wenatchee speak English at home.
28.2% of residents speak Spanish at home 5,826 61.8% Speak English very well3,604 38.2% Speak English less than very well1.1% of residents speak other language at home 287 81.1% Speak English very well67 18.9% Speak English less than very well
English speakers - Born in the United States 87.7% of residents of Wenatchee speak English at home.
10.8% of residents speak Spanish at home 870 95.2% Speak English very well44 4.8% Speak English less than very well1.1% of residents speak other language at home 90 100.0% Speak English very well
All residents speak only English at home
English speakers - Foreign-born 5.5% of residents of Wenatchee speak English at home.
92.5% of residents speak Spanish at home 1,860 38.2% Speak English very well3,015 61.8% Speak English less than very well3.7% of residents speak other language at home 136 69.7% Speak English very well59 30.3% Speak English less than very well
White (Caucasian) - Speak only English Native:
96.4% (20,028)Foreign-born:
46.5% (168)
White (Caucasian) - Speak another language Native:
3.6% (755)Foreign-born:
45.6% (165)
Black or African American - Speak another language Native:
9.8% (34)Foreign-born:
97.1% (15)
American Indian / Alaska Native - Speak another language Native:
11.6% (38)Foreign-born:
100.0% (15)
Asian - Speak only English Native:
72.4% (102)Foreign-born:
13.5% (23)
Asian - Speak another language Native:
27.0% (38)Foreign-born:
86.4% (144)
Other race - Speak only English Native:
15.5% (564)Foreign-born:
3.1% (110)
Other race - Speak another language Native:
84.3% (3,073)Foreign-born:
99.1% (3,488)
Two or more races - Speak only English Native:
78.4% (1,927)Foreign-born:
2.8% (42)
Two or more races - Speak another language Native:
18.3% (451)Foreign-born:
93.5% (1,395)
White alone - Speak only English Native:
99.0% (19,710)Foreign-born:
69.3% (176)
White alone - Speak another language Native:
1.2% (238)Foreign-born:
31.5% (80)
Hispanic or Latino - Speak only English Native:
23.4% (1,366)Foreign-born:
2.0% (98)
Hispanic or Latino - Speak another language Native:
76.1% (4,435)Foreign-born:
99.6% (4,831)
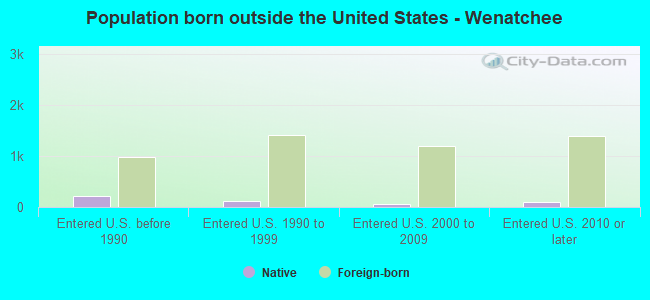
Foreign-born residents in Wenatchee 4,938 residents are foreign born (12.1% Latin America ).
This city:
13.8%Washington:
14.9%
Marital status for residents in Wenatchee Marital status - White (Caucasian) population 15 years and over
Males 35.7% Never married46.4% Now married0.8% Separated4.2% Widowed12.9% DivorcedFemales 26.2% Never married39.2% Now married3.0% Separated12.6% Widowed19.0% DivorcedWomen who gave birth in the past 12 months Now married:
65.1% (150)Unmarried:
34.9% (81)
Women who did not give birth in the past 12 months Now married:
38.4% (1,603)Unmarried:
61.6% (2,568)
Marital status - Black or African American population 15 years and over
Males 75.9% Never married0.0% Now married0.0% Separated0.0% Widowed24.1% DivorcedFemales 79.7% Never married20.3% Now married0.0% Separated0.0% Widowed0.0% DivorcedWomen who gave birth in the past 12 months Now married:
100.0% (38)Unmarried:
0.0% (0)
Women who did not give birth in the past 12 months Now married:
0.0% (0)Unmarried:
100.0% (149)
Marital status - American Indian / Alaska Native population 15 years and over
Males 17.9% Never married23.2% Now married0.0% Separated0.0% Widowed58.9% DivorcedFemales 49.4% Never married35.1% Now married14.7% Separated0.8% Widowed0.0% DivorcedWomen who gave birth in the past 12 months Now married:
0.0% (0)Unmarried:
100.0% (4)
Women who did not give birth in the past 12 months Now married:
42.2% (102)Unmarried:
57.8% (139)
Marital status - Asian population 15 years and over
Males 83.3% Never married6.5% Now married0.0% Separated0.0% Widowed10.1% DivorcedFemales 31.5% Never married54.8% Now married0.0% Separated0.0% Widowed13.7% DivorcedWomen who did not give birth in the past 12 months Now married:
50.0% (36)Unmarried:
50.0% (36)
Marital status - Native Hawaiian / Pacific Islander population 15 years and over
Males 0.0% Never married100.0% Now married0.0% Separated0.0% Widowed0.0% DivorcedFemales 0.0% Never married0.0% Now married100.0% Separated0.0% Widowed0.0% DivorcedMarital status - Other race population 15 years and over
Males 44.6% Never married52.8% Now married0.0% Separated0.0% Widowed2.6% DivorcedFemales 45.8% Never married44.3% Now married1.6% Separated1.5% Widowed6.7% DivorcedWomen who gave birth in the past 12 months Now married:
100.0% (119)Unmarried:
0.0% (0)
Women who did not give birth in the past 12 months Now married:
33.6% (694)Unmarried:
66.4% (1,372)
Marital status - Two or more races population 15 years and over
Males 33.2% Never married55.4% Now married0.5% Separated0.0% Widowed10.9% DivorcedFemales 42.2% Never married35.4% Now married0.0% Separated4.3% Widowed18.1% DivorcedWomen who gave birth in the past 12 months Now married:
100.0% (80)Unmarried:
0.0% (0)
Women who did not give birth in the past 12 months Now married:
27.5% (276)Unmarried:
72.5% (727)
Marital status - White alone, not Hispanic / Latino population 15 years and over
Males 35.5% Never married46.1% Now married0.8% Separated4.1% Widowed13.5% DivorcedFemales 26.0% Never married39.2% Now married3.1% Separated13.2% Widowed18.4% DivorcedWomen who gave birth in the past 12 months Now married:
63.7% (146)Unmarried:
36.3% (83)
Women who did not give birth in the past 12 months Now married:
38.7% (1,531)Unmarried:
61.3% (2,422)
Marital status - Hispanic or Latino population 15 years and over
Males 38.9% Never married55.2% Now married0.0% Separated0.6% Widowed5.4% DivorcedFemales 45.4% Never married38.6% Now married1.0% Separated2.0% Widowed13.0% DivorcedWomen who gave birth in the past 12 months Now married:
100.0% (167)Unmarried:
0.0% (0)
Women who did not give birth in the past 12 months Now married:
31.8% (973)Unmarried:
68.2% (2,081)
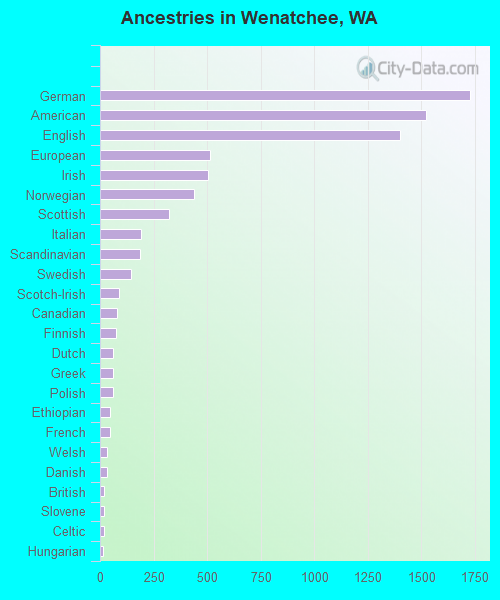
Ancestries in Wenatchee
1,730 8.6% German1,520 7.5% American1,401 6.9% English513 2.5% European506 2.5% Irish437 2.2% Norwegian321 1.6% Scottish193 1.0% Italian186 0.9% Scandinavian146 0.7% Swedish87 0.4% Scotch-Irish81 0.4% Canadian77 0.4% Finnish61 0.3% Dutch59 0.3% Greek59 0.3% Polish49 0.2% Ethiopian47 0.2% French32 0.2% Welsh31 0.2% Danish21 0.1% British21 0.1% Slovene17 0.08% Celtic16 0.08% Hungarian15 0.07% Austrian14 0.07% Yugoslavian13 0.06% Lithuanian13 0.06% Romanian12 0.06% African11 0.05% Russian10 0.05% Croatian6 0.03% Northern European
Geographical mobility in Wenatchee Same house 1 year ago 18,211 83.8% White (Caucasian)158 43.5% Black or African American247 68.9% American Indian / Alaska Native216 66.9% Asian23 100.0% Native Hawaiian / Pacific Islander7,237 90.1% Other race4,646 90.2% Two or more races17,269 83.3% White alone, not Hispanic / Latino10,476 87.6% Hispanic or LatinoMoved within same county 1,888 8.7% White / Caucasian34 9.3% Black or African American22 6.2% American Indian / Alaska Native657 8.2% Other race257 5.0% Two or more races1,801 8.7% White alone, not Hispanic / Latino598 5.0% Hispanic or LatinoMoved within same state 1,125 5.2% White / Caucasian72 19.9% Black or African American3 0.8% American Indian / Alaska Native52 16.3% Asian149 1.9% Other race219 4.2% Two or more races1,110 5.4% White alone, not Hispanic / Latino183 1.5% Hispanic or LatinoMoved from different state 581 2.7% White / Caucasian99 27.3% Black or African American89 24.9% American Indian / Alaska Native41 12.9% Asian289 3.6% Other race74 1.4% Two or more races590 2.8% White alone, not Hispanic / Latino423 3.5% Hispanic or LatinoMoved from abroad 61 0.3% White8 2.6% Asian39 0.5% Other race13 0.3% Two or more races67 0.3% White alone, not Hispanic / Latino37 0.3% Hispanic or Latino
Children Nativity (place of birth) in Wenatchee
Children under 6 years - Living with two parents Both parents native 1,132 98.9% Native13 1.1% Foreign-bornBoth parents foreign-born 274 97.7% Native6 2.3% Foreign-bornOne native, one foreign-born parent 343 100.0% NativeChildren under 6 years - Living with one parent Native parent 451 100.0% NativeForeign-born parent 411 100.0% NativeChildren 6 to 17 years - Living with two parents Both parents native 1,980 100.0% NativeBoth parents foreign-born 1,028 96.3% Native39 3.7% Foreign-bornOne native, one foreign-born parent 556 87.7% Native78 12.3% Foreign-bornChildren 6 to 17 years - Living with one parent Native parent 1,054 100.0% NativeForeign-born parent 900 53.0% Native797 47.0% Foreign-born
Grandparents responsible for own grandchildren in Wenatchee
Grandparents (30 to 59 years) White / Caucasian 41 40.3% Responsible for grandchildren61 59.7% Not responsible for grandchildrenOther race 51 100.0% Responsible for grandchildrenTwo or more races 159 100.0% Not responsible for grandchildrenWhite alone, not Hispanic / Latino 40 37.6% Responsible for grandchildren67 62.4% Not responsible for grandchildrenHispanic or Latino 71 33.1% Responsible for grandchildren144 66.9% Not responsible for grandchildren
Grandparents (60 years and over) White / Caucasian 110 100.0% Not responsible for grandchildrenOther race 26 100.0% Not responsible for grandchildrenTwo or more races 169 100.0% Not responsible for grandchildrenWhite alone, not Hispanic / Latino 114 100.0% Not responsible for grandchildrenHispanic or Latino 131 100.0% Not responsible for grandchildren