Races in Wentzville, Missouri (MO) Detailed Stats
Data:
Races - White alone (%)
Races - White alone (% change since 2000)
Races - Black alone (%)
Races - Black alone (% change since 2000)
Races - American Indian alone (%)
Races - American Indian alone (% change since 2000)
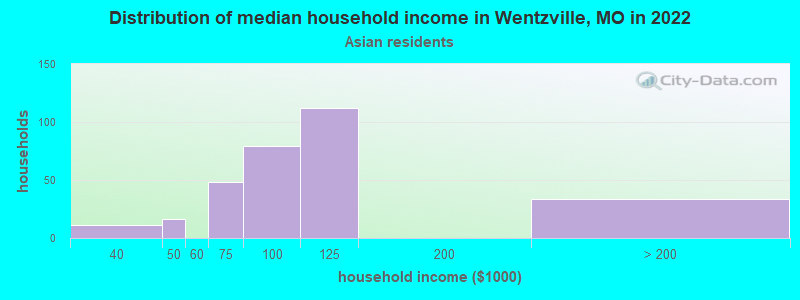
Races - Asian alone (%)
Races - Asian alone (% change since 2000)
Races - Hispanic (%)
Races - Hispanic (% change since 2000)
Races - Native Hawaiian and Other Pacific Islander alone (%)
Races - Native Hawaiian and Other Pacific Islander alone (% change since 2000)
Races - Two or more races(%)
Races - Two or more races(% change since 2000)
Races - Other race alone (%)
Races - Other race alone (% change since 2000)
Racial diversity
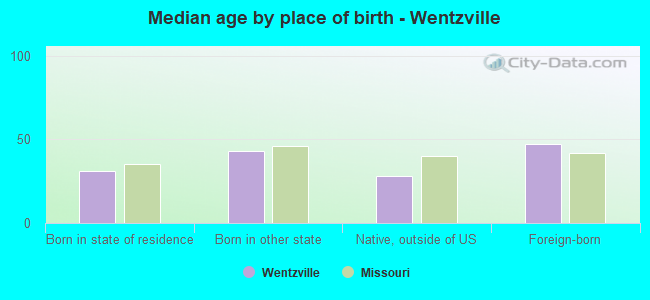
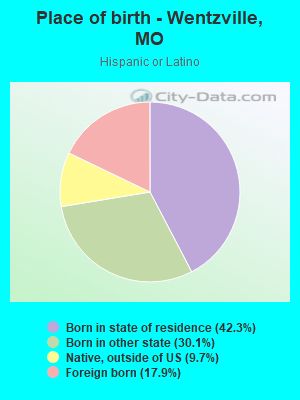
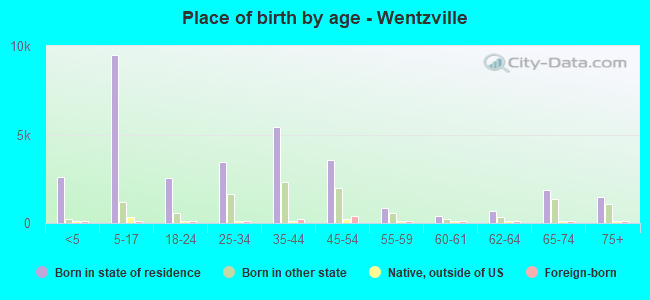
Place of birth - Born in state of residence (%)
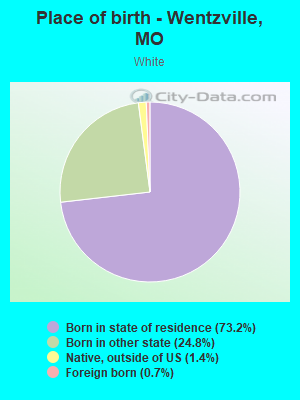
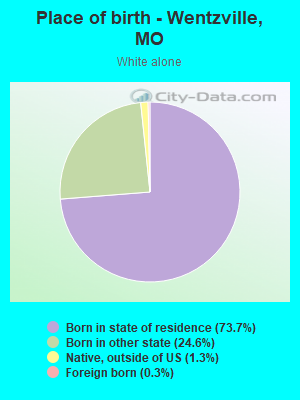
Place of birth - Born in state of residence (%) - White
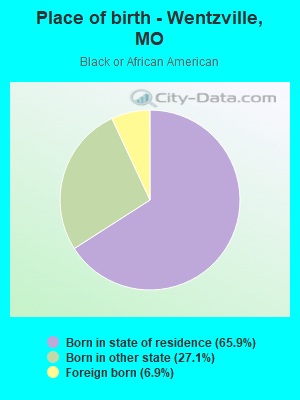
Place of birth - Born in state of residence (%) - Black or African American
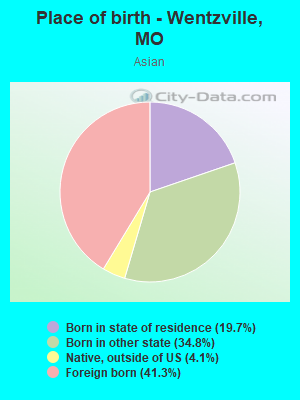
Place of birth - Born in state of residence (%) - Asian
Place of birth - Born in state of residence (%) - Hispanic or Latino
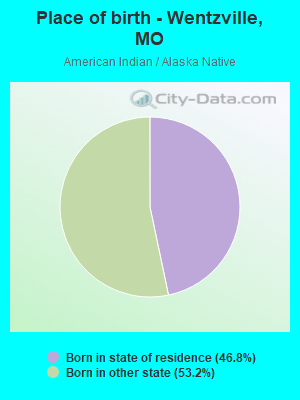
Place of birth - Born in state of residence (%) - American Indian and Alaska Native
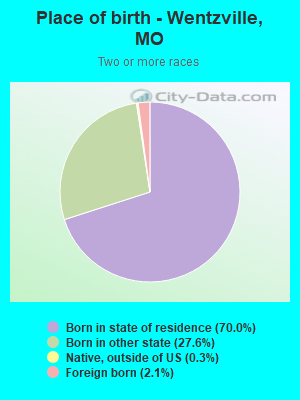
Place of birth - Born in state of residence (%) - Multirace
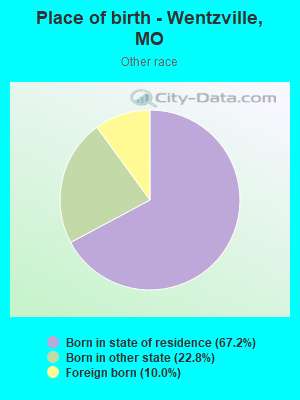
Place of birth - Born in state of residence (%) - Other Race
Place of birth - Born in other state (%)
Place of birth - Born in other state (%) - White
Place of birth - Born in other state (%) - Black or African American
Place of birth - Born in other state (%) - Asian
Place of birth - Born in other state (%) - Hispanic or Latino
Place of birth - Born in other state (%) - American Indian and Alaska Native
Place of birth - Born in other state (%) - Multirace
Place of birth - Born in other state (%) - Other Race
Place of birth - Native, outside of US (%)
Place of birth - Native, outside of US (%) - White
Place of birth - Native, outside of US (%) - Black or African American
Place of birth - Native, outside of US (%) - Asian
Place of birth - Native, outside of US (%) - Hispanic or Latino
Place of birth - Native, outside of US (%) - American Indian and Alaska Native
Place of birth - Native, outside of US (%) - Multirace
Place of birth - Native, outside of US (%) - Other Race
Place of birth - Foreign born (%)
Place of birth - Foreign born (%) - White
Place of birth - Foreign born (%) - Black or African American
Place of birth - Foreign born (%) - Asian
Place of birth - Foreign born (%) - Hispanic or Latino
Place of birth - Foreign born (%) - American Indian and Alaska Native
Place of birth - Foreign born (%) - Multirace
Place of birth - Foreign born (%) - Other Race
Residents speaking English at home (%)
Residents speaking English at home - Born in the United States (%)
Residents speaking English at home - Native, born elsewhere (%)
Residents speaking English at home - Foreign born (%)
Residents speaking Spanish at home (%)
Residents speaking Spanish at home - Born in the United States (%)
Residents speaking Spanish at home - Native, born elsewhere (%)
Residents speaking Spanish at home - Foreign born (%)
Residents speaking other language at home (%)
Residents speaking other language at home - Born in the United States (%)
Residents speaking other language at home - Native, born elsewhere (%)
Residents speaking other language at home - Foreign born (%)
Marital status - Never married (%)
Marital status - Now married (%)
Marital status - Separated (%)
Marital status - Widowed (%)
Marital status - Divorced (%)
Ancestries Reported - Arab (%)
Ancestries Reported - Czech (%)
Ancestries Reported - Danish (%)
Ancestries Reported - Dutch (%)
Ancestries Reported - English (%)
Ancestries Reported - French (%)
Ancestries Reported - French Canadian (%)
Ancestries Reported - German (%)
Ancestries Reported - Greek (%)
Ancestries Reported - Hungarian (%)
Ancestries Reported - Irish (%)
Ancestries Reported - Italian (%)
Ancestries Reported - Lithuanian (%)
Ancestries Reported - Norwegian (%)
Ancestries Reported - Polish (%)
Ancestries Reported - Portuguese (%)
Ancestries Reported - Russian (%)
Ancestries Reported - Scotch-Irish (%)
Ancestries Reported - Scottish (%)
Ancestries Reported - Slovak (%)
Ancestries Reported - Subsaharan African (%)
Ancestries Reported - Swedish (%)
Ancestries Reported - Swiss (%)
Ancestries Reported - Ukrainian (%)
Ancestries Reported - United States (%)
Ancestries Reported - Welsh (%)
Ancestries Reported - West Indian (%)
Ancestries Reported - Other (%)
Geographical mobility - Same house 1 year ago (%)
Geographical mobility - Same house 1 year ago (%) - White
Geographical mobility - Same house 1 year ago (%) - Black or African American
Geographical mobility - Same house 1 year ago (%) - Asian
Geographical mobility - Same house 1 year ago (%) - Hispanic or Latino
Geographical mobility - Same house 1 year ago (%) - American Indian and Alaska Native
Geographical mobility - Same house 1 year ago (%) - Multirace
Geographical mobility - Same house 1 year ago (%) - Other Race
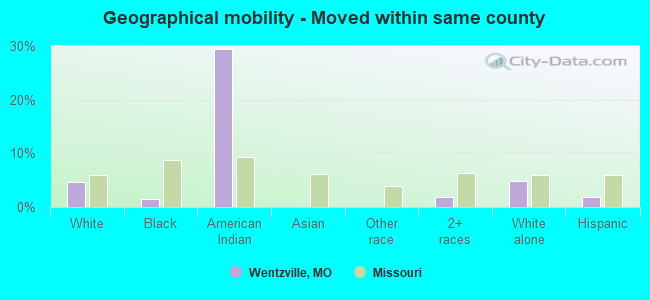
Geographical mobility - Moved within same county (%)
Geographical mobility - Moved within same county (%) - White
Geographical mobility - Moved within same county (%) - Black or African American
Geographical mobility - Moved within same county (%) - Asian
Geographical mobility - Moved within same county (%) - Hispanic or Latino
Geographical mobility - Moved within same county (%) - American Indian and Alaska Native
Geographical mobility - Moved within same county (%) - Multirace
Geographical mobility - Moved within same county (%) - Other Race
Geographical mobility - Moved from different county within same state (%)
Geographical mobility - Moved from different county within same state (%) - White
Geographical mobility - Moved from different county within same state (%) - Black or African American
Geographical mobility - Moved from different county within same state (%) - Asian
Geographical mobility - Moved from different county within same state (%) - Hispanic or Latino
Geographical mobility - Moved from different county within same state (%) - American Indian and Alaska Native
Geographical mobility - Moved from different county within same state (%) - Multirace
Geographical mobility - Moved from different county within same state (%) - Other Race
Geographical mobility - Moved from different state (%)
Geographical mobility - Moved from different state (%) - White
Geographical mobility - Moved from different state (%) - Black or African American
Geographical mobility - Moved from different state (%) - Asian
Geographical mobility - Moved from different state (%) - Hispanic or Latino
Geographical mobility - Moved from different state (%) - American Indian and Alaska Native
Geographical mobility - Moved from different state (%) - Multirace
Geographical mobility - Moved from different state (%) - Other Race
Geographical mobility - Moved from abroad (%)
Geographical mobility - Moved from abroad (%) - White
Geographical mobility - Moved from abroad (%) - Black or African American
Geographical mobility - Moved from abroad (%) - Asian
Geographical mobility - Moved from abroad (%) - Hispanic or Latino
Geographical mobility - Moved from abroad (%) - American Indian and Alaska Native
Geographical mobility - Moved from abroad (%) - Multirace
Geographical mobility - Moved from abroad (%) - Other Race
Place of birth for the foreign-born population - Ireland (%)
Place of birth for the foreign-born population - Denmark (%)
Place of birth for the foreign-born population - Norway (%)
Place of birth for the foreign-born population - Sweden (%)
Place of birth for the foreign-born population - United Kingdom (%)
Place of birth for the foreign-born population - England (%)
Place of birth for the foreign-born population - Scotland (%)
Place of birth for the foreign-born population - Other Northern Europe (%)
Place of birth for the foreign-born population - Austria (%)
Place of birth for the foreign-born population - Belgium (%)
Place of birth for the foreign-born population - France (%)
Place of birth for the foreign-born population - Germany (%)
Place of birth for the foreign-born population - Netherlands (%)
Place of birth for the foreign-born population - Switzerland (%)
Place of birth for the foreign-born population - Other Western Europe (%)
Place of birth for the foreign-born population - Greece (%)
Place of birth for the foreign-born population - Italy (%)
Place of birth for the foreign-born population - Portugal (%)
Place of birth for the foreign-born population - Spain (%)
Place of birth for the foreign-born population - Other Southern Europe (%)
Place of birth for the foreign-born population - Albania (%)
Place of birth for the foreign-born population - Belarus (%)
Place of birth for the foreign-born population - Bosnia and Herzegovina (%)
Place of birth for the foreign-born population - Bulgaria (%)
Place of birth for the foreign-born population - Croatia (%)
Place of birth for the foreign-born population - Czechoslovakia (%)
Place of birth for the foreign-born population - Hungary (%)
Place of birth for the foreign-born population - Latvia (%)
Place of birth for the foreign-born population - Lithuania (%)
Place of birth for the foreign-born population - North Macedonia (Macedonia) (%)
Place of birth for the foreign-born population - Moldova (%)
Place of birth for the foreign-born population - Poland (%)
Place of birth for the foreign-born population - Romania (%)
Place of birth for the foreign-born population - Russia (%)
Place of birth for the foreign-born population - Serbia (%)
Place of birth for the foreign-born population - Ukraine (%)
Place of birth for the foreign-born population - Other Eastern Europe (%)
Place of birth for the foreign-born population - China (%)
Place of birth for the foreign-born population - Hong Kong (%)
Place of birth for the foreign-born population - Taiwan (%)
Place of birth for the foreign-born population - Japan (%)
Place of birth for the foreign-born population - Korea (%)
Place of birth for the foreign-born population - Other Eastern Asia (%)
Place of birth for the foreign-born population - Afghanistan (%)
Place of birth for the foreign-born population - Bangladesh (%)
Place of birth for the foreign-born population - India (%)
Place of birth for the foreign-born population - Iran (%)
Place of birth for the foreign-born population - Kazakhstan (%)
Place of birth for the foreign-born population - Nepal (%)
Place of birth for the foreign-born population - Pakistan (%)
Place of birth for the foreign-born population - Sri Lanka (%)
Place of birth for the foreign-born population - Uzbekistan (%)
Place of birth for the foreign-born population - Other South Central Asia (%)
Place of birth for the foreign-born population - Burma (%)
Place of birth for the foreign-born population - Cambodia (%)
Place of birth for the foreign-born population - Indonesia (%)
Place of birth for the foreign-born population - Laos (%)
Place of birth for the foreign-born population - Malaysia (%)
Place of birth for the foreign-born population - Philippines (%)
Place of birth for the foreign-born population - Singapore (%)
Place of birth for the foreign-born population - Thailand (%)
Place of birth for the foreign-born population - Vietnam (%)
Place of birth for the foreign-born population - Other South Eastern Asia (%)
Place of birth for the foreign-born population - Armenia (%)
Place of birth for the foreign-born population - Iraq (%)
Place of birth for the foreign-born population - Israel (%)
Place of birth for the foreign-born population - Jordan (%)
Place of birth for the foreign-born population - Kuwait (%)
Place of birth for the foreign-born population - Lebanon (%)
Place of birth for the foreign-born population - Saudi Arabia (%)
Place of birth for the foreign-born population - Syria (%)
Place of birth for the foreign-born population - Turkey (%)
Place of birth for the foreign-born population - Yemen (%)
Place of birth for the foreign-born population - Other Western Asia (%)
Place of birth for the foreign-born population - Eritrea (%)
Place of birth for the foreign-born population - Ethiopia (%)
Place of birth for the foreign-born population - Kenya (%)
Place of birth for the foreign-born population - Somalia (%)
Place of birth for the foreign-born population - Uganda (%)
Place of birth for the foreign-born population - Zimbabwe (%)
Place of birth for the foreign-born population - Other Eastern Africa (%)
Place of birth for the foreign-born population - Cameroon (%)
Place of birth for the foreign-born population - Congo (%)
Place of birth for the foreign-born population - Democratic Republic of Congo (Zaire) (%)
Place of birth for the foreign-born population - Other Middle Africa (%)
Place of birth for the foreign-born population - Egypt (%)
Place of birth for the foreign-born population - Morocco (%)
Place of birth for the foreign-born population - Sudan (%)
Place of birth for the foreign-born population - Other Northern Africa (%)
Place of birth for the foreign-born population - South Africa (%)
Place of birth for the foreign-born population - Other Southern Africa (%)
Place of birth for the foreign-born population - Cabo Verde (%)
Place of birth for the foreign-born population - Ghana (%)
Place of birth for the foreign-born population - Liberia (%)
Place of birth for the foreign-born population - Nigeria (%)
Place of birth for the foreign-born population - Senegal (%)
Place of birth for the foreign-born population - Sierra Leone (%)
Place of birth for the foreign-born population - Other Western Africa (%)
Place of birth for the foreign-born population - Australia (%)
Place of birth for the foreign-born population - New Zealand (%)
Place of birth for the foreign-born population - Fiji (%)
Place of birth for the foreign-born population - Micronesia (%)
Place of birth for the foreign-born population - Bahamas (%)
Place of birth for the foreign-born population - Barbados (%)
Place of birth for the foreign-born population - Cuba (%)
Place of birth for the foreign-born population - Dominica (%)
Place of birth for the foreign-born population - Dominican Republic (%)
Place of birth for the foreign-born population - Grenada (%)
Place of birth for the foreign-born population - Haiti (%)
Place of birth for the foreign-born population - Jamaica (%)
Place of birth for the foreign-born population - St. Vincent and the Grenadines (%)
Place of birth for the foreign-born population - Trinidad and Tobago (%)
Place of birth for the foreign-born population - West Indies (%)
Place of birth for the foreign-born population - Other Caribbean (%)
Place of birth for the foreign-born population - Belize (%)
Place of birth for the foreign-born population - Costa Rica (%)
Place of birth for the foreign-born population - El Salvador (%)
Place of birth for the foreign-born population - Guatemala (%)
Place of birth for the foreign-born population - Honduras (%)
Place of birth for the foreign-born population - Mexico (%)
Place of birth for the foreign-born population - Nicaragua (%)
Place of birth for the foreign-born population - Panama (%)
Place of birth for the foreign-born population - Other Central America (%)
Place of birth for the foreign-born population - Argentina (%)
Place of birth for the foreign-born population - Bolivia (%)
Place of birth for the foreign-born population - Brazil (%)
Place of birth for the foreign-born population - Chile (%)
Place of birth for the foreign-born population - Colombia (%)
Place of birth for the foreign-born population - Ecuador (%)
Place of birth for the foreign-born population - Guyana (%)
Place of birth for the foreign-born population - Peru (%)
Place of birth for the foreign-born population - Uruguay (%)
Place of birth for the foreign-born population - Venezuela (%)
Place of birth for the foreign-born population - Other South America (%)
Place of birth for the foreign-born population - Canada (%)
Place of birth for the foreign-born population - Other Northern America (%)
Place of birth for the foreign-born population - Other (%)
Latest news about races in Wentzville, MO collected exclusively by city-data.com from local newspapers, TV, and radio stations
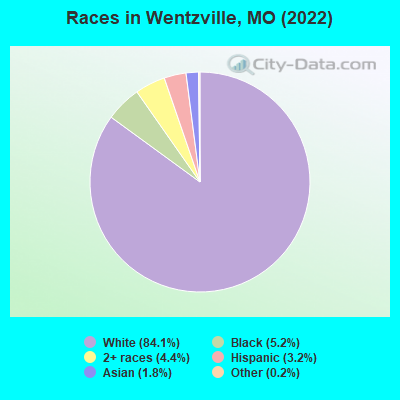
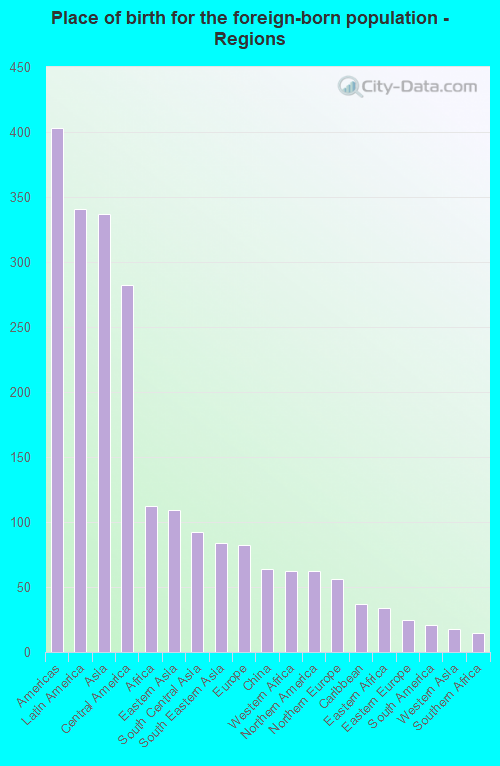
According to 2022 data, the most numerous races in Wentzville, MO are White alone (38,206 residents), Black alone (2,367 residents), and Two or more races (2,013 residents). 96.9% of Wentzville residents speak English at home. 2.1% of Wentzville, MO residents are foreign-born (0.8% born in Latin America, 0.8% born in Asia, 0.3% born in Africa), which is 94.1% less than the foreign-born rate of 4.0% across the entire state of Missouri.
Race distribution in Wentzville
2000 2022
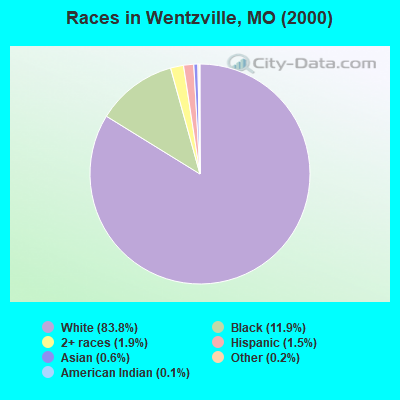
4,686,474 83.8% White alone 625,667 11.2% Black alone 118,592 2.1% Hispanic 71,905 1.3% Two or more races 61,041 1.1% Asian alone 23,302 0.4% American Indian alone 5,291 0.09% Other race alone 2,939 0.05% Native Hawaiian and Other
4,733,411 76.6% White alone 656,739 10.6% Black alone 316,300 5.1% Two or more races 291,763 4.7% Hispanic 132,436 2.1% Asian alone 27,467 0.4% Other race alone 12,313 0.2% American Indian alone 7,528 0.1% Native Hawaiian and Other
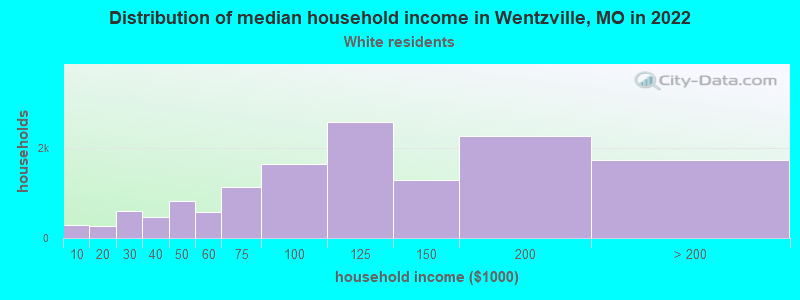
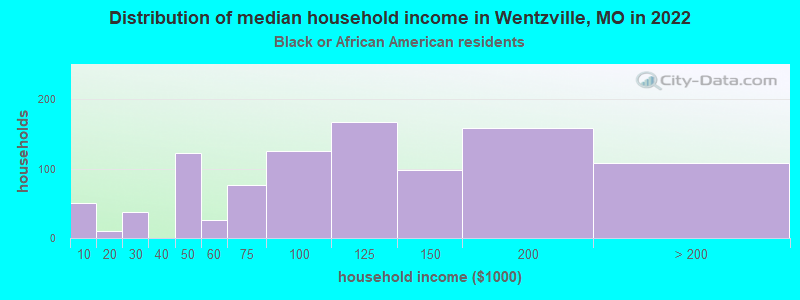
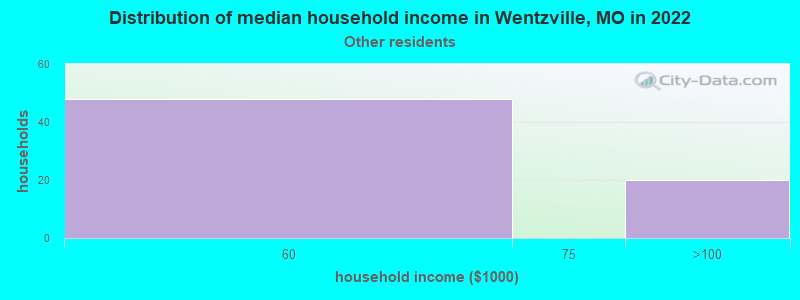
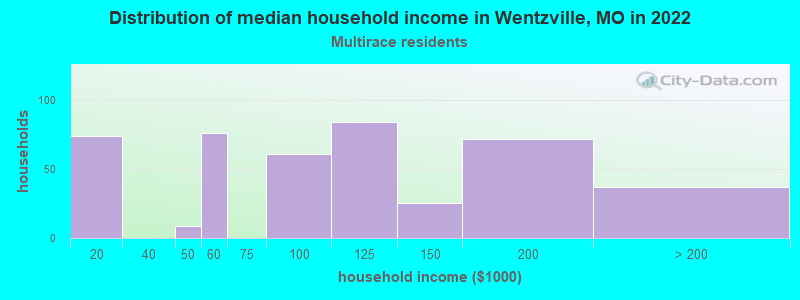
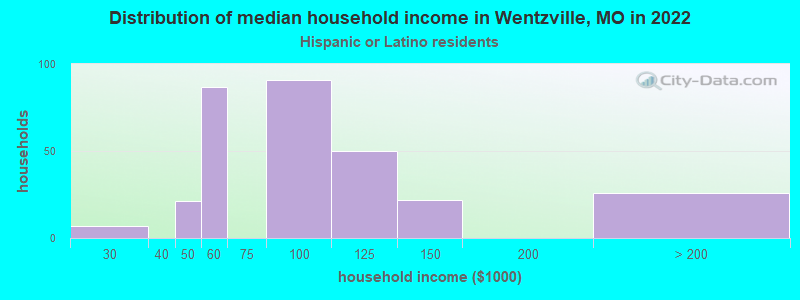
Income and house value in Wentzville Median household income in 2022 $109,554 White non-Hispanic householders$131,637 Black householders$87,542 Asian householders$66,567 Some other race householders$101,944 Two or more races householders$75,341 Hispanic or Latino race householdersMedian 2022 house value $317,134 White Non-Hispanic householders$299,004 Black or African American householders$274,180 American Indian or Alaska Native householders $237,083 Asian householders
Median age by race in Wentzville
36.2 Median age for White residents35.3 37.1 35.7 Median age for Black or African American residents32.2 40.2 73.0 Median age for American Indian / Alaska Native residents-658,692,184.3 69.1 42.5 Median age for Asian residents47.6 40.2 -693,430,656.2 Median age for Native Hawaiian / Pacific Islander residents-683,513,838.1 -752,136,751.4 19.8 Median age for Other race residents21.3 3.4 15.1 Median age for Two or more races residents18.3 12.2 36.2 Median age for White alone residents35.4 37.2 28.0 Median age for Hispanic or Latino residents23.3 26.5
Owner/renter occupied households by race in Wentzville
House owners and renters - White residents 11,230 82.3% Owner occupied2,408 17.7% Renter occupiedHouse owners and renters - Black or African American residents 636 74.8% Owner occupied214 25.2% Renter occupiedHouse owners and renters - American Indian / Alaska Native residents 4 100.0% Owner occupiedHouse owners and renters - Asian residents 285 94.9% Owner occupied15 5.1% Renter occupiedHouse owners and renters - Other race residents 53 78.6% Owner occupied14 21.4% Renter occupiedHouse owners and renters - Two or more races residents 536 94.5% Owner occupied31 5.5% Renter occupiedHouse owners and renters - White alone residents 11,086 82.5% Owner occupied2,353 17.5% Renter occupiedHouse owners and renters - Hispanic or Latino residents 264 83.4% Owner occupied52 16.6% Renter occupied
Language usage in Wentzville
English speakers - Total 96.9% of residents of Wentzville speak English at home.
1.8% of residents speak Spanish at home 519 67.0% Speak English very well256 33.0% Speak English less than very well1.3% of residents speak other language at home 371 68.6% Speak English very well170 31.4% Speak English less than very well
English speakers - Born in the United States 96.0% of residents of Wentzville speak English at home.
3.0% of residents speak Spanish at home 208 61.7% Speak English very well129 38.3% Speak English less than very well0.9% of residents speak other language at home 103 100.0% Speak English very well
English speakers - Native, born elsewhere 70.5% of residents of Wentzville speak English at home.
11.0% of residents speak Spanish at home 71 100.0% Speak English very well15.7% of residents speak other language at home 101 100.0% Speak English very well
English speakers - Foreign-born 29.9% of residents of Wentzville speak English at home.
21.3% of residents speak Spanish at home 102 54.5% Speak English very well85 45.5% Speak English less than very well42.7% of residents speak other language at home 214 57.2% Speak English very well160 42.8% Speak English less than very well
White (Caucasian) - Speak only English Native:
99.3% (36,047)Foreign-born:
39.9% (102)
White (Caucasian) - Speak another language Native:
0.8% (277)Foreign-born:
59.4% (152)
Black or African American - Speak only English Native:
97.7% (2,270)Foreign-born:
29.1% (45)
Black or African American - Speak another language Native:
2.2% (52)Foreign-born:
70.9% (110)
Asian - Speak only English Native:
92.0% (477)Foreign-born:
17.7% (61)
Asian - Speak another language Native:
15.7% (82)Foreign-born:
81.9% (283)
Other race - Speak only English Native:
80.4% (112)Foreign-born:
97.8% (23)
Other race - Speak another language Native:
23.6% (33)Foreign-born:
37.4% (9)
Two or more races - Speak only English Native:
86.0% (1,733)Foreign-born:
30.5% (18)
Two or more races - Speak another language Native:
15.4% (311)Foreign-born:
70.3% (41)
White alone - Speak only English Native:
99.9% (35,870)Foreign-born:
61.3% (77)
White alone - Speak another language Native:
0.2% (74)Foreign-born:
25.4% (32)
Hispanic or Latino - Speak only English Native:
44.9% (468)Foreign-born:
13.6% (36)
Hispanic or Latino - Speak another language Native:
55.3% (577)Foreign-born:
76.7% (204)
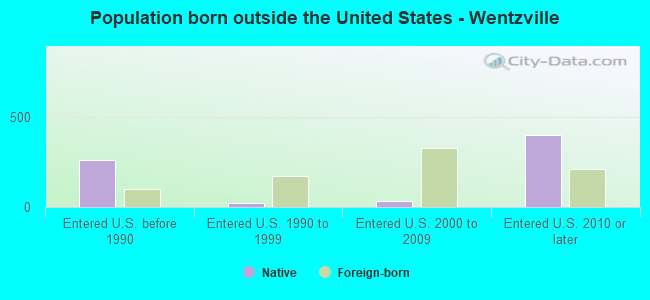
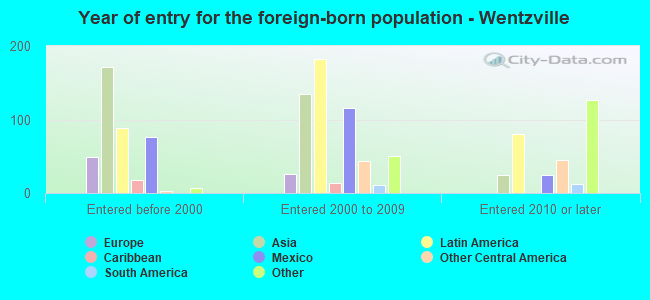
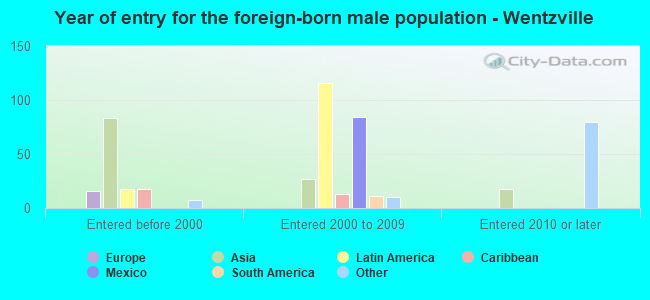
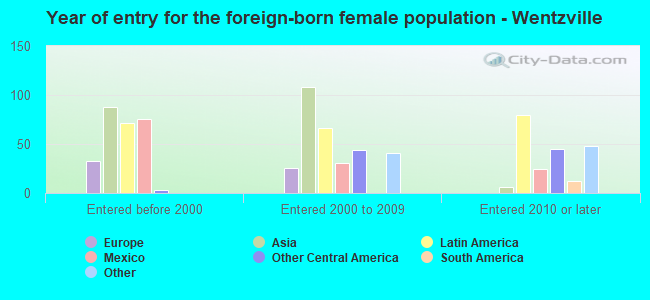
Foreign-born residents in Wentzville 936 residents are foreign born (0.8% Latin America , 0.8% Asia , 0.3% Africa ).
This city:
2.1%Missouri:
4.2%
Marital status for residents in Wentzville Marital status - White (Caucasian) population 15 years and over
Males 26.6% Never married62.9% Now married1.4% Separated1.4% Widowed7.6% DivorcedFemales 22.0% Never married58.1% Now married1.5% Separated6.8% Widowed11.5% DivorcedWomen who gave birth in the past 12 months Now married:
85.2% (406)Unmarried:
14.8% (71)
Women who did not give birth in the past 12 months Now married:
57.1% (5,266)Unmarried:
42.9% (3,963)
Marital status - Black or African American population 15 years and over
Males 60.1% Never married34.3% Now married0.6% Separated0.0% Widowed5.0% DivorcedFemales 22.1% Never married66.4% Now married6.3% Separated2.7% Widowed2.5% DivorcedWomen who gave birth in the past 12 months Now married:
38.9% (14)Unmarried:
61.1% (22)
Women who did not give birth in the past 12 months Now married:
78.5% (472)Unmarried:
21.5% (129)
Marital status - Asian population 15 years and over
Males 24.9% Never married62.8% Now married0.0% Separated0.0% Widowed12.3% DivorcedFemales 39.1% Never married60.9% Now married0.0% Separated0.0% Widowed0.0% DivorcedWomen who did not give birth in the past 12 months Now married:
57.6% (192)Unmarried:
42.4% (141)
Marital status - Other race population 15 years and over
Males 42.3% Never married57.7% Now married0.0% Separated0.0% Widowed0.0% DivorcedFemales 0.0% Never married83.8% Now married0.0% Separated0.0% Widowed16.2% DivorcedWomen who did not give birth in the past 12 months Now married:
83.8% (69)Unmarried:
16.2% (13)
Marital status - Two or more races population 15 years and over
Males 43.3% Never married45.9% Now married0.8% Separated8.2% Widowed1.8% DivorcedFemales 12.6% Never married81.7% Now married0.0% Separated0.0% Widowed5.7% DivorcedWomen who gave birth in the past 12 months Now married:
95.2% (30)Unmarried:
4.8% (2)
Women who did not give birth in the past 12 months Now married:
78.9% (357)Unmarried:
21.1% (95)
Marital status - White alone, not Hispanic / Latino population 15 years and over
Males 26.3% Never married63.1% Now married1.5% Separated1.4% Widowed7.7% DivorcedFemales 21.7% Never married58.2% Now married1.5% Separated6.8% Widowed11.7% DivorcedWomen who gave birth in the past 12 months Now married:
84.5% (385)Unmarried:
15.5% (71)
Women who did not give birth in the past 12 months Now married:
57.1% (5,139)Unmarried:
42.9% (3,866)
Marital status - Hispanic or Latino population 15 years and over
Males 37.0% Never married63.0% Now married0.0% Separated0.0% Widowed0.0% DivorcedFemales 20.3% Never married68.5% Now married0.0% Separated4.0% Widowed7.2% DivorcedWomen who gave birth in the past 12 months Now married:
100.0% (47)Unmarried:
0.0% (0)
Women who did not give birth in the past 12 months Now married:
73.8% (402)Unmarried:
26.2% (143)
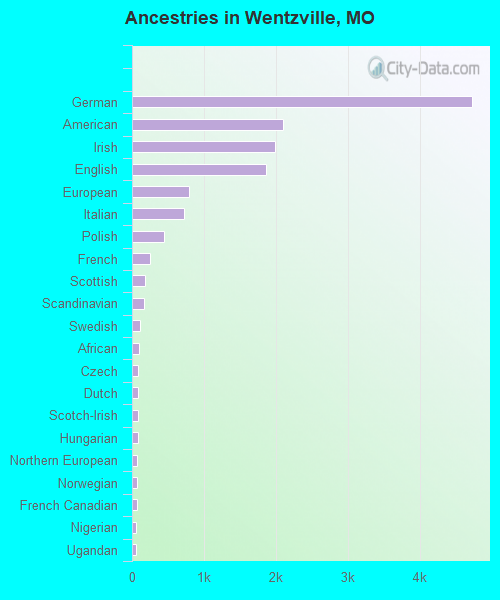
Ancestries in Wentzville
4,724 25.9% German2,104 11.6% American1,985 10.9% Irish1,857 10.2% English786 4.3% European716 3.9% Italian442 2.4% Polish254 1.4% French177 1.0% Scottish172 0.9% Scandinavian105 0.6% Swedish93 0.5% African87 0.5% Czech84 0.5% Dutch81 0.4% Scotch-Irish79 0.4% Hungarian68 0.4% Northern European68 0.4% Norwegian63 0.3% French Canadian55 0.3% Nigerian50 0.3% Ugandan35 0.2% British30 0.2% Lebanese28 0.2% Israeli22 0.1% Austrian22 0.1% Russian20 0.1% Danish18 0.10% Canadian18 0.10% Swiss13 0.07% Czechoslovakian10 0.05% Armenian9 0.05% Serbian8 0.04% Eastern European8 0.04% Portuguese
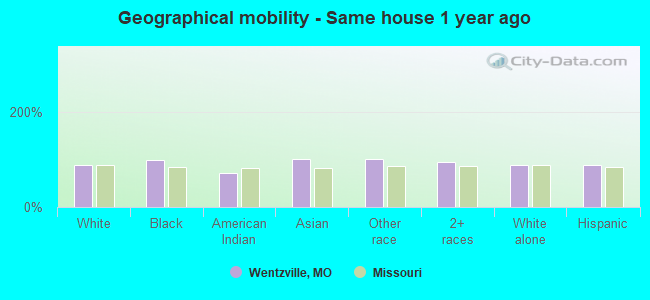
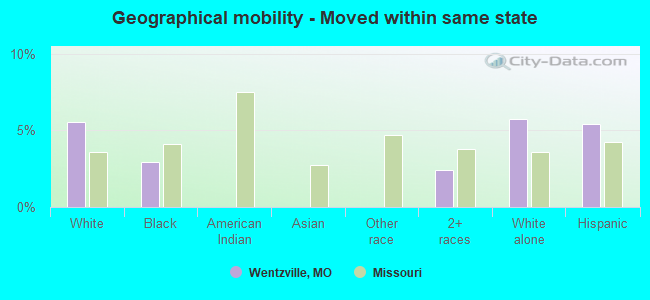
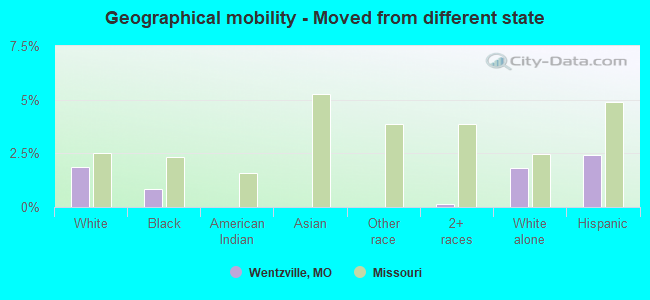
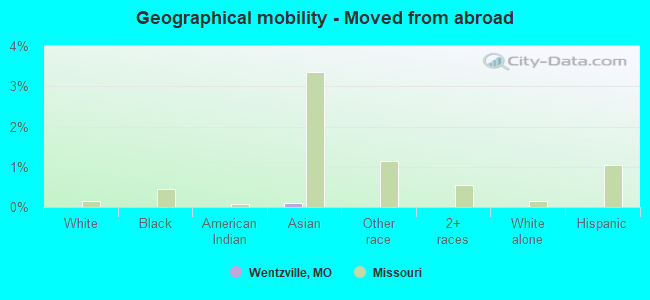
Geographical mobility in Wentzville Same house 1 year ago 33,641 87.8% White (Caucasian)2,424 97.7% Black or African American10 72.5% American Indian / Alaska Native876 100.0% Asian282 100.0% Other race2,433 94.7% Two or more races33,124 87.7% White alone, not Hispanic / Latino1,245 88.8% Hispanic or LatinoMoved within same county 1,809 4.7% White / Caucasian38 1.5% Black or African American4 29.4% American Indian / Alaska Native49 1.9% Two or more races1,802 4.8% White alone, not Hispanic / Latino26 1.9% Hispanic or LatinoMoved within same state 2,134 5.6% White / Caucasian72 2.9% Black or African American63 2.4% Two or more races2,160 5.7% White alone, not Hispanic / Latino75 5.4% Hispanic or LatinoMoved from different state 710 1.9% White / Caucasian20 0.8% Black or African American4 0.2% Two or more races689 1.8% White alone, not Hispanic / Latino34 2.4% Hispanic or LatinoMoved from abroad 1 0.1% Asian
Children Nativity (place of birth) in Wentzville
Children under 6 years - Living with two parents Both parents native 2,922 100.0% NativeBoth parents foreign-born 25 100.0% NativeOne native, one foreign-born parent 210 100.0% NativeChildren under 6 years - Living with one parent Native parent 738 100.0% NativeChildren 6 to 17 years - Living with two parents Both parents native 7,166 100.0% Native3 0.0% Foreign-bornBoth parents foreign-born 84 86.0% Native14 14.0% Foreign-bornOne native, one foreign-born parent 154 78.9% Native41 21.1% Foreign-bornChildren 6 to 17 years - Living with one parent Native parent 2,126 100.0% NativeForeign-born parent 128 53.9% Native110 46.1% Foreign-born
Grandparents responsible for own grandchildren in Wentzville
Grandparents (30 to 59 years) White / Caucasian 72 24.5% Responsible for grandchildren222 75.5% Not responsible for grandchildrenBlack or African American 16 100.0% Not responsible for grandchildrenWhite alone, not Hispanic / Latino 72 33.8% Responsible for grandchildren141 66.2% Not responsible for grandchildrenHispanic or Latino 96 100.0% Not responsible for grandchildrenGrandparents (60 years and over) White / Caucasian 52 16.0% Responsible for grandchildren276 84.0% Not responsible for grandchildrenWhite alone, not Hispanic / Latino 48 14.6% Responsible for grandchildren280 85.4% Not responsible for grandchildren