Races in West Chester, Pennsylvania (PA) Detailed Stats
Data:
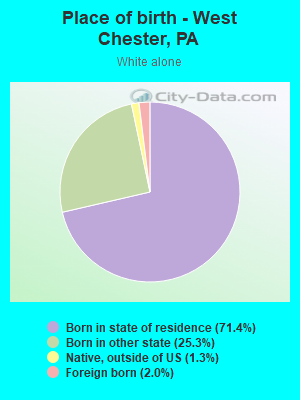
Races - White alone (%)
Races - White alone (% change since 2000)
Races - Black alone (%)
Races - Black alone (% change since 2000)
Races - American Indian alone (%)
Races - American Indian alone (% change since 2000)
Races - Asian alone (%)
Races - Asian alone (% change since 2000)
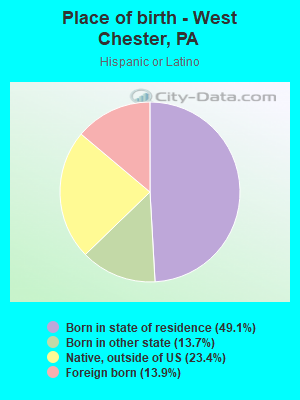
Races - Hispanic (%)
Races - Hispanic (% change since 2000)
Races - Native Hawaiian and Other Pacific Islander alone (%)
Races - Native Hawaiian and Other Pacific Islander alone (% change since 2000)
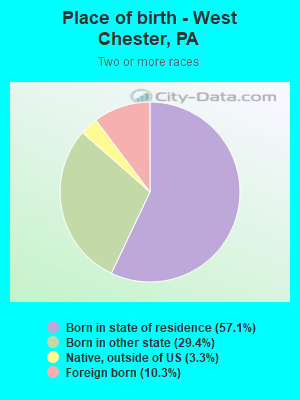
Races - Two or more races(%)
Races - Two or more races(% change since 2000)
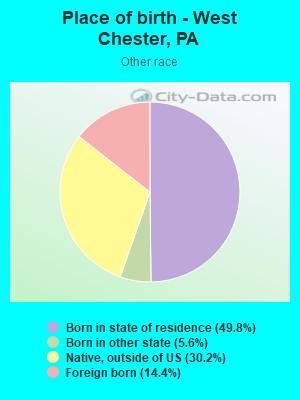
Races - Other race alone (%)
Races - Other race alone (% change since 2000)
Racial diversity
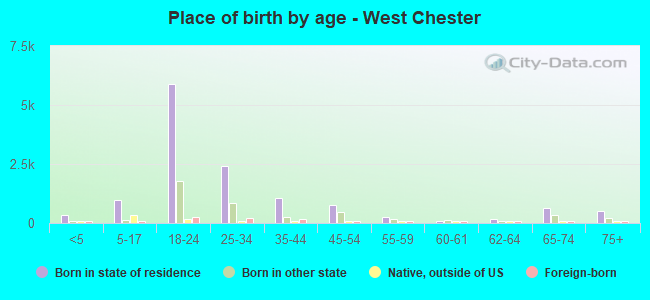
Place of birth - Born in state of residence (%)
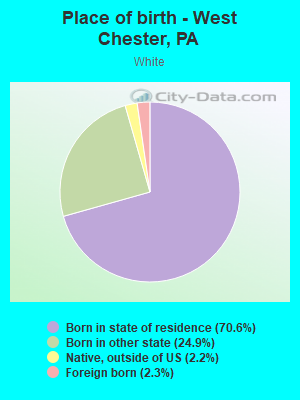
Place of birth - Born in state of residence (%) - White
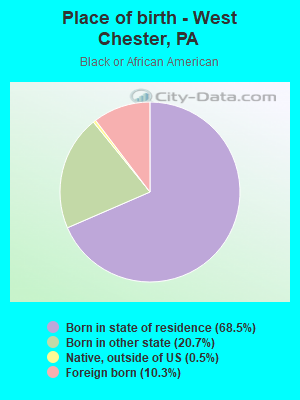
Place of birth - Born in state of residence (%) - Black or African American
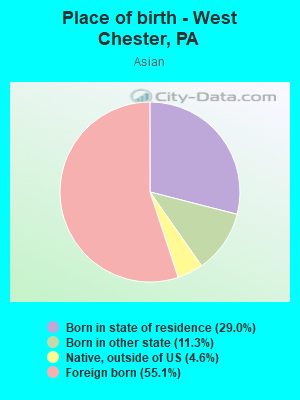
Place of birth - Born in state of residence (%) - Asian
Place of birth - Born in state of residence (%) - Hispanic or Latino
Place of birth - Born in state of residence (%) - American Indian and Alaska Native
Place of birth - Born in state of residence (%) - Multirace
Place of birth - Born in state of residence (%) - Other Race
Place of birth - Born in other state (%)
Place of birth - Born in other state (%) - White
Place of birth - Born in other state (%) - Black or African American
Place of birth - Born in other state (%) - Asian
Place of birth - Born in other state (%) - Hispanic or Latino
Place of birth - Born in other state (%) - American Indian and Alaska Native
Place of birth - Born in other state (%) - Multirace
Place of birth - Born in other state (%) - Other Race
Place of birth - Native, outside of US (%)
Place of birth - Native, outside of US (%) - White
Place of birth - Native, outside of US (%) - Black or African American
Place of birth - Native, outside of US (%) - Asian
Place of birth - Native, outside of US (%) - Hispanic or Latino
Place of birth - Native, outside of US (%) - American Indian and Alaska Native
Place of birth - Native, outside of US (%) - Multirace
Place of birth - Native, outside of US (%) - Other Race
Place of birth - Foreign born (%)
Place of birth - Foreign born (%) - White
Place of birth - Foreign born (%) - Black or African American
Place of birth - Foreign born (%) - Asian
Place of birth - Foreign born (%) - Hispanic or Latino
Place of birth - Foreign born (%) - American Indian and Alaska Native
Place of birth - Foreign born (%) - Multirace
Place of birth - Foreign born (%) - Other Race
Residents speaking English at home (%)
Residents speaking English at home - Born in the United States (%)
Residents speaking English at home - Native, born elsewhere (%)
Residents speaking English at home - Foreign born (%)
Residents speaking Spanish at home (%)
Residents speaking Spanish at home - Born in the United States (%)
Residents speaking Spanish at home - Native, born elsewhere (%)
Residents speaking Spanish at home - Foreign born (%)
Residents speaking other language at home (%)
Residents speaking other language at home - Born in the United States (%)
Residents speaking other language at home - Native, born elsewhere (%)
Residents speaking other language at home - Foreign born (%)
Marital status - Never married (%)
Marital status - Now married (%)
Marital status - Separated (%)
Marital status - Widowed (%)
Marital status - Divorced (%)
Ancestries Reported - Arab (%)
Ancestries Reported - Czech (%)
Ancestries Reported - Danish (%)
Ancestries Reported - Dutch (%)
Ancestries Reported - English (%)
Ancestries Reported - French (%)
Ancestries Reported - French Canadian (%)
Ancestries Reported - German (%)
Ancestries Reported - Greek (%)
Ancestries Reported - Hungarian (%)
Ancestries Reported - Irish (%)
Ancestries Reported - Italian (%)
Ancestries Reported - Lithuanian (%)
Ancestries Reported - Norwegian (%)
Ancestries Reported - Polish (%)
Ancestries Reported - Portuguese (%)
Ancestries Reported - Russian (%)
Ancestries Reported - Scotch-Irish (%)
Ancestries Reported - Scottish (%)
Ancestries Reported - Slovak (%)
Ancestries Reported - Subsaharan African (%)
Ancestries Reported - Swedish (%)
Ancestries Reported - Swiss (%)
Ancestries Reported - Ukrainian (%)
Ancestries Reported - United States (%)
Ancestries Reported - Welsh (%)
Ancestries Reported - West Indian (%)
Ancestries Reported - Other (%)
Geographical mobility - Same house 1 year ago (%)
Geographical mobility - Same house 1 year ago (%) - White
Geographical mobility - Same house 1 year ago (%) - Black or African American
Geographical mobility - Same house 1 year ago (%) - Asian
Geographical mobility - Same house 1 year ago (%) - Hispanic or Latino
Geographical mobility - Same house 1 year ago (%) - American Indian and Alaska Native
Geographical mobility - Same house 1 year ago (%) - Multirace
Geographical mobility - Same house 1 year ago (%) - Other Race
Geographical mobility - Moved within same county (%)
Geographical mobility - Moved within same county (%) - White
Geographical mobility - Moved within same county (%) - Black or African American
Geographical mobility - Moved within same county (%) - Asian
Geographical mobility - Moved within same county (%) - Hispanic or Latino
Geographical mobility - Moved within same county (%) - American Indian and Alaska Native
Geographical mobility - Moved within same county (%) - Multirace
Geographical mobility - Moved within same county (%) - Other Race
Geographical mobility - Moved from different county within same state (%)
Geographical mobility - Moved from different county within same state (%) - White
Geographical mobility - Moved from different county within same state (%) - Black or African American
Geographical mobility - Moved from different county within same state (%) - Asian
Geographical mobility - Moved from different county within same state (%) - Hispanic or Latino
Geographical mobility - Moved from different county within same state (%) - American Indian and Alaska Native
Geographical mobility - Moved from different county within same state (%) - Multirace
Geographical mobility - Moved from different county within same state (%) - Other Race
Geographical mobility - Moved from different state (%)
Geographical mobility - Moved from different state (%) - White
Geographical mobility - Moved from different state (%) - Black or African American
Geographical mobility - Moved from different state (%) - Asian
Geographical mobility - Moved from different state (%) - Hispanic or Latino
Geographical mobility - Moved from different state (%) - American Indian and Alaska Native
Geographical mobility - Moved from different state (%) - Multirace
Geographical mobility - Moved from different state (%) - Other Race
Geographical mobility - Moved from abroad (%)
Geographical mobility - Moved from abroad (%) - White
Geographical mobility - Moved from abroad (%) - Black or African American
Geographical mobility - Moved from abroad (%) - Asian
Geographical mobility - Moved from abroad (%) - Hispanic or Latino
Geographical mobility - Moved from abroad (%) - American Indian and Alaska Native
Geographical mobility - Moved from abroad (%) - Multirace
Geographical mobility - Moved from abroad (%) - Other Race
Place of birth for the foreign-born population - Ireland (%)
Place of birth for the foreign-born population - Denmark (%)
Place of birth for the foreign-born population - Norway (%)
Place of birth for the foreign-born population - Sweden (%)
Place of birth for the foreign-born population - United Kingdom (%)
Place of birth for the foreign-born population - England (%)
Place of birth for the foreign-born population - Scotland (%)
Place of birth for the foreign-born population - Other Northern Europe (%)
Place of birth for the foreign-born population - Austria (%)
Place of birth for the foreign-born population - Belgium (%)
Place of birth for the foreign-born population - France (%)
Place of birth for the foreign-born population - Germany (%)
Place of birth for the foreign-born population - Netherlands (%)
Place of birth for the foreign-born population - Switzerland (%)
Place of birth for the foreign-born population - Other Western Europe (%)
Place of birth for the foreign-born population - Greece (%)
Place of birth for the foreign-born population - Italy (%)
Place of birth for the foreign-born population - Portugal (%)
Place of birth for the foreign-born population - Spain (%)
Place of birth for the foreign-born population - Other Southern Europe (%)
Place of birth for the foreign-born population - Albania (%)
Place of birth for the foreign-born population - Belarus (%)
Place of birth for the foreign-born population - Bosnia and Herzegovina (%)
Place of birth for the foreign-born population - Bulgaria (%)
Place of birth for the foreign-born population - Croatia (%)
Place of birth for the foreign-born population - Czechoslovakia (%)
Place of birth for the foreign-born population - Hungary (%)
Place of birth for the foreign-born population - Latvia (%)
Place of birth for the foreign-born population - Lithuania (%)
Place of birth for the foreign-born population - North Macedonia (Macedonia) (%)
Place of birth for the foreign-born population - Moldova (%)
Place of birth for the foreign-born population - Poland (%)
Place of birth for the foreign-born population - Romania (%)
Place of birth for the foreign-born population - Russia (%)
Place of birth for the foreign-born population - Serbia (%)
Place of birth for the foreign-born population - Ukraine (%)
Place of birth for the foreign-born population - Other Eastern Europe (%)
Place of birth for the foreign-born population - China (%)
Place of birth for the foreign-born population - Hong Kong (%)
Place of birth for the foreign-born population - Taiwan (%)
Place of birth for the foreign-born population - Japan (%)
Place of birth for the foreign-born population - Korea (%)
Place of birth for the foreign-born population - Other Eastern Asia (%)
Place of birth for the foreign-born population - Afghanistan (%)
Place of birth for the foreign-born population - Bangladesh (%)
Place of birth for the foreign-born population - India (%)
Place of birth for the foreign-born population - Iran (%)
Place of birth for the foreign-born population - Kazakhstan (%)
Place of birth for the foreign-born population - Nepal (%)
Place of birth for the foreign-born population - Pakistan (%)
Place of birth for the foreign-born population - Sri Lanka (%)
Place of birth for the foreign-born population - Uzbekistan (%)
Place of birth for the foreign-born population - Other South Central Asia (%)
Place of birth for the foreign-born population - Burma (%)
Place of birth for the foreign-born population - Cambodia (%)
Place of birth for the foreign-born population - Indonesia (%)
Place of birth for the foreign-born population - Laos (%)
Place of birth for the foreign-born population - Malaysia (%)
Place of birth for the foreign-born population - Philippines (%)
Place of birth for the foreign-born population - Singapore (%)
Place of birth for the foreign-born population - Thailand (%)
Place of birth for the foreign-born population - Vietnam (%)
Place of birth for the foreign-born population - Other South Eastern Asia (%)
Place of birth for the foreign-born population - Armenia (%)
Place of birth for the foreign-born population - Iraq (%)
Place of birth for the foreign-born population - Israel (%)
Place of birth for the foreign-born population - Jordan (%)
Place of birth for the foreign-born population - Kuwait (%)
Place of birth for the foreign-born population - Lebanon (%)
Place of birth for the foreign-born population - Saudi Arabia (%)
Place of birth for the foreign-born population - Syria (%)
Place of birth for the foreign-born population - Turkey (%)
Place of birth for the foreign-born population - Yemen (%)
Place of birth for the foreign-born population - Other Western Asia (%)
Place of birth for the foreign-born population - Eritrea (%)
Place of birth for the foreign-born population - Ethiopia (%)
Place of birth for the foreign-born population - Kenya (%)
Place of birth for the foreign-born population - Somalia (%)
Place of birth for the foreign-born population - Uganda (%)
Place of birth for the foreign-born population - Zimbabwe (%)
Place of birth for the foreign-born population - Other Eastern Africa (%)
Place of birth for the foreign-born population - Cameroon (%)
Place of birth for the foreign-born population - Congo (%)
Place of birth for the foreign-born population - Democratic Republic of Congo (Zaire) (%)
Place of birth for the foreign-born population - Other Middle Africa (%)
Place of birth for the foreign-born population - Egypt (%)
Place of birth for the foreign-born population - Morocco (%)
Place of birth for the foreign-born population - Sudan (%)
Place of birth for the foreign-born population - Other Northern Africa (%)
Place of birth for the foreign-born population - South Africa (%)
Place of birth for the foreign-born population - Other Southern Africa (%)
Place of birth for the foreign-born population - Cabo Verde (%)
Place of birth for the foreign-born population - Ghana (%)
Place of birth for the foreign-born population - Liberia (%)
Place of birth for the foreign-born population - Nigeria (%)
Place of birth for the foreign-born population - Senegal (%)
Place of birth for the foreign-born population - Sierra Leone (%)
Place of birth for the foreign-born population - Other Western Africa (%)
Place of birth for the foreign-born population - Australia (%)
Place of birth for the foreign-born population - New Zealand (%)
Place of birth for the foreign-born population - Fiji (%)
Place of birth for the foreign-born population - Micronesia (%)
Place of birth for the foreign-born population - Bahamas (%)
Place of birth for the foreign-born population - Barbados (%)
Place of birth for the foreign-born population - Cuba (%)
Place of birth for the foreign-born population - Dominica (%)
Place of birth for the foreign-born population - Dominican Republic (%)
Place of birth for the foreign-born population - Grenada (%)
Place of birth for the foreign-born population - Haiti (%)
Place of birth for the foreign-born population - Jamaica (%)
Place of birth for the foreign-born population - St. Vincent and the Grenadines (%)
Place of birth for the foreign-born population - Trinidad and Tobago (%)
Place of birth for the foreign-born population - West Indies (%)
Place of birth for the foreign-born population - Other Caribbean (%)
Place of birth for the foreign-born population - Belize (%)
Place of birth for the foreign-born population - Costa Rica (%)
Place of birth for the foreign-born population - El Salvador (%)
Place of birth for the foreign-born population - Guatemala (%)
Place of birth for the foreign-born population - Honduras (%)
Place of birth for the foreign-born population - Mexico (%)
Place of birth for the foreign-born population - Nicaragua (%)
Place of birth for the foreign-born population - Panama (%)
Place of birth for the foreign-born population - Other Central America (%)
Place of birth for the foreign-born population - Argentina (%)
Place of birth for the foreign-born population - Bolivia (%)
Place of birth for the foreign-born population - Brazil (%)
Place of birth for the foreign-born population - Chile (%)
Place of birth for the foreign-born population - Colombia (%)
Place of birth for the foreign-born population - Ecuador (%)
Place of birth for the foreign-born population - Guyana (%)
Place of birth for the foreign-born population - Peru (%)
Place of birth for the foreign-born population - Uruguay (%)
Place of birth for the foreign-born population - Venezuela (%)
Place of birth for the foreign-born population - Other South America (%)
Place of birth for the foreign-born population - Canada (%)
Place of birth for the foreign-born population - Other Northern America (%)
Place of birth for the foreign-born population - Other (%)
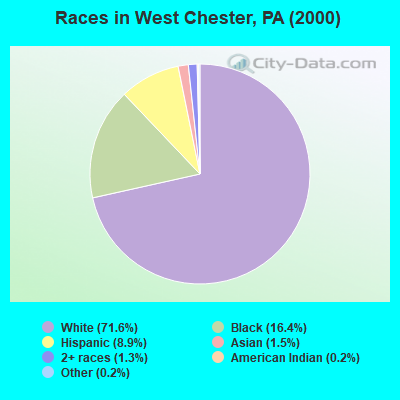
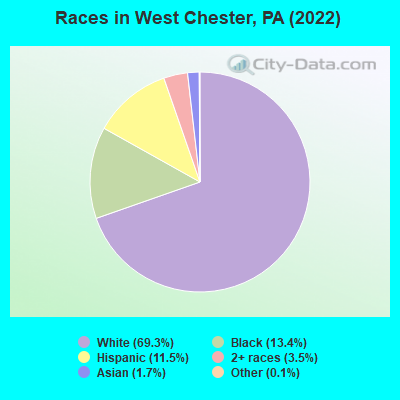
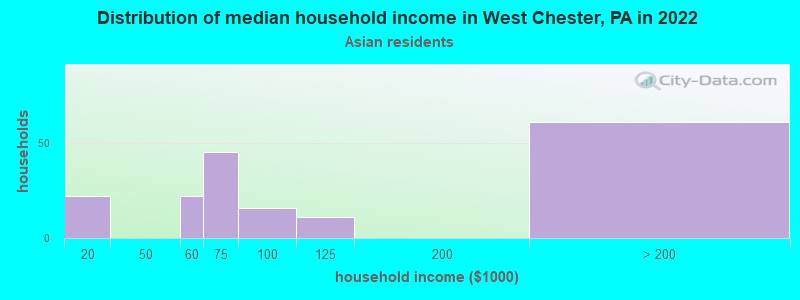
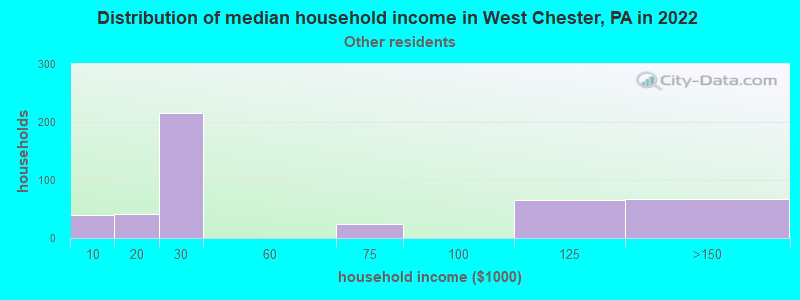
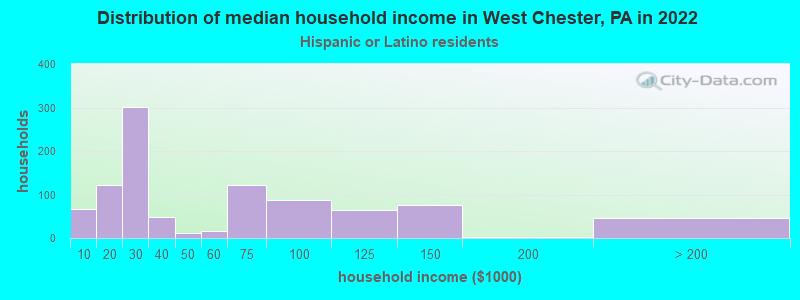
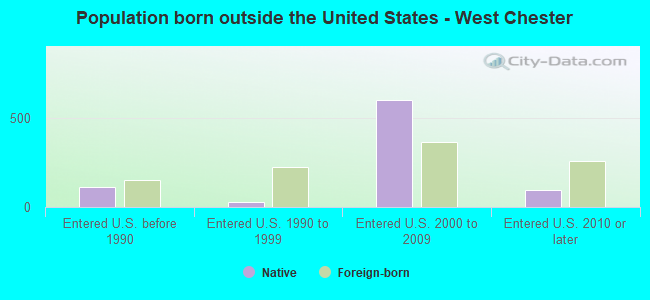
According to 2022 data, the most numerous races in West Chester, PA are White alone (13,415 residents), Black alone (2,591 residents), and Hispanic (2,224 residents). 88.5% of West Chester residents speak English at home. 5.2% of West Chester, PA residents are foreign-born (1.9% born in Latin America, 1.3% born in Asia, 0.8% born in Europe), which is 34.4% less than the foreign-born rate of 7.0% across the entire state of Pennsylvania.
Race distribution in West Chester
2000 2022
10,322,455 84.1% White alone 1,202,437 9.8% Black alone 394,088 3.2% Hispanic 218,296 1.8% Asian alone 113,097 0.9% Two or more races 13,086 0.1% Other race alone 14,904 0.1% American Indian alone 2,691 0.02% Native Hawaiian and Other
9,487,228 73.1% White alone 1,311,581 10.1% Black alone 1,115,997 8.6% Hispanic 493,942 3.8% Two or more races 487,124 3.8% Asian alone 63,582 0.5% Other race alone 10,130 0.08% American Indian alone 2,424 0.02% Native Hawaiian and Other
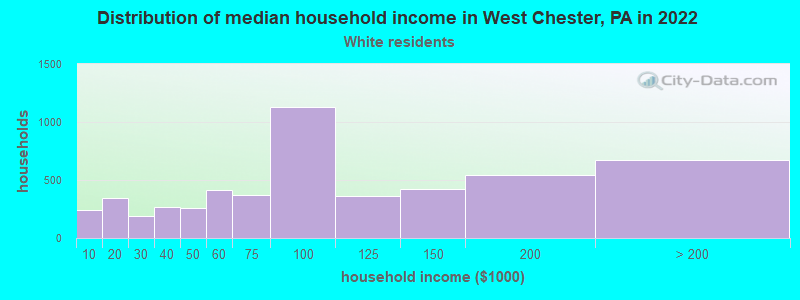
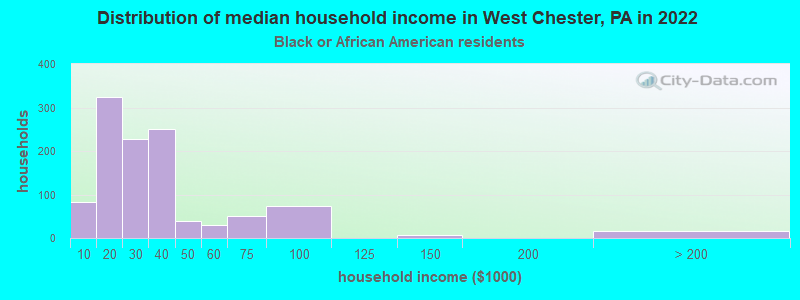
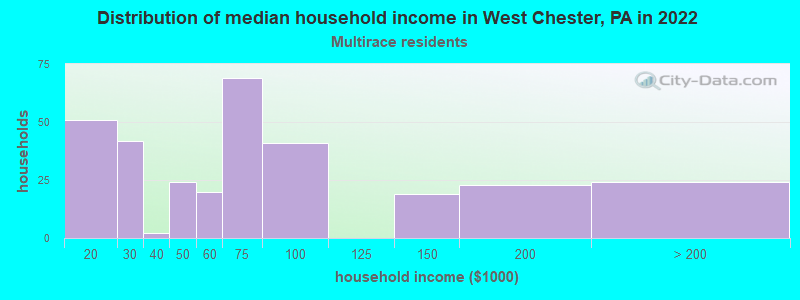
Income and house value in West Chester Median household income in 2022 $88,106 White non-Hispanic householders$32,259 Black householders$57,304 Two or more races householdersMedian 2022 house value $519,411 White Non-Hispanic householders$307,189 Black or African American householders $205,707 Asian householders$385,701 Some other race householders$291,418 Two or more races householders$357,245 Hispanic or Latino householders
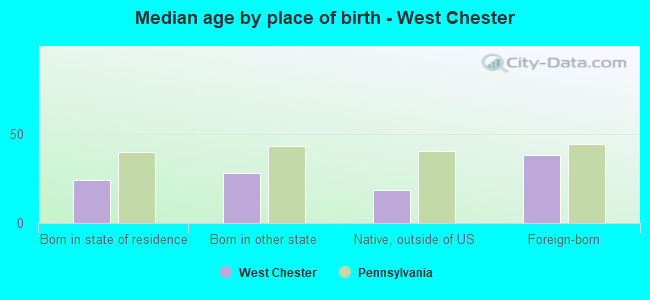
Median age by race in West Chester
24.9 Median age for White residents25.8 23.8 23.9 Median age for Black or African American residents22.5 29.8 -591,549,295.2 Median age for American Indian / Alaska Native residents-596,491,227.5 -593,055,555.0 27.1 Median age for Asian residents33.6 26.4 -596,045,197.1 Median age for Native Hawaiian / Pacific Islander residents-665,394,401.4 -747,474,746.7 32.6 Median age for Other race residents34.8 32.8 25.4 Median age for Two or more races residents23.2 26.3 24.8 Median age for White alone residents25.9 23.7 30.3 Median age for Hispanic or Latino residents25.1 31.2
Owner/renter occupied households by race in West Chester
House owners and renters - White residents 1,948 38.8% Owner occupied3,077 61.2% Renter occupiedHouse owners and renters - Black or African American residents 230 25.1% Owner occupied685 74.9% Renter occupiedHouse owners and renters - Asian residents 89 56.1% Owner occupied70 43.9% Renter occupiedHouse owners and renters - Other race residents 116 37.4% Owner occupied194 62.6% Renter occupiedHouse owners and renters - Two or more races residents 65 16.6% Owner occupied329 83.4% Renter occupiedHouse owners and renters - White alone residents 1,904 39.7% Owner occupied2,890 60.3% Renter occupiedHouse owners and renters - Hispanic or Latino residents 199 26.3% Owner occupied558 73.7% Renter occupied
Language usage in West Chester
English speakers - Total 88.5% of residents of West Chester speak English at home.
7.8% of residents speak Spanish at home 1,009 67.6% Speak English very well483 32.4% Speak English less than very well2.7% of residents speak other language at home 352 69.7% Speak English very well153 30.3% Speak English less than very well
English speakers - Born in the United States 92.0% of residents of West Chester speak English at home.
5.9% of residents speak Spanish at home 263 100.0% Speak English very well2.8% of residents speak other language at home 104 83.9% Speak English very well20 16.1% Speak English less than very well
English speakers - Native, born elsewhere 18.0% of residents of West Chester speak English at home.
49.1% of residents speak Spanish at home 235 64.0% Speak English very well132 36.0% Speak English less than very well5.5% of residents speak other language at home 23 56.1% Speak English very well18 43.9% Speak English less than very well
English speakers - Foreign-born 53.9% of residents of West Chester speak English at home.
26.2% of residents speak Spanish at home 149 55.6% Speak English very well119 44.4% Speak English less than very well21.4% of residents speak other language at home 123 56.2% Speak English very well96 43.8% Speak English less than very well
White (Caucasian) - Speak only English Native:
95.2% (12,791)Foreign-born:
73.4% (238)
White (Caucasian) - Speak another language Native:
4.9% (653)Foreign-born:
32.3% (105)
Black or African American - Speak only English Native:
91.4% (2,323)Foreign-born:
48.0% (135)
Black or African American - Speak another language Native:
12.3% (313)Foreign-born:
52.7% (148)
Asian - Speak only English Native:
77.7% (135)Foreign-born:
57.7% (127)
Asian - Speak another language Native:
18.4% (32)Foreign-born:
52.8% (116)
Other race - Speak only English Native:
15.7% (122)Foreign-born:
14.0% (20)
Other race - Speak another language Native:
79.5% (622)Foreign-born:
86.3% (122)
Two or more races - Speak only English Native:
88.1% (798)Foreign-born:
36.1% (40)
Two or more races - Speak another language Native:
11.3% (102)Foreign-born:
42.9% (48)
White alone - Speak only English Native:
97.4% (12,509)Foreign-born:
77.3% (203)
White alone - Speak another language Native:
2.3% (300)Foreign-born:
13.1% (34)
Hispanic or Latino - Speak only English Native:
40.3% (779)Foreign-born:
22.4% (71)
Hispanic or Latino - Speak another language Native:
56.2% (1,086)Foreign-born:
82.3% (262)
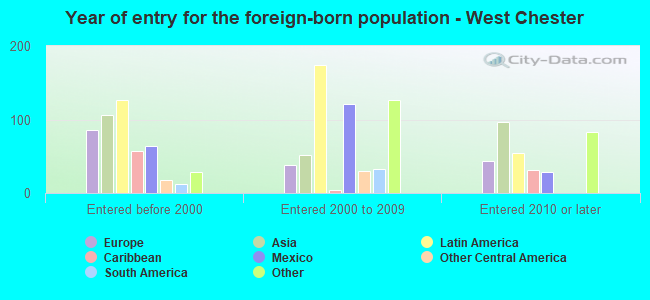
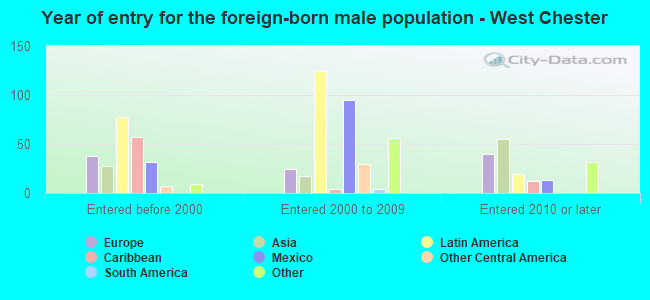
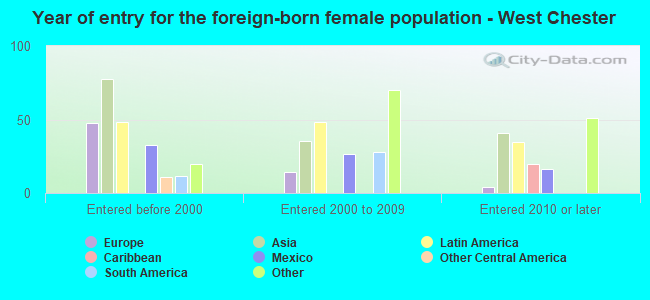
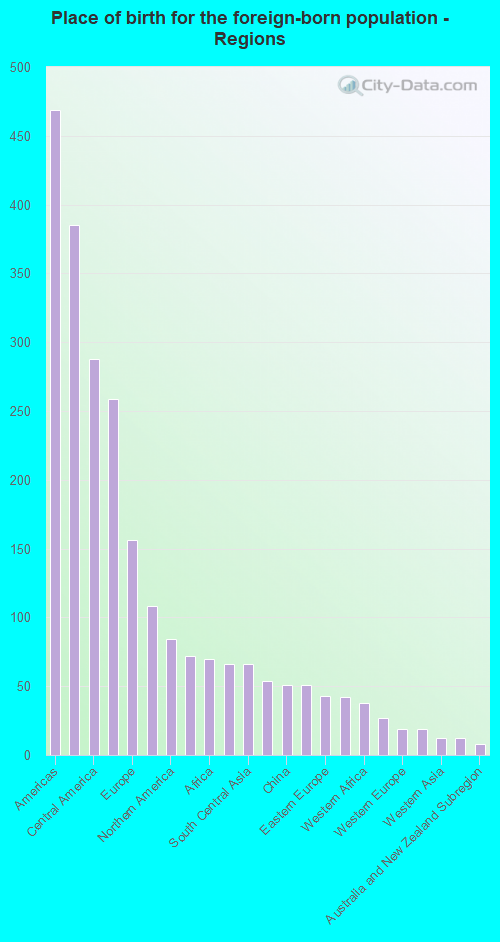
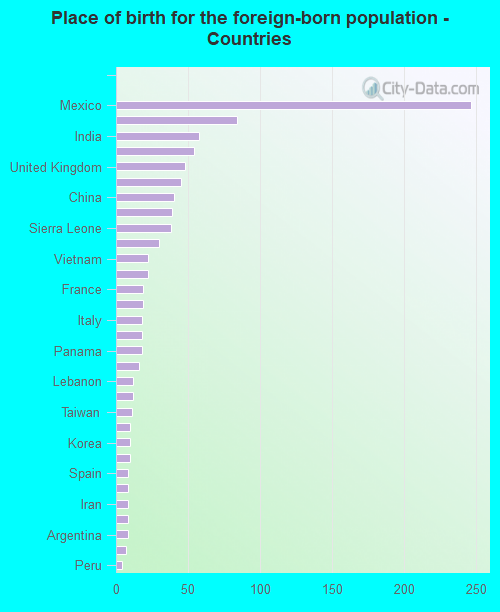
Foreign-born residents in West Chester 1,008 residents are foreign born (1.9% Latin America , 1.3% Asia , 0.8% Europe ).
This city:
5.2%Pennsylvania:
7.3%
Marital status for residents in West Chester Marital status - White (Caucasian) population 15 years and over
Males 72.8% Never married20.4% Now married1.0% Separated1.5% Widowed4.4% DivorcedFemales 68.2% Never married19.1% Now married0.2% Separated5.2% Widowed7.2% DivorcedWomen who gave birth in the past 12 months Now married:
73.2% (30)Unmarried:
26.8% (11)
Women who did not give birth in the past 12 months Now married:
12.5% (707)Unmarried:
87.5% (4,966)
Marital status - Black or African American population 15 years and over
Males 79.8% Never married15.7% Now married0.6% Separated0.0% Widowed4.0% DivorcedFemales 68.9% Never married3.7% Now married3.2% Separated4.0% Widowed20.2% DivorcedWomen who gave birth in the past 12 months Now married:
0.0% (0)Unmarried:
92.5% (1)
Women who did not give birth in the past 12 months Now married:
6.2% (58)Unmarried:
93.8% (887)
Marital status - Asian population 15 years and over
Males 57.6% Never married42.4% Now married0.0% Separated0.0% Widowed0.0% DivorcedFemales 85.0% Never married15.0% Now married0.0% Separated0.0% Widowed0.0% DivorcedWomen who did not give birth in the past 12 months Now married:
18.1% (33)Unmarried:
81.9% (150)
Marital status - Other race population 15 years and over
Males 50.3% Never married20.7% Now married8.7% Separated5.9% Widowed14.5% DivorcedFemales 44.1% Never married7.4% Now married0.0% Separated7.2% Widowed41.4% DivorcedWomen who did not give birth in the past 12 months Now married:
0.0% (0)Unmarried:
100.0% (493)
Marital status - Two or more races population 15 years and over
Males 72.6% Never married22.6% Now married4.8% Separated0.0% Widowed0.0% DivorcedFemales 60.4% Never married29.5% Now married0.0% Separated0.0% Widowed10.1% DivorcedWomen who did not give birth in the past 12 months Now married:
34.1% (182)Unmarried:
65.9% (351)
Marital status - White alone, not Hispanic / Latino population 15 years and over
Males 72.9% Never married21.2% Now married1.1% Separated0.5% Widowed4.3% DivorcedFemales 69.4% Never married18.9% Now married0.3% Separated5.1% Widowed6.3% DivorcedWomen who gave birth in the past 12 months Now married:
75.0% (30)Unmarried:
25.0% (10)
Women who did not give birth in the past 12 months Now married:
12.3% (660)Unmarried:
87.7% (4,711)
Marital status - Hispanic or Latino population 15 years and over
Males 64.1% Never married13.6% Now married4.8% Separated9.4% Widowed8.2% DivorcedFemales 49.3% Never married15.8% Now married0.0% Separated5.4% Widowed29.6% DivorcedWomen who gave birth in the past 12 months Now married:
0.0% (0)Unmarried:
100.0% (2)
Women who did not give birth in the past 12 months Now married:
10.6% (99)Unmarried:
89.4% (839)
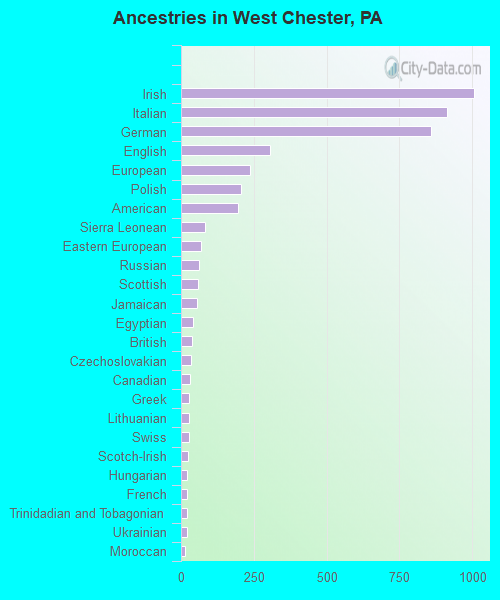
Ancestries in West Chester
1,007 12.2% Irish912 11.0% Italian857 10.3% German306 3.7% English237 2.9% European206 2.5% Polish194 2.3% American82 1.0% Sierra Leonean67 0.8% Eastern European61 0.7% Russian57 0.7% Scottish55 0.7% Jamaican41 0.5% Egyptian37 0.4% British34 0.4% Czechoslovakian32 0.4% Canadian29 0.4% Greek29 0.4% Lithuanian28 0.3% Swiss24 0.3% Scotch-Irish22 0.3% Hungarian21 0.3% French21 0.3% Trinidadian and Tobagonian19 0.2% Ukrainian15 0.2% Moroccan15 0.2% Slovak14 0.2% Armenian14 0.2% Ethiopian14 0.2% South African13 0.2% French Canadian13 0.2% Kenyan11 0.1% Brazilian8 0.10% Norwegian8 0.10% Barbadian7 0.08% Pennsylvania German7 0.08% Romanian7 0.08% Slovene4 0.05% Croatian
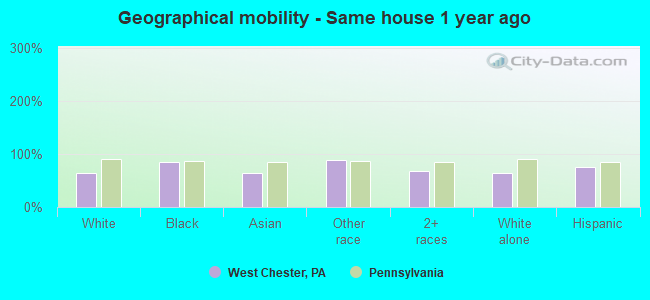
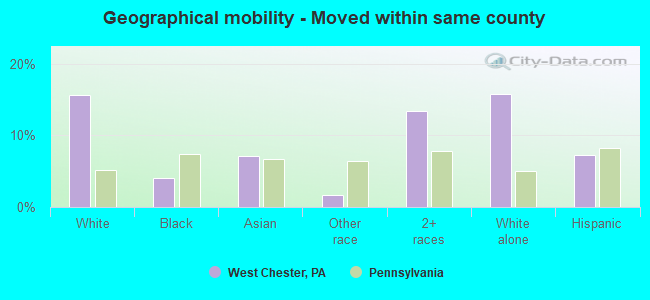
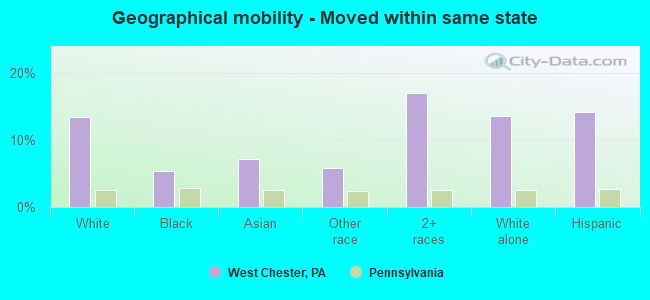
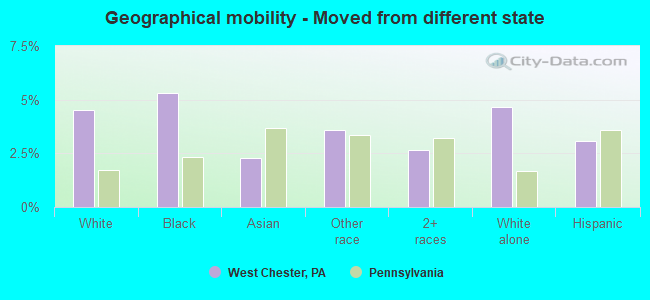
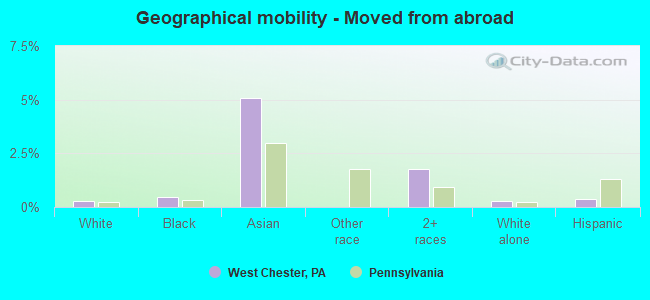
Geographical mobility in West Chester Same house 1 year ago 9,062 64.9% White (Caucasian)2,333 84.8% Black or African American250 64.8% Asian956 89.3% Other race751 68.8% Two or more races8,662 64.8% White alone, not Hispanic / Latino1,701 75.7% Hispanic or LatinoMoved within same county 2,180 15.6% White / Caucasian112 4.1% Black or African American27 7.1% Asian19 1.7% Other race147 13.5% Two or more races2,110 15.8% White alone, not Hispanic / Latino165 7.3% Hispanic or LatinoMoved within same state 1,882 13.5% White / Caucasian147 5.4% Black or African American28 7.1% Asian62 5.8% Other race185 16.9% Two or more races1,817 13.6% White alone, not Hispanic / Latino318 14.2% Hispanic or LatinoMoved from different state 628 4.5% White / Caucasian147 5.3% Black or African American9 2.3% Asian38 3.6% Other race29 2.6% Two or more races625 4.7% White alone, not Hispanic / Latino69 3.1% Hispanic or LatinoMoved from abroad 37 0.3% White13 0.5% Black or African American20 5.1% Asian19 1.8% Two or more races39 0.3% White alone, not Hispanic / Latino9 0.4% Hispanic or Latino
Children Nativity (place of birth) in West Chester
Children under 6 years - Living with two parents Both parents native 354 100.0% NativeBoth parents foreign-born 10 100.0% NativeChildren under 6 years - Living with one parent Native parent 53 100.0% NativeForeign-born parent 1 100.0% NativeChildren 6 to 17 years - Living with two parents Both parents native 393 100.0% NativeBoth parents foreign-born 81 100.0% NativeOne native, one foreign-born parent 30 100.0% NativeChildren 6 to 17 years - Living with one parent Native parent 740 100.0% NativeForeign-born parent 17 47.6% Native19 52.4% Foreign-born
Grandparents responsible for own grandchildren in West Chester
Grandparents (30 to 59 years) White / Caucasian 5 100.0% Not responsible for grandchildrenBlack or African American 84 100.0% Responsible for grandchildrenWhite alone, not Hispanic / Latino 7 100.0% Not responsible for grandchildren
Grandparents (60 years and over) White / Caucasian 16 100.0% Responsible for grandchildrenBlack or African American 47 100.0% Not responsible for grandchildrenWhite alone, not Hispanic / Latino 16 100.0% Responsible for grandchildren