Races in West Des Moines, Iowa (IA) Detailed Stats
Data:
Races - White alone (%)
Races - White alone (% change since 2000)
Races - Black alone (%)
Races - Black alone (% change since 2000)
Races - American Indian alone (%)
Races - American Indian alone (% change since 2000)
Races - Asian alone (%)
Races - Asian alone (% change since 2000)
Races - Hispanic (%)
Races - Hispanic (% change since 2000)
Races - Native Hawaiian and Other Pacific Islander alone (%)
Races - Native Hawaiian and Other Pacific Islander alone (% change since 2000)
Races - Two or more races(%)
Races - Two or more races(% change since 2000)
Races - Other race alone (%)
Races - Other race alone (% change since 2000)
Racial diversity
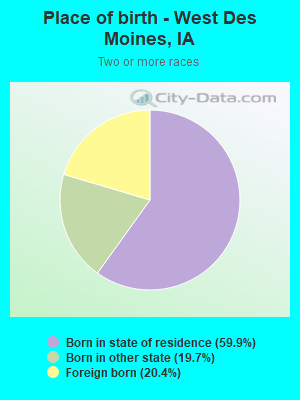
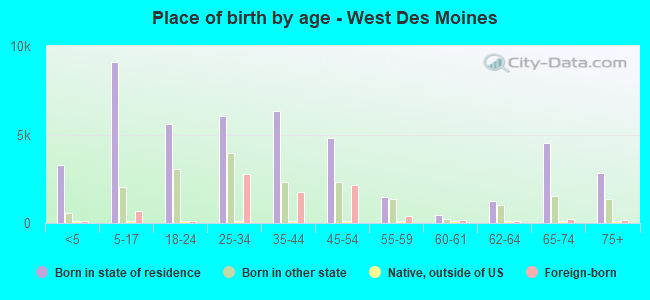
Place of birth - Born in state of residence (%)
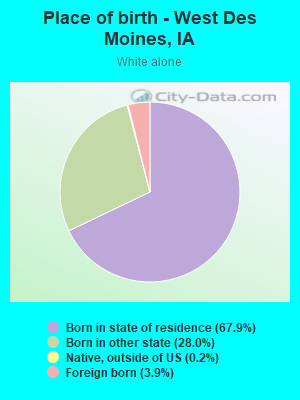
Place of birth - Born in state of residence (%) - White
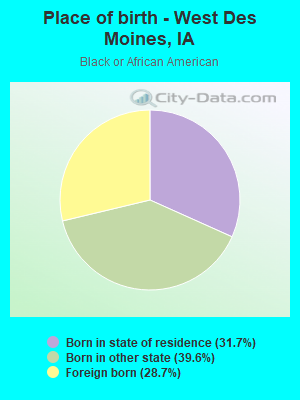
Place of birth - Born in state of residence (%) - Black or African American
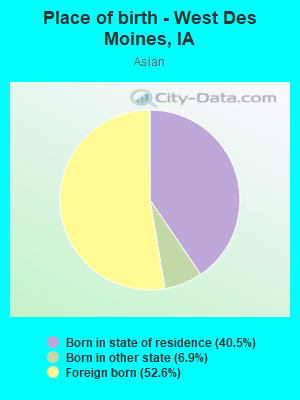
Place of birth - Born in state of residence (%) - Asian
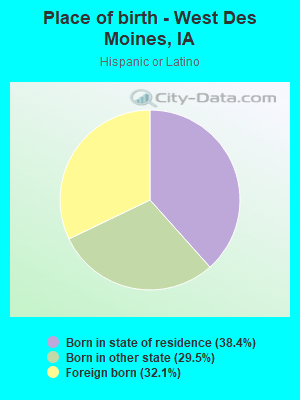
Place of birth - Born in state of residence (%) - Hispanic or Latino
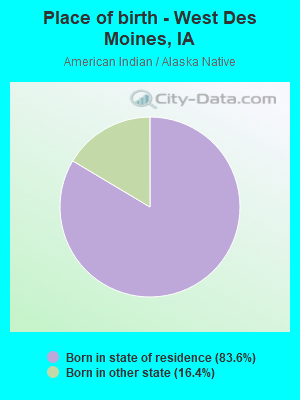
Place of birth - Born in state of residence (%) - American Indian and Alaska Native
Place of birth - Born in state of residence (%) - Multirace
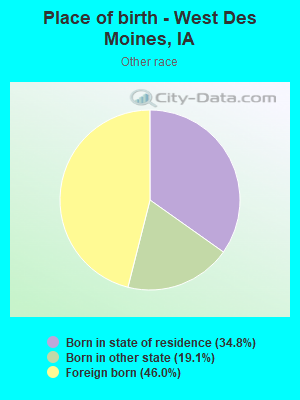
Place of birth - Born in state of residence (%) - Other Race
Place of birth - Born in other state (%)
Place of birth - Born in other state (%) - White
Place of birth - Born in other state (%) - Black or African American
Place of birth - Born in other state (%) - Asian
Place of birth - Born in other state (%) - Hispanic or Latino
Place of birth - Born in other state (%) - American Indian and Alaska Native
Place of birth - Born in other state (%) - Multirace
Place of birth - Born in other state (%) - Other Race
Place of birth - Native, outside of US (%)
Place of birth - Native, outside of US (%) - White
Place of birth - Native, outside of US (%) - Black or African American
Place of birth - Native, outside of US (%) - Asian
Place of birth - Native, outside of US (%) - Hispanic or Latino
Place of birth - Native, outside of US (%) - American Indian and Alaska Native
Place of birth - Native, outside of US (%) - Multirace
Place of birth - Native, outside of US (%) - Other Race
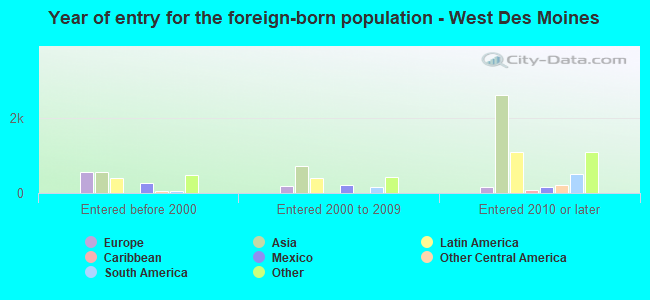
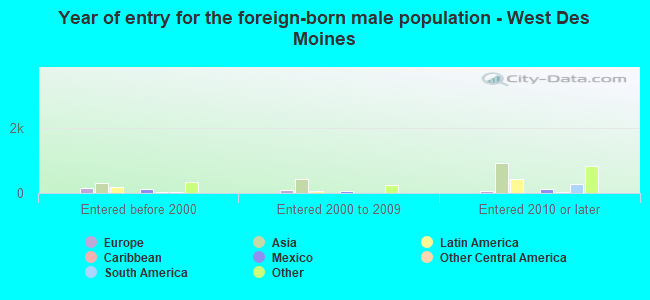
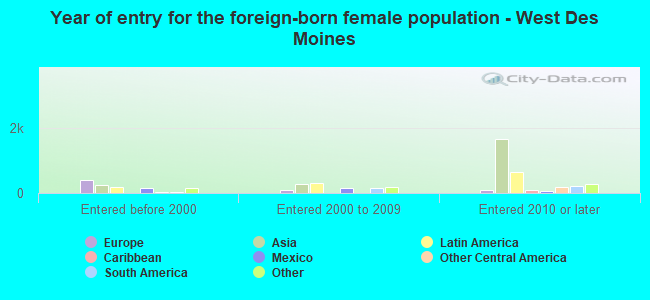
Place of birth - Foreign born (%)
Place of birth - Foreign born (%) - White
Place of birth - Foreign born (%) - Black or African American
Place of birth - Foreign born (%) - Asian
Place of birth - Foreign born (%) - Hispanic or Latino
Place of birth - Foreign born (%) - American Indian and Alaska Native
Place of birth - Foreign born (%) - Multirace
Place of birth - Foreign born (%) - Other Race
Residents speaking English at home (%)
Residents speaking English at home - Born in the United States (%)
Residents speaking English at home - Native, born elsewhere (%)
Residents speaking English at home - Foreign born (%)
Residents speaking Spanish at home (%)
Residents speaking Spanish at home - Born in the United States (%)
Residents speaking Spanish at home - Native, born elsewhere (%)
Residents speaking Spanish at home - Foreign born (%)
Residents speaking other language at home (%)
Residents speaking other language at home - Born in the United States (%)
Residents speaking other language at home - Native, born elsewhere (%)
Residents speaking other language at home - Foreign born (%)
Marital status - Never married (%)
Marital status - Now married (%)
Marital status - Separated (%)
Marital status - Widowed (%)
Marital status - Divorced (%)
Ancestries Reported - Arab (%)
Ancestries Reported - Czech (%)
Ancestries Reported - Danish (%)
Ancestries Reported - Dutch (%)
Ancestries Reported - English (%)
Ancestries Reported - French (%)
Ancestries Reported - French Canadian (%)
Ancestries Reported - German (%)
Ancestries Reported - Greek (%)
Ancestries Reported - Hungarian (%)
Ancestries Reported - Irish (%)
Ancestries Reported - Italian (%)
Ancestries Reported - Lithuanian (%)
Ancestries Reported - Norwegian (%)
Ancestries Reported - Polish (%)
Ancestries Reported - Portuguese (%)
Ancestries Reported - Russian (%)
Ancestries Reported - Scotch-Irish (%)
Ancestries Reported - Scottish (%)
Ancestries Reported - Slovak (%)
Ancestries Reported - Subsaharan African (%)
Ancestries Reported - Swedish (%)
Ancestries Reported - Swiss (%)
Ancestries Reported - Ukrainian (%)
Ancestries Reported - United States (%)
Ancestries Reported - Welsh (%)
Ancestries Reported - West Indian (%)
Ancestries Reported - Other (%)
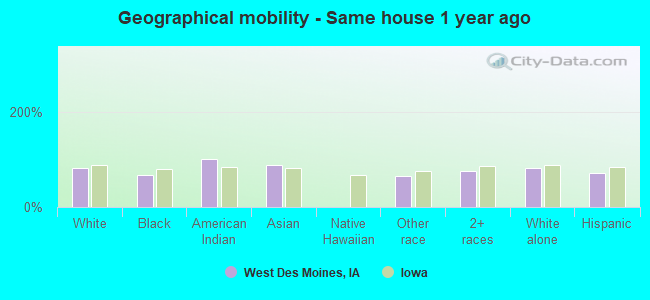
Geographical mobility - Same house 1 year ago (%)
Geographical mobility - Same house 1 year ago (%) - White
Geographical mobility - Same house 1 year ago (%) - Black or African American
Geographical mobility - Same house 1 year ago (%) - Asian
Geographical mobility - Same house 1 year ago (%) - Hispanic or Latino
Geographical mobility - Same house 1 year ago (%) - American Indian and Alaska Native
Geographical mobility - Same house 1 year ago (%) - Multirace
Geographical mobility - Same house 1 year ago (%) - Other Race
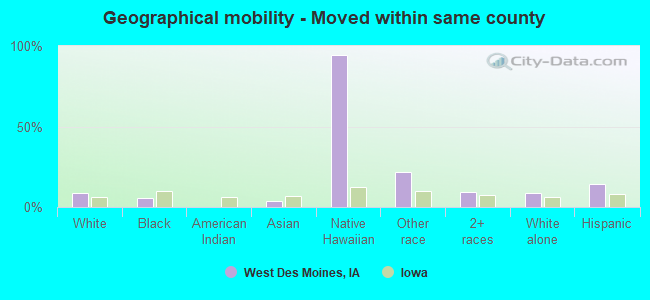
Geographical mobility - Moved within same county (%)
Geographical mobility - Moved within same county (%) - White
Geographical mobility - Moved within same county (%) - Black or African American
Geographical mobility - Moved within same county (%) - Asian
Geographical mobility - Moved within same county (%) - Hispanic or Latino
Geographical mobility - Moved within same county (%) - American Indian and Alaska Native
Geographical mobility - Moved within same county (%) - Multirace
Geographical mobility - Moved within same county (%) - Other Race
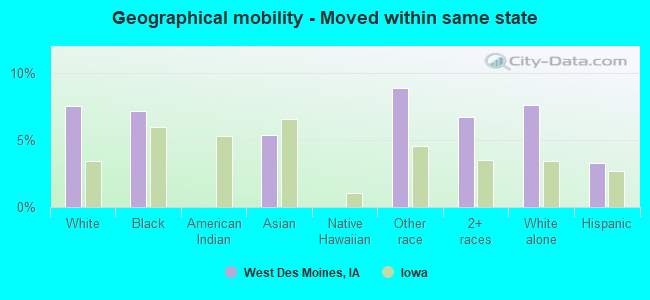
Geographical mobility - Moved from different county within same state (%)
Geographical mobility - Moved from different county within same state (%) - White
Geographical mobility - Moved from different county within same state (%) - Black or African American
Geographical mobility - Moved from different county within same state (%) - Asian
Geographical mobility - Moved from different county within same state (%) - Hispanic or Latino
Geographical mobility - Moved from different county within same state (%) - American Indian and Alaska Native
Geographical mobility - Moved from different county within same state (%) - Multirace
Geographical mobility - Moved from different county within same state (%) - Other Race
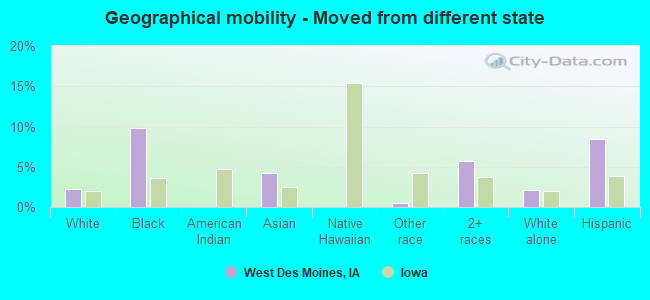
Geographical mobility - Moved from different state (%)
Geographical mobility - Moved from different state (%) - White
Geographical mobility - Moved from different state (%) - Black or African American
Geographical mobility - Moved from different state (%) - Asian
Geographical mobility - Moved from different state (%) - Hispanic or Latino
Geographical mobility - Moved from different state (%) - American Indian and Alaska Native
Geographical mobility - Moved from different state (%) - Multirace
Geographical mobility - Moved from different state (%) - Other Race
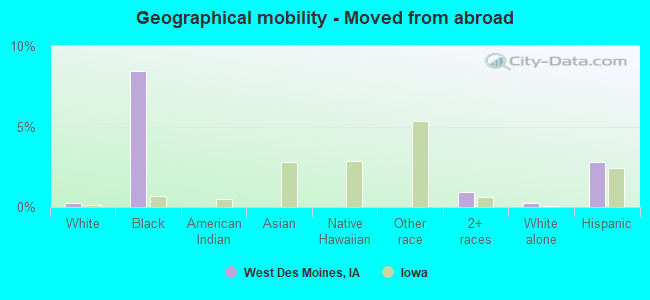
Geographical mobility - Moved from abroad (%)
Geographical mobility - Moved from abroad (%) - White
Geographical mobility - Moved from abroad (%) - Black or African American
Geographical mobility - Moved from abroad (%) - Asian
Geographical mobility - Moved from abroad (%) - Hispanic or Latino
Geographical mobility - Moved from abroad (%) - American Indian and Alaska Native
Geographical mobility - Moved from abroad (%) - Multirace
Geographical mobility - Moved from abroad (%) - Other Race
Place of birth for the foreign-born population - Ireland (%)
Place of birth for the foreign-born population - Denmark (%)
Place of birth for the foreign-born population - Norway (%)
Place of birth for the foreign-born population - Sweden (%)
Place of birth for the foreign-born population - United Kingdom (%)
Place of birth for the foreign-born population - England (%)
Place of birth for the foreign-born population - Scotland (%)
Place of birth for the foreign-born population - Other Northern Europe (%)
Place of birth for the foreign-born population - Austria (%)
Place of birth for the foreign-born population - Belgium (%)
Place of birth for the foreign-born population - France (%)
Place of birth for the foreign-born population - Germany (%)
Place of birth for the foreign-born population - Netherlands (%)
Place of birth for the foreign-born population - Switzerland (%)
Place of birth for the foreign-born population - Other Western Europe (%)
Place of birth for the foreign-born population - Greece (%)
Place of birth for the foreign-born population - Italy (%)
Place of birth for the foreign-born population - Portugal (%)
Place of birth for the foreign-born population - Spain (%)
Place of birth for the foreign-born population - Other Southern Europe (%)
Place of birth for the foreign-born population - Albania (%)
Place of birth for the foreign-born population - Belarus (%)
Place of birth for the foreign-born population - Bosnia and Herzegovina (%)
Place of birth for the foreign-born population - Bulgaria (%)
Place of birth for the foreign-born population - Croatia (%)
Place of birth for the foreign-born population - Czechoslovakia (%)
Place of birth for the foreign-born population - Hungary (%)
Place of birth for the foreign-born population - Latvia (%)
Place of birth for the foreign-born population - Lithuania (%)
Place of birth for the foreign-born population - North Macedonia (Macedonia) (%)
Place of birth for the foreign-born population - Moldova (%)
Place of birth for the foreign-born population - Poland (%)
Place of birth for the foreign-born population - Romania (%)
Place of birth for the foreign-born population - Russia (%)
Place of birth for the foreign-born population - Serbia (%)
Place of birth for the foreign-born population - Ukraine (%)
Place of birth for the foreign-born population - Other Eastern Europe (%)
Place of birth for the foreign-born population - China (%)
Place of birth for the foreign-born population - Hong Kong (%)
Place of birth for the foreign-born population - Taiwan (%)
Place of birth for the foreign-born population - Japan (%)
Place of birth for the foreign-born population - Korea (%)
Place of birth for the foreign-born population - Other Eastern Asia (%)
Place of birth for the foreign-born population - Afghanistan (%)
Place of birth for the foreign-born population - Bangladesh (%)
Place of birth for the foreign-born population - India (%)
Place of birth for the foreign-born population - Iran (%)
Place of birth for the foreign-born population - Kazakhstan (%)
Place of birth for the foreign-born population - Nepal (%)
Place of birth for the foreign-born population - Pakistan (%)
Place of birth for the foreign-born population - Sri Lanka (%)
Place of birth for the foreign-born population - Uzbekistan (%)
Place of birth for the foreign-born population - Other South Central Asia (%)
Place of birth for the foreign-born population - Burma (%)
Place of birth for the foreign-born population - Cambodia (%)
Place of birth for the foreign-born population - Indonesia (%)
Place of birth for the foreign-born population - Laos (%)
Place of birth for the foreign-born population - Malaysia (%)
Place of birth for the foreign-born population - Philippines (%)
Place of birth for the foreign-born population - Singapore (%)
Place of birth for the foreign-born population - Thailand (%)
Place of birth for the foreign-born population - Vietnam (%)
Place of birth for the foreign-born population - Other South Eastern Asia (%)
Place of birth for the foreign-born population - Armenia (%)
Place of birth for the foreign-born population - Iraq (%)
Place of birth for the foreign-born population - Israel (%)
Place of birth for the foreign-born population - Jordan (%)
Place of birth for the foreign-born population - Kuwait (%)
Place of birth for the foreign-born population - Lebanon (%)
Place of birth for the foreign-born population - Saudi Arabia (%)
Place of birth for the foreign-born population - Syria (%)
Place of birth for the foreign-born population - Turkey (%)
Place of birth for the foreign-born population - Yemen (%)
Place of birth for the foreign-born population - Other Western Asia (%)
Place of birth for the foreign-born population - Eritrea (%)
Place of birth for the foreign-born population - Ethiopia (%)
Place of birth for the foreign-born population - Kenya (%)
Place of birth for the foreign-born population - Somalia (%)
Place of birth for the foreign-born population - Uganda (%)
Place of birth for the foreign-born population - Zimbabwe (%)
Place of birth for the foreign-born population - Other Eastern Africa (%)
Place of birth for the foreign-born population - Cameroon (%)
Place of birth for the foreign-born population - Congo (%)
Place of birth for the foreign-born population - Democratic Republic of Congo (Zaire) (%)
Place of birth for the foreign-born population - Other Middle Africa (%)
Place of birth for the foreign-born population - Egypt (%)
Place of birth for the foreign-born population - Morocco (%)
Place of birth for the foreign-born population - Sudan (%)
Place of birth for the foreign-born population - Other Northern Africa (%)
Place of birth for the foreign-born population - South Africa (%)
Place of birth for the foreign-born population - Other Southern Africa (%)
Place of birth for the foreign-born population - Cabo Verde (%)
Place of birth for the foreign-born population - Ghana (%)
Place of birth for the foreign-born population - Liberia (%)
Place of birth for the foreign-born population - Nigeria (%)
Place of birth for the foreign-born population - Senegal (%)
Place of birth for the foreign-born population - Sierra Leone (%)
Place of birth for the foreign-born population - Other Western Africa (%)
Place of birth for the foreign-born population - Australia (%)
Place of birth for the foreign-born population - New Zealand (%)
Place of birth for the foreign-born population - Fiji (%)
Place of birth for the foreign-born population - Micronesia (%)
Place of birth for the foreign-born population - Bahamas (%)
Place of birth for the foreign-born population - Barbados (%)
Place of birth for the foreign-born population - Cuba (%)
Place of birth for the foreign-born population - Dominica (%)
Place of birth for the foreign-born population - Dominican Republic (%)
Place of birth for the foreign-born population - Grenada (%)
Place of birth for the foreign-born population - Haiti (%)
Place of birth for the foreign-born population - Jamaica (%)
Place of birth for the foreign-born population - St. Vincent and the Grenadines (%)
Place of birth for the foreign-born population - Trinidad and Tobago (%)
Place of birth for the foreign-born population - West Indies (%)
Place of birth for the foreign-born population - Other Caribbean (%)
Place of birth for the foreign-born population - Belize (%)
Place of birth for the foreign-born population - Costa Rica (%)
Place of birth for the foreign-born population - El Salvador (%)
Place of birth for the foreign-born population - Guatemala (%)
Place of birth for the foreign-born population - Honduras (%)
Place of birth for the foreign-born population - Mexico (%)
Place of birth for the foreign-born population - Nicaragua (%)
Place of birth for the foreign-born population - Panama (%)
Place of birth for the foreign-born population - Other Central America (%)
Place of birth for the foreign-born population - Argentina (%)
Place of birth for the foreign-born population - Bolivia (%)
Place of birth for the foreign-born population - Brazil (%)
Place of birth for the foreign-born population - Chile (%)
Place of birth for the foreign-born population - Colombia (%)
Place of birth for the foreign-born population - Ecuador (%)
Place of birth for the foreign-born population - Guyana (%)
Place of birth for the foreign-born population - Peru (%)
Place of birth for the foreign-born population - Uruguay (%)
Place of birth for the foreign-born population - Venezuela (%)
Place of birth for the foreign-born population - Other South America (%)
Place of birth for the foreign-born population - Canada (%)
Place of birth for the foreign-born population - Other Northern America (%)
Place of birth for the foreign-born population - Other (%)
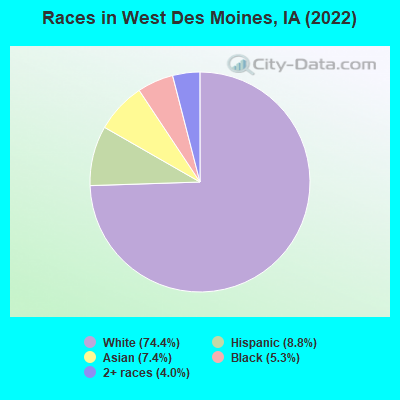
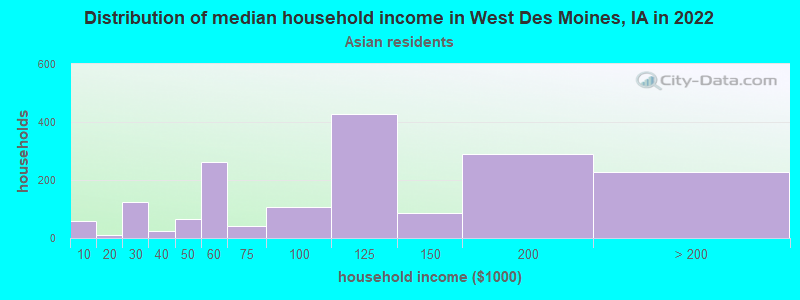
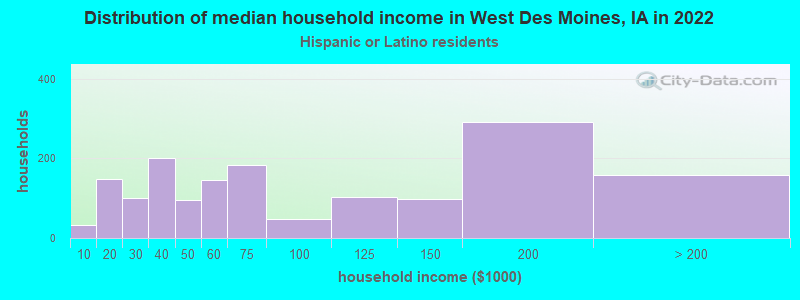
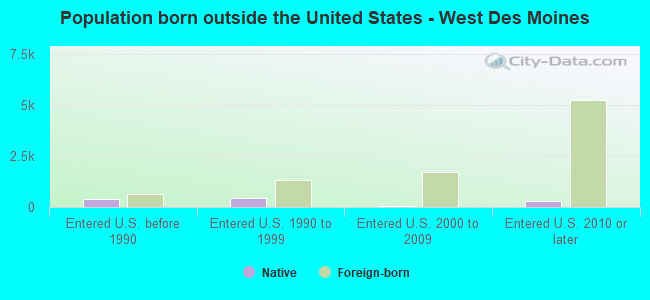
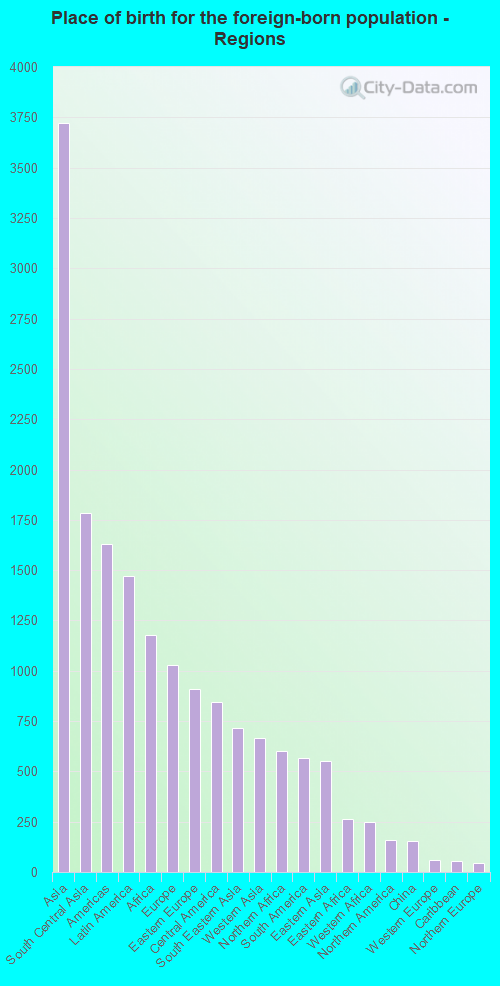
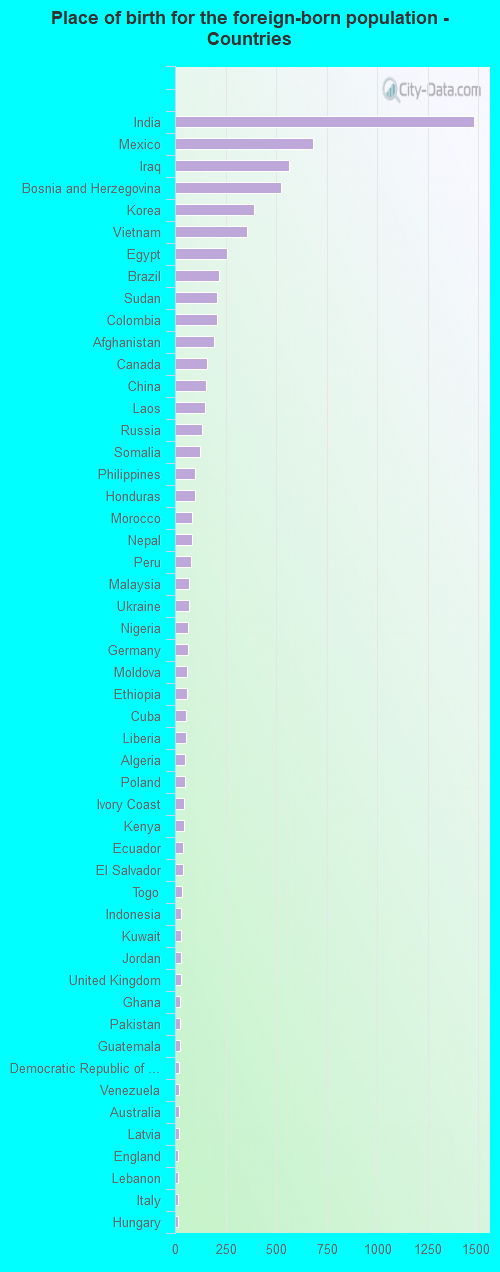
According to 2022 data, the most numerous races in West Des Moines, IA are White alone (55,035 residents), Hispanic (6,517 residents), and Black alone (3,891 residents). 84.6% of West Des Moines residents speak English at home. 10.9% of West Des Moines, IA residents are foreign-born (5.3% born in Asia, 2.1% born in Latin America, 1.7% born in Africa, 1.5% born in Europe), which is 53.9% greater than the foreign-born rate of 5.0% across the entire state of Iowa.
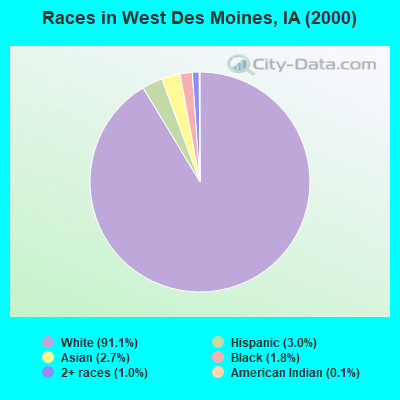
Race distribution in West Des Moines
2000 2022
2,710,344 92.6% White alone 82,473 2.8% Hispanic 60,744 2.1% Black alone 36,345 1.2% Asian alone 25,472 0.9% Two or more races 7,955 0.3% American Indian alone 2,103 0.07% Other race alone 888 0.03% Native Hawaiian and Other
2,650,110 82.8% White alone 218,024 6.8% Hispanic 119,004 3.7% Black alone 115,286 3.6% Two or more races 74,892 2.3% Asian alone 9,260 0.3% Other race alone 8,595 0.3% Native Hawaiian and Other 5,346 0.2% American Indian alone
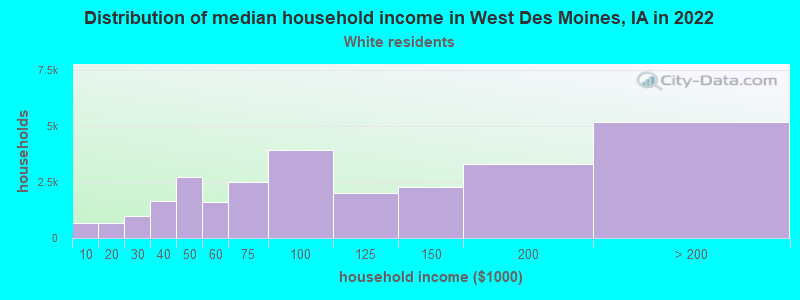
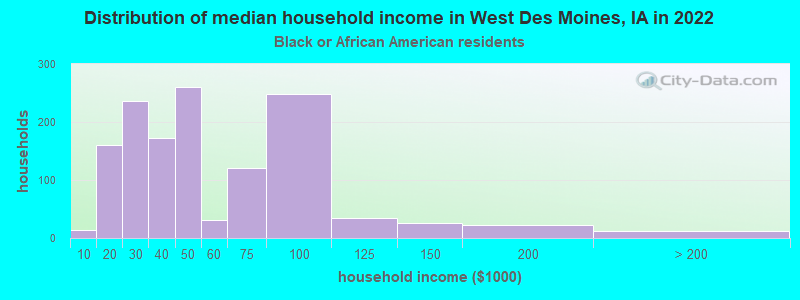
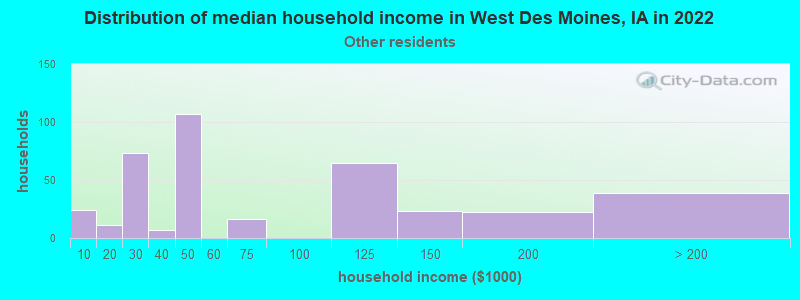
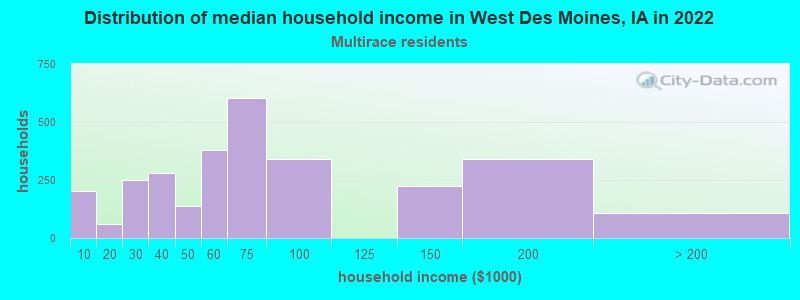
Income and house value in West Des Moines Median household income in 2022 $91,432 White non-Hispanic householders$49,397 Black householders$120,144 Asian householders$85,399 Two or more races householders$71,843 Hispanic or Latino race householdersMedian 2022 house value $302,648 White Non-Hispanic householders$295,555 Black or African American householders$389,702 American Indian or Alaska Native householders $344,563 Asian householders$241,817 Some other race householders$103,390 Two or more races householders$203,771 Hispanic or Latino householders
Median age by race in West Des Moines
36.8 Median age for White residents37.2 36.7 27.9 Median age for Black or African American residents27.9 27.5 -666,666,666.0 Median age for American Indian / Alaska Native residents-666,666,666.0 -666,666,666.0 32.3 Median age for Asian residents34.4 24.9 -666,666,666.0 Median age for Native Hawaiian / Pacific Islander residents-666,666,666.0 -666,666,666.0 32.5 Median age for Other race residents47.5 32.1 18.9 Median age for Two or more races residents23.6 18.6 37.4 Median age for White alone residents37.6 37.0 28.1 Median age for Hispanic or Latino residents30.1 27.9
Owner/renter occupied households by race in West Des Moines
House owners and renters - White residents 17,012 61.9% Owner occupied10,449 38.1% Renter occupiedHouse owners and renters - Black or African American residents 136 15.3% Owner occupied754 84.7% Renter occupiedHouse owners and renters - American Indian / Alaska Native residents 8 100.0% Owner occupiedHouse owners and renters - Asian residents 791 46.0% Owner occupied929 54.0% Renter occupiedHouse owners and renters - Native Hawaiian / Pacific Islander residents 42 100.0% Owner occupiedHouse owners and renters - Other race residents 227 58.1% Owner occupied164 41.9% Renter occupiedHouse owners and renters - Two or more races residents 666 47.2% Owner occupied746 52.8% Renter occupiedHouse owners and renters - White alone residents 16,811 62.9% Owner occupied9,929 37.1% Renter occupiedHouse owners and renters - Hispanic or Latino residents 763 38.3% Owner occupied1,228 61.7% Renter occupied
Language usage in West Des Moines
English speakers - Total 84.6% of residents of West Des Moines speak English at home.
6.3% of residents speak Spanish at home 2,271 51.2% Speak English very well2,163 48.8% Speak English less than very well9.1% of residents speak other language at home 4,911 77.1% Speak English very well1,457 22.9% Speak English less than very well
English speakers - Born in the United States 92.2% of residents of West Des Moines speak English at home.
5.5% of residents speak Spanish at home 916 87.0% Speak English very well137 13.0% Speak English less than very well2.3% of residents speak other language at home 378 86.5% Speak English very well59 13.5% Speak English less than very well
All residents speak only English at home
English speakers - Foreign-born 13.6% of residents of West Des Moines speak English at home.
24.6% of residents speak Spanish at home 341 16.5% Speak English very well1,724 83.5% Speak English less than very well61.8% of residents speak other language at home 4,020 77.5% Speak English very well1,166 22.5% Speak English less than very well
White (Caucasian) - Speak only English Native:
97.8% (51,205)Foreign-born:
14.4% (310)
White (Caucasian) - Speak another language Native:
2.2% (1,126)Foreign-born:
85.6% (1,846)
Black or African American - Speak only English Native:
95.3% (1,669)Foreign-born:
3.5% (40)
Black or African American - Speak another language Native:
2.6% (45)Foreign-born:
100.0% (1,157)
Asian - Speak only English Native:
64.8% (1,165)Foreign-born:
25.2% (749)
Asian - Speak another language Native:
35.2% (634)Foreign-born:
74.8% (2,229)
Other race - Speak only English Native:
72.3% (556)Foreign-born:
7.0% (50)
Other race - Speak another language Native:
34.8% (268)Foreign-born:
93.3% (674)
Two or more races - Speak only English Native:
76.9% (3,521)Foreign-born:
8.1% (131)
Two or more races - Speak another language Native:
22.2% (1,017)Foreign-born:
92.0% (1,494)
White alone - Speak only English Native:
98.2% (49,961)Foreign-born:
14.4% (310)
White alone - Speak another language Native:
1.8% (914)Foreign-born:
85.6% (1,846)
Hispanic or Latino - Speak only English Native:
53.8% (2,189)Foreign-born:
1.3% (28)
Hispanic or Latino - Speak another language Native:
46.2% (1,877)Foreign-born:
98.7% (2,065)
Foreign-born residents in West Des Moines 7,577 residents are foreign born (5.3% Asia , 2.1% Latin America , 1.7% Africa , 1.5% Europe ).
Marital status for residents in West Des Moines Marital status - White (Caucasian) population 15 years and over
Males 37.9% Never married52.2% Now married1.3% Separated1.3% Widowed7.3% DivorcedFemales 36.8% Never married42.9% Now married1.7% Separated6.5% Widowed12.1% DivorcedWomen who gave birth in the past 12 months Now married:
80.3% (273)Unmarried:
19.7% (67)
Women who did not give birth in the past 12 months Now married:
36.0% (5,964)Unmarried:
64.0% (10,622)
Marital status - Black or African American population 15 years and over
Males 34.7% Never married49.3% Now married0.5% Separated0.7% Widowed14.8% DivorcedFemales 46.5% Never married36.7% Now married5.0% Separated2.4% Widowed9.4% DivorcedWomen who gave birth in the past 12 months Now married:
98.6% (73)Unmarried:
1.4% (1)
Women who did not give birth in the past 12 months Now married:
36.6% (305)Unmarried:
63.4% (530)
Marital status - American Indian / Alaska Native population 15 years and over
Males 0.0% Never married100.0% Now married0.0% Separated0.0% Widowed0.0% DivorcedFemales 0.0% Never married100.0% Now married0.0% Separated0.0% Widowed0.0% DivorcedWomen who did not give birth in the past 12 months Now married:
100.0% (4)Unmarried:
0.0% (0)
Marital status - Asian population 15 years and over
Males 45.3% Never married50.5% Now married1.0% Separated2.7% Widowed0.5% DivorcedFemales 27.3% Never married59.9% Now married1.0% Separated2.0% Widowed9.9% DivorcedWomen who gave birth in the past 12 months Now married:
100.0% (8)Unmarried:
0.0% (0)
Women who did not give birth in the past 12 months Now married:
53.5% (731)Unmarried:
46.5% (634)
Marital status - Other race population 15 years and over
Males 30.8% Never married59.5% Now married0.0% Separated4.5% Widowed5.3% DivorcedFemales 44.6% Never married27.5% Now married0.0% Separated12.3% Widowed15.6% DivorcedWomen who did not give birth in the past 12 months Now married:
30.3% (180)Unmarried:
69.7% (414)
Marital status - Two or more races population 15 years and over
Males 52.5% Never married38.7% Now married0.0% Separated0.0% Widowed8.8% DivorcedFemales 46.5% Never married37.5% Now married2.1% Separated9.1% Widowed4.8% DivorcedWomen who gave birth in the past 12 months Now married:
100.0% (94)Unmarried:
0.0% (0)
Women who did not give birth in the past 12 months Now married:
35.9% (619)Unmarried:
64.1% (1,105)
Marital status - White alone, not Hispanic / Latino population 15 years and over
Males 38.0% Never married52.0% Now married1.3% Separated1.3% Widowed7.4% DivorcedFemales 35.6% Never married43.4% Now married1.8% Separated6.7% Widowed12.5% DivorcedWomen who gave birth in the past 12 months Now married:
80.3% (273)Unmarried:
19.7% (67)
Women who did not give birth in the past 12 months Now married:
36.8% (5,824)Unmarried:
63.2% (9,997)
Marital status - Hispanic or Latino population 15 years and over
Males 33.6% Never married62.7% Now married0.0% Separated0.0% Widowed3.7% DivorcedFemales 39.5% Never married36.2% Now married0.7% Separated14.2% Widowed9.4% DivorcedWomen who gave birth in the past 12 months Now married:
100.0% (55)Unmarried:
0.0% (0)
Women who did not give birth in the past 12 months Now married:
38.9% (528)Unmarried:
61.1% (828)
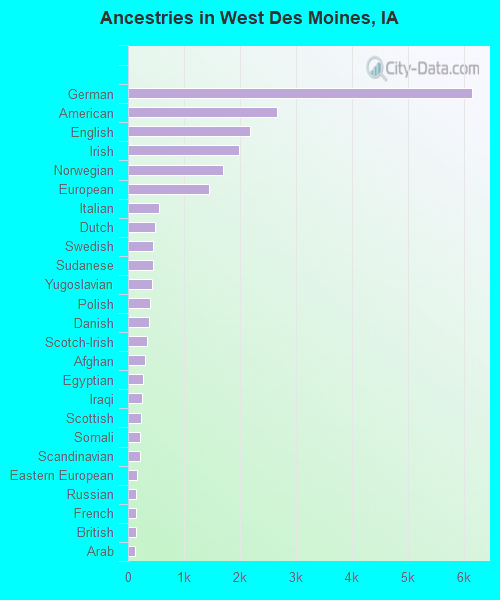
Ancestries in West Des Moines
6,146 19.2% German2,660 8.3% American2,177 6.8% English1,981 6.2% Irish1,702 5.3% Norwegian1,444 4.5% European552 1.7% Italian486 1.5% Dutch445 1.4% Swedish444 1.4% Sudanese427 1.3% Yugoslavian388 1.2% Polish372 1.2% Danish337 1.1% Scotch-Irish312 1.0% Afghan273 0.9% Egyptian243 0.8% Iraqi234 0.7% Scottish214 0.7% Somali210 0.7% Scandinavian155 0.5% Eastern European144 0.4% Russian142 0.4% French137 0.4% British123 0.4% Arab116 0.4% Czech92 0.3% Moroccan90 0.3% African76 0.2% Welsh73 0.2% Macedonian73 0.2% Northern European68 0.2% Nigerian65 0.2% French Canadian63 0.2% Ethiopian61 0.2% Romanian58 0.2% Luxembourger57 0.2% Finnish54 0.2% Ukrainian49 0.2% Lebanese45 0.1% Czechoslovakian39 0.1% Armenian39 0.1% Liberian36 0.1% Canadian32 0.10% Slovak15 0.05% Sierra Leonean14 0.04% Australian11 0.03% Brazilian11 0.03% Hungarian8 0.02% Kenyan7 0.02% Palestinian7 0.02% Croatian6 0.02% Bulgarian5 0.02% Ghanaian
Geographical mobility in West Des Moines Same house 1 year ago 45,872 81.5% White (Caucasian)2,106 68.4% Black or African American45 100.0% American Indian / Alaska Native3,507 86.7% Asian1,052 66.4% Other race5,068 76.1% Two or more races44,681 81.5% White alone, not Hispanic / Latino4,569 71.2% Hispanic or LatinoMoved within same county 4,813 8.5% White / Caucasian170 5.5% Black or African American143 3.5% Asian25 94.6% Native Hawaiian / Pacific Islander345 21.8% Other race605 9.1% Two or more races4,673 8.5% White alone, not Hispanic / Latino917 14.3% Hispanic or LatinoMoved within same state 4,246 7.5% White / Caucasian220 7.1% Black or African American218 5.4% Asian141 8.9% Other race449 6.7% Two or more races4,158 7.6% White alone, not Hispanic / Latino211 3.3% Hispanic or LatinoMoved from different state 1,230 2.2% White / Caucasian303 9.8% Black or African American172 4.3% Asian8 0.5% Other race377 5.7% Two or more races1,149 2.1% White alone, not Hispanic / Latino539 8.4% Hispanic or LatinoMoved from abroad 152 0.3% White260 8.5% Black or African American62 0.9% Two or more races152 0.3% White alone, not Hispanic / Latino181 2.8% Hispanic or Latino
Children Nativity (place of birth) in West Des Moines
Children under 6 years - Living with two parents Both parents native 1,798 100.0% NativeBoth parents foreign-born 1,199 100.0% NativeOne native, one foreign-born parent 455 100.0% NativeChildren under 6 years - Living with one parent Native parent 355 100.0% NativeForeign-born parent 515 83.5% Native102 16.5% Foreign-bornChildren 6 to 17 years - Living with two parents Both parents native 6,305 100.0% NativeBoth parents foreign-born 879 62.1% Native537 37.9% Foreign-bornOne native, one foreign-born parent 162 57.9% Native118 42.1% Foreign-bornChildren 6 to 17 years - Living with one parent Native parent 2,138 100.0% NativeForeign-born parent 1,051 50.0% Native1,051 50.0% Foreign-born
Grandparents responsible for own grandchildren in West Des Moines
Grandparents (30 to 59 years) White / Caucasian 74 91.3% Responsible for grandchildren7 8.7% Not responsible for grandchildrenOther race 19 100.0% Not responsible for grandchildrenWhite alone, not Hispanic / Latino 74 90.2% Responsible for grandchildren8 9.8% Not responsible for grandchildrenHispanic or Latino 7 100.0% Not responsible for grandchildrenGrandparents (60 years and over) White / Caucasian 24 22.5% Responsible for grandchildren83 77.5% Not responsible for grandchildrenOther race 83 100.0% Not responsible for grandchildrenWhite alone, not Hispanic / Latino 24 21.9% Responsible for grandchildren86 78.1% Not responsible for grandchildrenHispanic or Latino 92 100.0% Not responsible for grandchildren