Races in West Goshen, Pennsylvania (PA) Detailed Stats
Ancestries, Foreign-born residents, place of birth

Recent posts about races in West Goshen, Pennsylvania on our local forum with over 2,400,000 registered users:
 | Buying House Near WCU? (15 replies) |
| Moving to PA w/in 11 Months (15 replies) |
| Commute to Newtown Square? (18 replies) |
| Moving from Marin County to Main Line PA (110 replies) |
| Where do the Boeing families live mostly (Ridley Park)? (9 replies) |
| Best Suburb with homes under 300K in area (82 replies) |
7.9% of West Goshen, PA residents are foreign-born (5.1% born in Asia, 1.9% born in Europe), which is 11.7% greater than the foreign-born rate of 7.0% across the entire state of Pennsylvania.
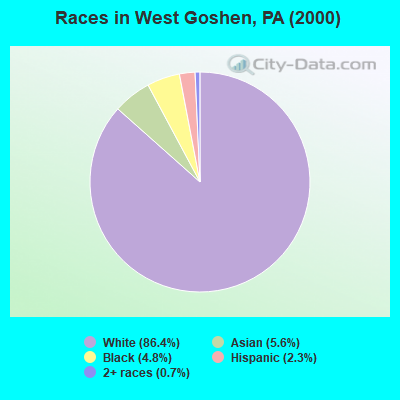
Race distribution in West Goshen

- 7,32386.4%White alone
- 4755.6%Asian alone
- 4084.8%Black alone
- 1932.3%Hispanic
- 570.7%Two or more races
- 80.09%Other race alone
- 70.08%American Indian alone
- 10.01%Native Hawaiian and Other
Pacific Islander alone
2000
2022
-
- 10,322,45584.1%White alone
- 1,202,4379.8%Black alone
- 394,0883.2%Hispanic
- 218,2961.8%Asian alone
- 113,0970.9%Two or more races
- 13,0860.1%Other race alone
- 14,9040.1%American Indian alone
- 2,6910.02%Native Hawaiian and Other
Pacific Islander alone

-
- 9,487,22873.1%White alone
- 1,311,58110.1%Black alone
- 1,115,9978.6%Hispanic
- 493,9423.8%Two or more races
- 487,1243.8%Asian alone
- 63,5820.5%Other race alone
- 10,1300.08%American Indian alone
- 2,4240.02%Native Hawaiian and Other
Pacific Islander alone

Income and house value in West Goshen
- Median household income in 2022
- $110,533White non-Hispanic householders
- $78,429Black householders
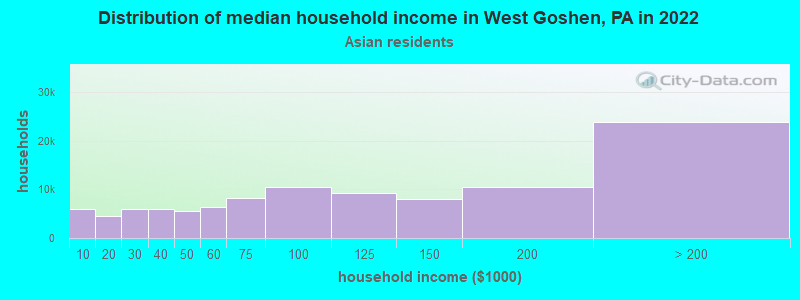
- $131,208Asian householders
- $114,771Some other race householders
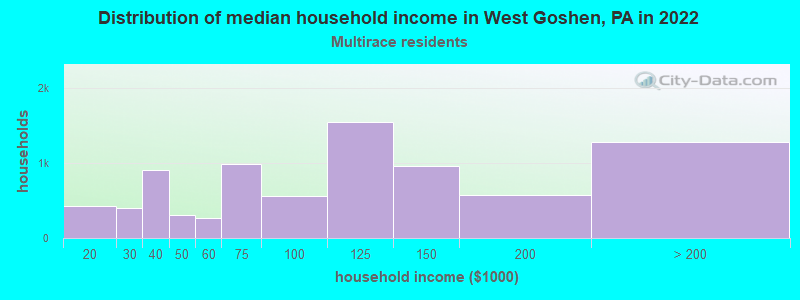
- $92,738Two or more races householders
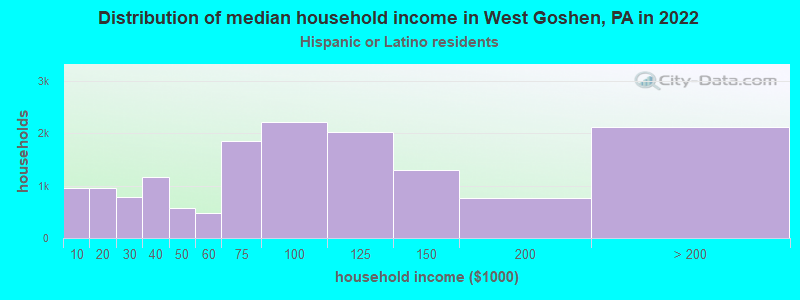
- $118,005Hispanic or Latino race householders
- Median 2022 house value
- $444,083White Non-Hispanic householders
- $411,057Black or African American householders
- $476,348Asian householders
- $412,835Two or more races householders
- $346,781Hispanic or Latino householders
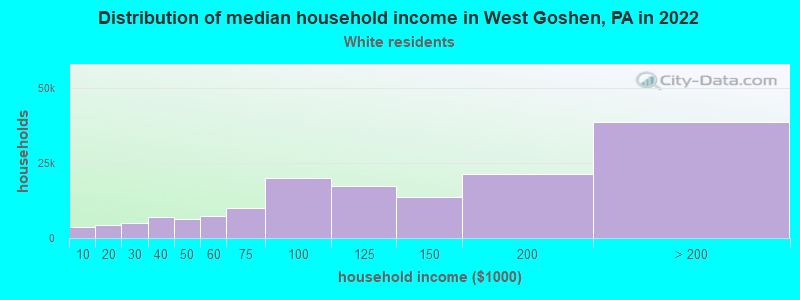
Household income for White non-Hispanic householders
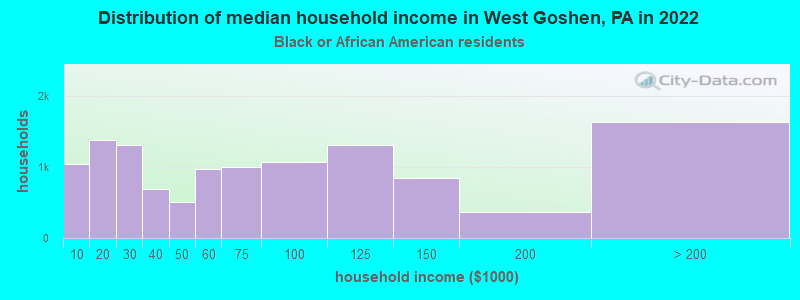
Household income for Black householders
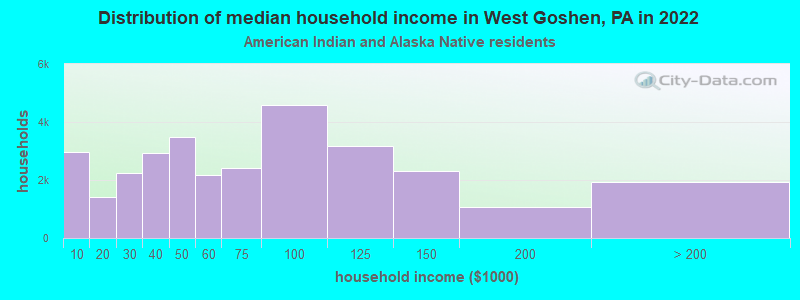
Household income for American Indian and Alaska Native householders
Household income for Asian householders
Household income for Two or more races householders
Household income for Hispanic or Latino race householders
Foreign-born residents in West Goshen
672 residents are foreign born (5.1% Asia, 1.9% Europe).
| This city: | 7.9% |
| Pennsylvania: | 4.1% |
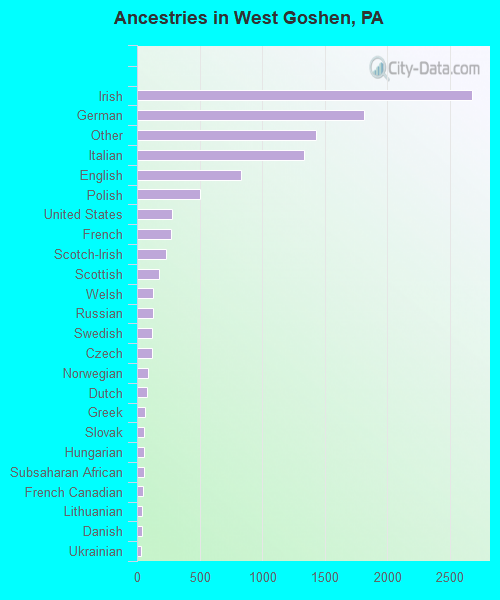
Ancestries in West Goshen

- 2,68025.2%Irish
- 1,81317.0%German
- 1,43113.4%Other
- 1,33812.6%Italian
- 8337.8%English
- 5074.8%Polish
- 2762.6%United States
- 2732.6%French
- 2332.2%Scotch-Irish
- 1761.7%Scottish
- 1261.2%Welsh
- 1251.2%Russian
- 1201.1%Swedish
- 1161.1%Czech
- 910.9%Norwegian
- 820.8%Dutch
- 650.6%Greek
- 590.6%Slovak
- 570.5%Hungarian
- 550.5%Subsaharan African
- 480.5%French Canadian
- 420.4%Lithuanian
- 390.4%Danish
- 350.3%Ukrainian
- 200.2%Swiss
- 80.08%West Indian
Zip codes: 19382.