Races in West Greenwich, Rhode Island (RI) Detailed Stats
Ancestries, Foreign-born residents, place of birth
2.6% of West Greenwich, RI residents are foreign-born (0.8% born in Europe, 0.7% born in North America, 0.5% born in Asia, 0.5% born in Latin America), which is 443.4% less than the foreign-born rate of 14.0% across the entire state of Rhode Island.
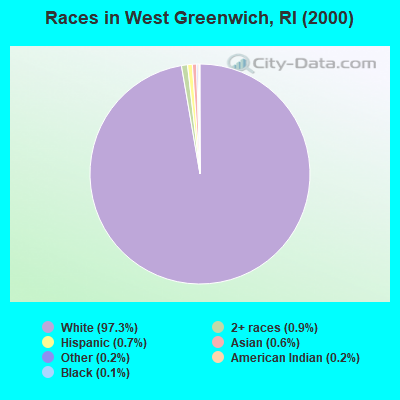
Race distribution in West Greenwich

- 4,94797.3%White alone
- 480.9%Two or more races
- 350.7%Hispanic
- 280.6%Asian alone
- 110.2%Other race alone
- 90.2%American Indian alone
- 70.1%Black alone
2000
2022
-
- 858,43381.9%White alone
- 90,8208.7%Hispanic
- 41,9224.0%Black alone
- 23,4162.2%Asian alone
- 20,8162.0%Two or more races
- 8,4110.8%Other race alone
- 4,1810.4%American Indian alone
- 3200.03%Native Hawaiian and Other
Pacific Islander alone

-
- 745,82568.2%White alone
- 191,97917.6%Hispanic
- 56,7385.2%Two or more races
- 51,3264.7%Black alone
- 37,2343.4%Asian alone
- 9,5140.9%Other race alone
- 9780.09%American Indian alone
- 1400.01%Native Hawaiian and Other
Pacific Islander alone

Income and house value in West Greenwich
- Median household income in 2022
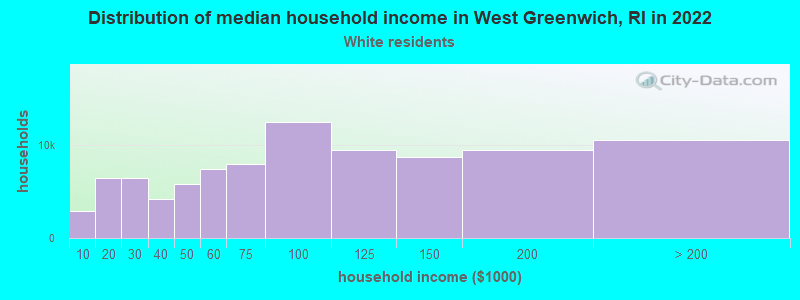
- $113,941White non-Hispanic householders
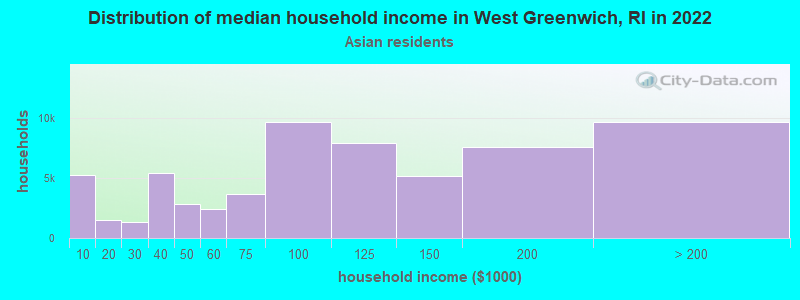
- over $200,000Asian householders
- $117,540Some other race householders
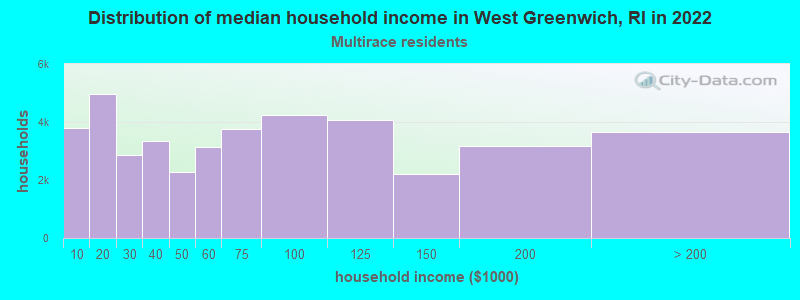
- $39,226Two or more races householders
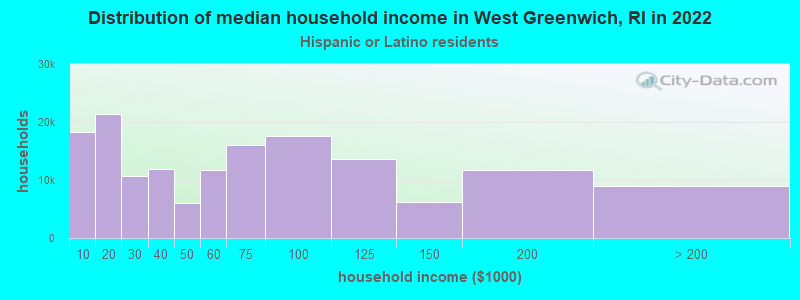
- $127,930Hispanic or Latino race householders
- Median 2022 house value
- $479,773White Non-Hispanic householders
- $797,688Asian householders
- $543,878Some other race householders
- $275,565Two or more races householders
- $435,102Hispanic or Latino householders
Household income for White non-Hispanic householders
Household income for Asian householders
Household income for Two or more races householders
Household income for Hispanic or Latino race householders
Foreign-born residents in West Greenwich
131 residents are foreign born (0.8% Europe, 0.7% North America, 0.5% Asia, 0.5% Latin America).
| This city: | 2.6% |
| Rhode Island: | 11.4% |
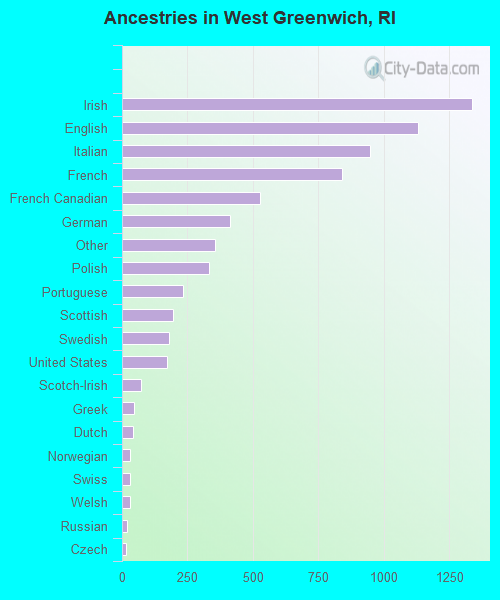
Ancestries in West Greenwich

- 1,33619.1%Irish
- 1,13116.2%English
- 94913.6%Italian
- 84212.0%French
- 5277.5%French Canadian
- 4125.9%German
- 3545.1%Other
- 3314.7%Polish
- 2333.3%Portuguese
- 1962.8%Scottish
- 1812.6%Swedish
- 1712.4%United States
- 731.0%Scotch-Irish
- 460.7%Greek
- 410.6%Dutch
- 320.5%Norwegian
- 320.5%Swiss
- 320.5%Welsh
- 210.3%Russian
- 150.2%Czech
- 120.2%Slovak
- 110.2%Lithuanian
- 60.09%Arab
- 60.09%Hungarian
- 60.09%Subsaharan African
Zip codes: 02817.