Races in West Hazleton, Pennsylvania (PA) Detailed Stats
Data:
Races - White alone (%)
Races - White alone (% change since 2000)
Races - Black alone (%)
Races - Black alone (% change since 2000)
Races - American Indian alone (%)
Races - American Indian alone (% change since 2000)
Races - Asian alone (%)
Races - Asian alone (% change since 2000)
Races - Hispanic (%)
Races - Hispanic (% change since 2000)
Races - Native Hawaiian and Other Pacific Islander alone (%)
Races - Native Hawaiian and Other Pacific Islander alone (% change since 2000)
Races - Two or more races(%)
Races - Two or more races(% change since 2000)
Races - Other race alone (%)
Races - Other race alone (% change since 2000)
Racial diversity
Place of birth - Born in state of residence (%)
Place of birth - Born in state of residence (%) - White
Place of birth - Born in state of residence (%) - Black or African American
Place of birth - Born in state of residence (%) - Asian
Place of birth - Born in state of residence (%) - Hispanic or Latino
Place of birth - Born in state of residence (%) - American Indian and Alaska Native
Place of birth - Born in state of residence (%) - Multirace
Place of birth - Born in state of residence (%) - Other Race
Place of birth - Born in other state (%)
Place of birth - Born in other state (%) - White
Place of birth - Born in other state (%) - Black or African American
Place of birth - Born in other state (%) - Asian
Place of birth - Born in other state (%) - Hispanic or Latino
Place of birth - Born in other state (%) - American Indian and Alaska Native
Place of birth - Born in other state (%) - Multirace
Place of birth - Born in other state (%) - Other Race
Place of birth - Native, outside of US (%)
Place of birth - Native, outside of US (%) - White
Place of birth - Native, outside of US (%) - Black or African American
Place of birth - Native, outside of US (%) - Asian
Place of birth - Native, outside of US (%) - Hispanic or Latino
Place of birth - Native, outside of US (%) - American Indian and Alaska Native
Place of birth - Native, outside of US (%) - Multirace
Place of birth - Native, outside of US (%) - Other Race
Place of birth - Foreign born (%)
Place of birth - Foreign born (%) - White
Place of birth - Foreign born (%) - Black or African American
Place of birth - Foreign born (%) - Asian
Place of birth - Foreign born (%) - Hispanic or Latino
Place of birth - Foreign born (%) - American Indian and Alaska Native
Place of birth - Foreign born (%) - Multirace
Place of birth - Foreign born (%) - Other Race
Residents speaking English at home (%)
Residents speaking English at home - Born in the United States (%)
Residents speaking English at home - Native, born elsewhere (%)
Residents speaking English at home - Foreign born (%)
Residents speaking Spanish at home (%)
Residents speaking Spanish at home - Born in the United States (%)
Residents speaking Spanish at home - Native, born elsewhere (%)
Residents speaking Spanish at home - Foreign born (%)
Residents speaking other language at home (%)
Residents speaking other language at home - Born in the United States (%)
Residents speaking other language at home - Native, born elsewhere (%)
Residents speaking other language at home - Foreign born (%)
Marital status - Never married (%)
Marital status - Now married (%)
Marital status - Separated (%)
Marital status - Widowed (%)
Marital status - Divorced (%)
Ancestries Reported - Arab (%)
Ancestries Reported - Czech (%)
Ancestries Reported - Danish (%)
Ancestries Reported - Dutch (%)
Ancestries Reported - English (%)
Ancestries Reported - French (%)
Ancestries Reported - French Canadian (%)
Ancestries Reported - German (%)
Ancestries Reported - Greek (%)
Ancestries Reported - Hungarian (%)
Ancestries Reported - Irish (%)
Ancestries Reported - Italian (%)
Ancestries Reported - Lithuanian (%)
Ancestries Reported - Norwegian (%)
Ancestries Reported - Polish (%)
Ancestries Reported - Portuguese (%)
Ancestries Reported - Russian (%)
Ancestries Reported - Scotch-Irish (%)
Ancestries Reported - Scottish (%)
Ancestries Reported - Slovak (%)
Ancestries Reported - Subsaharan African (%)
Ancestries Reported - Swedish (%)
Ancestries Reported - Swiss (%)
Ancestries Reported - Ukrainian (%)
Ancestries Reported - United States (%)
Ancestries Reported - Welsh (%)
Ancestries Reported - West Indian (%)
Ancestries Reported - Other (%)
Geographical mobility - Same house 1 year ago (%)
Geographical mobility - Same house 1 year ago (%) - White
Geographical mobility - Same house 1 year ago (%) - Black or African American
Geographical mobility - Same house 1 year ago (%) - Asian
Geographical mobility - Same house 1 year ago (%) - Hispanic or Latino
Geographical mobility - Same house 1 year ago (%) - American Indian and Alaska Native
Geographical mobility - Same house 1 year ago (%) - Multirace
Geographical mobility - Same house 1 year ago (%) - Other Race
Geographical mobility - Moved within same county (%)
Geographical mobility - Moved within same county (%) - White
Geographical mobility - Moved within same county (%) - Black or African American
Geographical mobility - Moved within same county (%) - Asian
Geographical mobility - Moved within same county (%) - Hispanic or Latino
Geographical mobility - Moved within same county (%) - American Indian and Alaska Native
Geographical mobility - Moved within same county (%) - Multirace
Geographical mobility - Moved within same county (%) - Other Race
Geographical mobility - Moved from different county within same state (%)
Geographical mobility - Moved from different county within same state (%) - White
Geographical mobility - Moved from different county within same state (%) - Black or African American
Geographical mobility - Moved from different county within same state (%) - Asian
Geographical mobility - Moved from different county within same state (%) - Hispanic or Latino
Geographical mobility - Moved from different county within same state (%) - American Indian and Alaska Native
Geographical mobility - Moved from different county within same state (%) - Multirace
Geographical mobility - Moved from different county within same state (%) - Other Race
Geographical mobility - Moved from different state (%)
Geographical mobility - Moved from different state (%) - White
Geographical mobility - Moved from different state (%) - Black or African American
Geographical mobility - Moved from different state (%) - Asian
Geographical mobility - Moved from different state (%) - Hispanic or Latino
Geographical mobility - Moved from different state (%) - American Indian and Alaska Native
Geographical mobility - Moved from different state (%) - Multirace
Geographical mobility - Moved from different state (%) - Other Race
Geographical mobility - Moved from abroad (%)
Geographical mobility - Moved from abroad (%) - White
Geographical mobility - Moved from abroad (%) - Black or African American
Geographical mobility - Moved from abroad (%) - Asian
Geographical mobility - Moved from abroad (%) - Hispanic or Latino
Geographical mobility - Moved from abroad (%) - American Indian and Alaska Native
Geographical mobility - Moved from abroad (%) - Multirace
Geographical mobility - Moved from abroad (%) - Other Race
Place of birth for the foreign-born population - Ireland (%)
Place of birth for the foreign-born population - Denmark (%)
Place of birth for the foreign-born population - Norway (%)
Place of birth for the foreign-born population - Sweden (%)
Place of birth for the foreign-born population - United Kingdom (%)
Place of birth for the foreign-born population - England (%)
Place of birth for the foreign-born population - Scotland (%)
Place of birth for the foreign-born population - Other Northern Europe (%)
Place of birth for the foreign-born population - Austria (%)
Place of birth for the foreign-born population - Belgium (%)
Place of birth for the foreign-born population - France (%)
Place of birth for the foreign-born population - Germany (%)
Place of birth for the foreign-born population - Netherlands (%)
Place of birth for the foreign-born population - Switzerland (%)
Place of birth for the foreign-born population - Other Western Europe (%)
Place of birth for the foreign-born population - Greece (%)
Place of birth for the foreign-born population - Italy (%)
Place of birth for the foreign-born population - Portugal (%)
Place of birth for the foreign-born population - Spain (%)
Place of birth for the foreign-born population - Other Southern Europe (%)
Place of birth for the foreign-born population - Albania (%)
Place of birth for the foreign-born population - Belarus (%)
Place of birth for the foreign-born population - Bosnia and Herzegovina (%)
Place of birth for the foreign-born population - Bulgaria (%)
Place of birth for the foreign-born population - Croatia (%)
Place of birth for the foreign-born population - Czechoslovakia (%)
Place of birth for the foreign-born population - Hungary (%)
Place of birth for the foreign-born population - Latvia (%)
Place of birth for the foreign-born population - Lithuania (%)
Place of birth for the foreign-born population - North Macedonia (Macedonia) (%)
Place of birth for the foreign-born population - Moldova (%)
Place of birth for the foreign-born population - Poland (%)
Place of birth for the foreign-born population - Romania (%)
Place of birth for the foreign-born population - Russia (%)
Place of birth for the foreign-born population - Serbia (%)
Place of birth for the foreign-born population - Ukraine (%)
Place of birth for the foreign-born population - Other Eastern Europe (%)
Place of birth for the foreign-born population - China (%)
Place of birth for the foreign-born population - Hong Kong (%)
Place of birth for the foreign-born population - Taiwan (%)
Place of birth for the foreign-born population - Japan (%)
Place of birth for the foreign-born population - Korea (%)
Place of birth for the foreign-born population - Other Eastern Asia (%)
Place of birth for the foreign-born population - Afghanistan (%)
Place of birth for the foreign-born population - Bangladesh (%)
Place of birth for the foreign-born population - India (%)
Place of birth for the foreign-born population - Iran (%)
Place of birth for the foreign-born population - Kazakhstan (%)
Place of birth for the foreign-born population - Nepal (%)
Place of birth for the foreign-born population - Pakistan (%)
Place of birth for the foreign-born population - Sri Lanka (%)
Place of birth for the foreign-born population - Uzbekistan (%)
Place of birth for the foreign-born population - Other South Central Asia (%)
Place of birth for the foreign-born population - Burma (%)
Place of birth for the foreign-born population - Cambodia (%)
Place of birth for the foreign-born population - Indonesia (%)
Place of birth for the foreign-born population - Laos (%)
Place of birth for the foreign-born population - Malaysia (%)
Place of birth for the foreign-born population - Philippines (%)
Place of birth for the foreign-born population - Singapore (%)
Place of birth for the foreign-born population - Thailand (%)
Place of birth for the foreign-born population - Vietnam (%)
Place of birth for the foreign-born population - Other South Eastern Asia (%)
Place of birth for the foreign-born population - Armenia (%)
Place of birth for the foreign-born population - Iraq (%)
Place of birth for the foreign-born population - Israel (%)
Place of birth for the foreign-born population - Jordan (%)
Place of birth for the foreign-born population - Kuwait (%)
Place of birth for the foreign-born population - Lebanon (%)
Place of birth for the foreign-born population - Saudi Arabia (%)
Place of birth for the foreign-born population - Syria (%)
Place of birth for the foreign-born population - Turkey (%)
Place of birth for the foreign-born population - Yemen (%)
Place of birth for the foreign-born population - Other Western Asia (%)
Place of birth for the foreign-born population - Eritrea (%)
Place of birth for the foreign-born population - Ethiopia (%)
Place of birth for the foreign-born population - Kenya (%)
Place of birth for the foreign-born population - Somalia (%)
Place of birth for the foreign-born population - Uganda (%)
Place of birth for the foreign-born population - Zimbabwe (%)
Place of birth for the foreign-born population - Other Eastern Africa (%)
Place of birth for the foreign-born population - Cameroon (%)
Place of birth for the foreign-born population - Congo (%)
Place of birth for the foreign-born population - Democratic Republic of Congo (Zaire) (%)
Place of birth for the foreign-born population - Other Middle Africa (%)
Place of birth for the foreign-born population - Egypt (%)
Place of birth for the foreign-born population - Morocco (%)
Place of birth for the foreign-born population - Sudan (%)
Place of birth for the foreign-born population - Other Northern Africa (%)
Place of birth for the foreign-born population - South Africa (%)
Place of birth for the foreign-born population - Other Southern Africa (%)
Place of birth for the foreign-born population - Cabo Verde (%)
Place of birth for the foreign-born population - Ghana (%)
Place of birth for the foreign-born population - Liberia (%)
Place of birth for the foreign-born population - Nigeria (%)
Place of birth for the foreign-born population - Senegal (%)
Place of birth for the foreign-born population - Sierra Leone (%)
Place of birth for the foreign-born population - Other Western Africa (%)
Place of birth for the foreign-born population - Australia (%)
Place of birth for the foreign-born population - New Zealand (%)
Place of birth for the foreign-born population - Fiji (%)
Place of birth for the foreign-born population - Micronesia (%)
Place of birth for the foreign-born population - Bahamas (%)
Place of birth for the foreign-born population - Barbados (%)
Place of birth for the foreign-born population - Cuba (%)
Place of birth for the foreign-born population - Dominica (%)
Place of birth for the foreign-born population - Dominican Republic (%)
Place of birth for the foreign-born population - Grenada (%)
Place of birth for the foreign-born population - Haiti (%)
Place of birth for the foreign-born population - Jamaica (%)
Place of birth for the foreign-born population - St. Vincent and the Grenadines (%)
Place of birth for the foreign-born population - Trinidad and Tobago (%)
Place of birth for the foreign-born population - West Indies (%)
Place of birth for the foreign-born population - Other Caribbean (%)
Place of birth for the foreign-born population - Belize (%)
Place of birth for the foreign-born population - Costa Rica (%)
Place of birth for the foreign-born population - El Salvador (%)
Place of birth for the foreign-born population - Guatemala (%)
Place of birth for the foreign-born population - Honduras (%)
Place of birth for the foreign-born population - Mexico (%)
Place of birth for the foreign-born population - Nicaragua (%)
Place of birth for the foreign-born population - Panama (%)
Place of birth for the foreign-born population - Other Central America (%)
Place of birth for the foreign-born population - Argentina (%)
Place of birth for the foreign-born population - Bolivia (%)
Place of birth for the foreign-born population - Brazil (%)
Place of birth for the foreign-born population - Chile (%)
Place of birth for the foreign-born population - Colombia (%)
Place of birth for the foreign-born population - Ecuador (%)
Place of birth for the foreign-born population - Guyana (%)
Place of birth for the foreign-born population - Peru (%)
Place of birth for the foreign-born population - Uruguay (%)
Place of birth for the foreign-born population - Venezuela (%)
Place of birth for the foreign-born population - Other South America (%)
Place of birth for the foreign-born population - Canada (%)
Place of birth for the foreign-born population - Other Northern America (%)
Place of birth for the foreign-born population - Other (%)
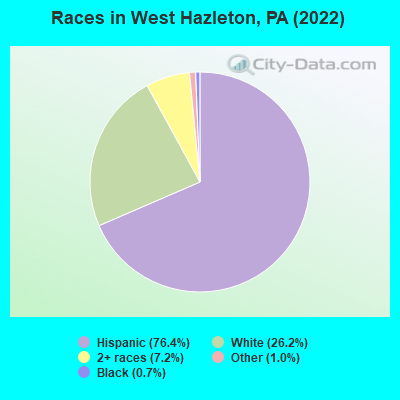
According to 2022 data, the most numerous races in West Hazleton, PA are White alone (1,348 residents), Black alone (35 residents), and Hispanic (3,933 residents). 42.5% of West Hazleton residents speak English at home. 34.1% of West Hazleton, PA residents are foreign-born (31.5% born in Latin America), which is 79.5% greater than the foreign-born rate of 7.0% across the entire state of Pennsylvania.
Race distribution in West Hazleton
2000 2022
10,322,455 84.1% White alone 1,202,437 9.8% Black alone 394,088 3.2% Hispanic 218,296 1.8% Asian alone 113,097 0.9% Two or more races 13,086 0.1% Other race alone 14,904 0.1% American Indian alone 2,691 0.02% Native Hawaiian and Other
9,487,228 73.1% White alone 1,311,581 10.1% Black alone 1,115,997 8.6% Hispanic 493,942 3.8% Two or more races 487,124 3.8% Asian alone 63,582 0.5% Other race alone 10,130 0.08% American Indian alone 2,424 0.02% Native Hawaiian and Other
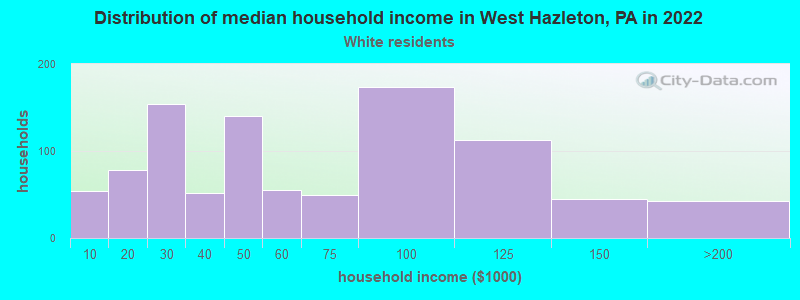
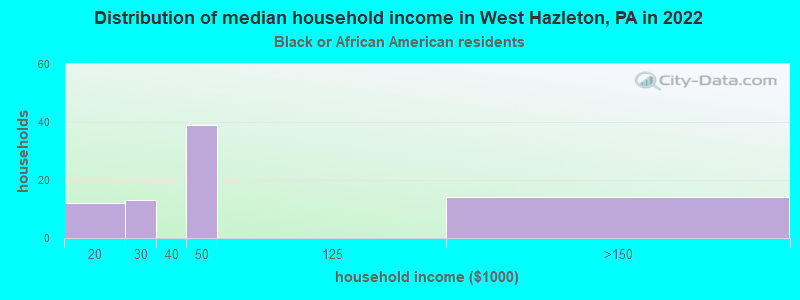
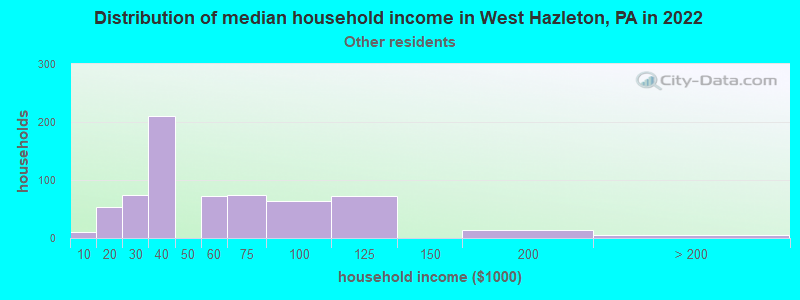
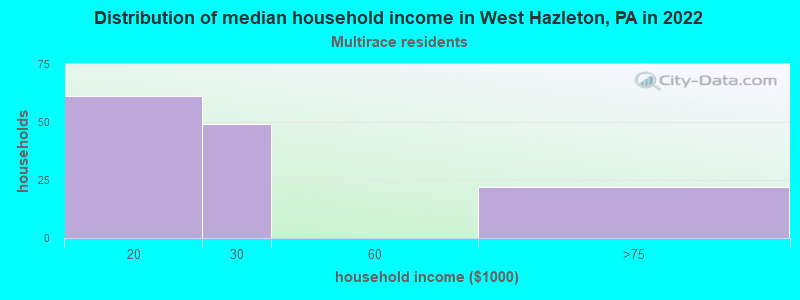
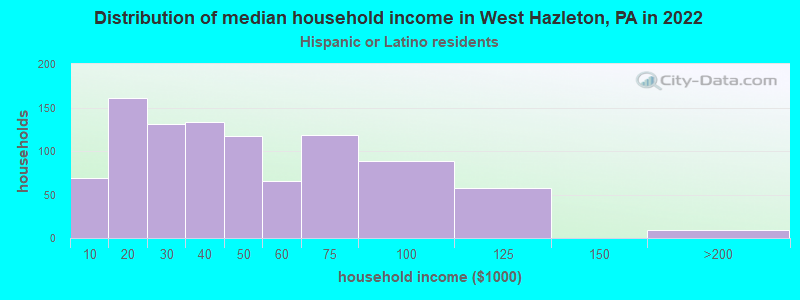
Income and house value in West Hazleton Median household income in 2022 $53,655 White non-Hispanic householders$61,733 Black householders$53,185 Some other race householders$11,109 Two or more races householders$34,466 Hispanic or Latino race householdersMedian 2022 house value $113,046 White Non-Hispanic householders$109,080 Some other race householders$95,792 Hispanic or Latino householders
Median age by race in West Hazleton
55.6 Median age for White residents58.9 53.5 18.5 Median age for Black or African American residents18.4 21.2 -1,365,781,709.5 Median age for American Indian / Alaska Native residents-884,488,448.0 -1,340,606,059.3 -709,732,988.1 Median age for Asian residents-672,268,906.9 -753,760,886.0 -750,524,108.3 Median age for Native Hawaiian / Pacific Islander residents-424,242,423.8 -747,474,746.7 26.0 Median age for Other race residents28.8 20.0 23.0 Median age for Two or more races residents26.1 23.4 60.1 Median age for White alone residents60.0 60.0 22.7 Median age for Hispanic or Latino residents26.1 21.0
Owner/renter occupied households by race in West Hazleton
House owners and renters - White residents 648 67.2% Owner occupied316 32.8% Renter occupiedHouse owners and renters - Black or African American residents 13 19.0% Owner occupied54 81.0% Renter occupiedHouse owners and renters - Other race residents 644 75.9% Owner occupied204 24.1% Renter occupiedHouse owners and renters - Two or more races residents 95 72.8% Owner occupied35 27.2% Renter occupiedHouse owners and renters - White alone residents 611 73.6% Owner occupied219 26.4% Renter occupiedHouse owners and renters - Hispanic or Latino residents 659 63.4% Owner occupied380 36.6% Renter occupied
Language usage in West Hazleton
English speakers - Total 42.5% of residents of West Hazleton speak English at home.
67.4% of residents speak Spanish at home 1,938 60.2% Speak English very well1,281 39.8% Speak English less than very well0.7% of residents speak other language at home 8 25.0% Speak English very well24 75.0% Speak English less than very well
English speakers - Born in the United States 38.7% of residents of West Hazleton speak English at home.
68.1% of residents speak Spanish at home 790 96.5% Speak English very well29 3.5% Speak English less than very well
English speakers - Native, born elsewhere 14.6% of residents of West Hazleton speak English at home.
70.4% of residents speak Spanish at home 226 100.0% Speak English very well
English speakers - Foreign-born 4.8% of residents of West Hazleton speak English at home.
102.9% of residents speak Spanish at home 692 37.8% Speak English very well1,141 62.2% Speak English less than very well1.1% of residents speak other language at home 20 100.0% Speak English less than very well
White (Caucasian) - Speak only English Native:
95.8% (1,328)Foreign-born:
57.8% (56)
White (Caucasian) - Speak another language Native:
3.0% (42)Foreign-born:
100.0% (97)
Black or African American - Speak another language Native:
100.0% (469)Foreign-born:
88.6% (72)
Other race - Speak only English Native:
23.6% (304)Foreign-born:
3.1% (47)
Other race - Speak another language Native:
76.1% (983)Foreign-born:
96.8% (1,471)
Two or more races - Speak another language Native:
18.3% (88)Foreign-born:
100.0% (193)
White alone - Speak only English Native:
99.5% (1,302)Foreign-born:
100.0% (33)
Hispanic or Latino - Speak only English Native:
22.5% (373)Foreign-born:
2.1% (38)
Hispanic or Latino - Speak another language Native:
80.4% (1,331)Foreign-born:
97.8% (1,819)
Foreign-born residents in West Hazleton 1,756 residents are foreign born (31.5% Latin America ).
This city:
34.1%Pennsylvania:
7.3%
Marital status for residents in West Hazleton Marital status - White (Caucasian) population 15 years and over
Males 43.4% Never married38.9% Now married0.0% Separated6.1% Widowed11.5% DivorcedFemales 20.7% Never married45.4% Now married5.8% Separated13.0% Widowed15.1% DivorcedWomen who gave birth in the past 12 months Now married:
51.6% (43)Unmarried:
48.4% (40)
Women who did not give birth in the past 12 months Now married:
45.9% (105)Unmarried:
54.1% (124)
Marital status - Black or African American population 15 years and over
Males 92.9% Never married0.0% Now married0.0% Separated0.0% Widowed7.1% DivorcedFemales 34.9% Never married51.6% Now married0.0% Separated0.0% Widowed13.5% DivorcedWomen who did not give birth in the past 12 months Now married:
40.9% (50)Unmarried:
59.1% (73)
Marital status - Other race population 15 years and over
Males 52.1% Never married39.4% Now married7.6% Separated0.0% Widowed0.9% DivorcedFemales 43.8% Never married54.7% Now married0.0% Separated0.0% Widowed1.4% DivorcedWomen who gave birth in the past 12 months Now married:
57.1% (29)Unmarried:
42.9% (22)
Women who did not give birth in the past 12 months Now married:
50.9% (387)Unmarried:
49.1% (372)
Marital status - Two or more races population 15 years and over
Males 56.1% Never married34.8% Now married0.0% Separated0.0% Widowed9.1% DivorcedFemales 56.4% Never married31.6% Now married0.0% Separated0.0% Widowed12.0% DivorcedWomen who did not give birth in the past 12 months Now married:
0.0% (0)Unmarried:
100.0% (107)
Marital status - White alone, not Hispanic / Latino population 15 years and over
Males 36.4% Never married42.3% Now married0.0% Separated7.4% Widowed13.9% DivorcedFemales 18.5% Never married51.7% Now married3.2% Separated15.2% Widowed11.5% DivorcedWomen who gave birth in the past 12 months Now married:
100.0% (44)Unmarried:
0.0% (0)
Women who did not give birth in the past 12 months Now married:
42.1% (76)Unmarried:
57.9% (104)
Marital status - Hispanic or Latino population 15 years and over
Males 60.2% Never married33.0% Now married5.2% Separated0.0% Widowed1.5% DivorcedFemales 38.0% Never married50.0% Now married2.5% Separated0.0% Widowed9.4% DivorcedWomen who gave birth in the past 12 months Now married:
25.0% (23)Unmarried:
75.0% (69)
Women who did not give birth in the past 12 months Now married:
50.1% (412)Unmarried:
49.9% (411)
Ancestries in West Hazleton
173 5.6% Polish124 4.0% Italian87 2.8% American77 2.5% Irish67 2.2% English61 2.0% German17 0.5% Russian15 0.5% Ghanaian13 0.4% Scottish12 0.4% French11 0.4% Czech11 0.4% Eastern European10 0.3% Portuguese10 0.3% Slovak7 0.2% African7 0.2% Ukrainian6 0.2% Lithuanian5 0.2% European2 0.06% Austrian
Children Nativity (place of birth) in West Hazleton
Children under 6 years - Living with two parents Both parents foreign-born 109 100.0% NativeOne native, one foreign-born parent 30 100.0% NativeChildren under 6 years - Living with one parent Native parent 220 100.0% NativeForeign-born parent 131 100.0% NativeChildren 6 to 17 years - Living with two parents Both parents foreign-born 525 95.4% Native25 4.6% Foreign-bornChildren 6 to 17 years - Living with one parent Native parent 45 100.0% NativeForeign-born parent 367 56.5% Native283 43.5% Foreign-born
Grandparents responsible for own grandchildren in West Hazleton
Grandparents (30 to 59 years) Other race 68 100.0% Not responsible for grandchildrenHispanic or Latino 51 100.0% Not responsible for grandchildren
Grandparents (60 years and over) Other race 87 100.0% Not responsible for grandchildrenHispanic or Latino 92 100.0% Not responsible for grandchildren